

 PDF
PDF ePub
ePub Citation
 Print
Print


INTRODUCTION
Dramatic advances in magnetic resonance imaging (MRI) technology in the last few years, particularly substantial refinements in hardware and coil systems, have made diffusion-weighted imaging (DWI) a promising technique used across the whole body (1). Besides anatomic and structural information, DWI renders information about functional properties and quantitative metrics in terms of apparent diffusion coefficient (ADC) of assessed tissue (2). Because DWI is based on the Brownian motion of water in biological tissues, it can reveal early vascular or microstructural changes in tissues without use of intravenous contrast media (3). These properties, with recent advances in MRI technology, have resulted in widespread use of DWI in multiple clinical applications (4).
The ADC value is a promising imaging biomarker for quantification of changes induced by chemotherapy, radiation therapy, and radiofrequency ablation in various diseases (567). To date, many studies have revealed that DWI is useful in detection and characterization of lesions, nodal staging, liver fibrosis staging, and assessment of treatment responses (8910111213). Since ADC measurement derived from DWI reflects mobility of water molecules within tissue, it reflects early changes in lesion cellularity and development of microscopic tumor necrosis (814). However, magnetic resonance (MR) systems and sequence parameters applied may vary across different rounds of imaging. Thus, to use the ADC value as a qualified biomarker and a prognostic parameter in longitudinal, multicenter studies, it is necessary for ADC measurements to be standardized.
Apparent diffusion coefficient values are influenced by many factors that may be related to patients, hardware, acquisition parameters, motion artifacts, and susceptibility effects (1516). A recent study of patients that underwent three rounds of MRI scans at different time points with variable b-value combinations and respiratory motion compensation techniques revealed that normalized ADC using the spleen as the reference organ significantly decreased variability in ADC measurement of upper abdominal organs (17). However, findings of that study were limited in that most of the ADCs (81%) were acquired with two b-value combinations (b = 0, 50, 400, 800 and 0, 50, 600 s/mm2). Since ADC values are substantially influenced by choice of b-values, it is necessary to prove if ADC normalization using a reference organ is possible for various b-value combinations. To be considered as a reference organ; the organ must be identically affected by diffusion-related parameters as the target organ and/or lesion. The spleen may be an ideal reference organ since it reveals a relatively stable ADC value over various disease states and has been used when quantitative analysis using ratios is required (181920).
The purpose of this study was to compare the ADC values with six b-value combinations and to evaluate the possibility of ADC normalization using the spleen as the reference organ.
Go to : 
MATERIALS AND METHODS
Study Population
This investigation was designed as a retrospective study of the gadoxetic acid-enhanced MR images and DWI of 312 patients that underwent liver MRI scans at our hospital August 1, 2014–July 31, 2015. Of 312 patients, 212 were excluded for the following reasons: 1) severe atrophic changes or absence of scanned organ, such as liver, pancreas, or kidney (n = 115); 2) severe susceptibility artifacts (n = 51); 3) inadequate scan range (n = 37); or 4) liver mass with largest lesion diameter over 10 cm or mass replacing more than half of the lobe (n = 9). Finally, 100 patients (56 men and 44 women; mean age, 63.9 years) were considered for further analysis. Of 100 patients, 22 (22%) had biliary malignancy, 12 (12%) had liver cirrhosis, 11 (11%) had chronic hepatitis, 6 (6%) had acute pancreatitis, 6 (6%) had acute cholecystitis, and 3 (3%) had fatty liver. The remaining 34 patients (34%) were admitted to the emergency department. Study protocol was approved by the research ethics committee of our hospital, and requirement for informed consent from the patients was waived.
MR Imaging Techniques
Routine liver MR imaging was conducted using a 3T MR system (Intera Achieva TX, Philips Healthcare, Best, the Netherlands), with a 32-channel flexible anteroposterior phased-array coil. During liver MR examination, coronal and axial single-shot, T2-weighted, fast spin-echo sequences were obtained in addition to a breath-hold, axial, T1-weighted dual-echo (in-phase and opposed-phase) sequence. Axial T1-weighted three-dimensional gradient recalled echo with fat saturation was obtained before and after (35, 70, 120, and 180 seconds, and 10 and 20 minutes) administration of the bolus injection of gadoxetic acid (Gd-EOB-DTPA; Eovist or Primovist; Bayer Healthcare, Berlin, Germany). The respiratory-triggered, fat-suppressed, T2-weighted, fast spin-echo sequence was obtained between 3 and 10 minutes of the hepatobiliary phase, while DWI was obtained between 10 and 20 minutes of the hepatobiliary phase.
Diffusion-weighted imaging was conducted with single-shot spin-echo echo-planar imaging (EPI) under free-breathing conditions. Acquisition parameters were as follows: repetition time/echo time ratio, 8750/66 msec; field of view, 400 × 400; matrix, 128 × 128; slice thickness, 5 mm; intersection gap, 1 mm; number of slices, 35; number of signals acquired, 3; b values = 0, 50, 400, 800 s/mm2; parallel acquisition factor, 2; fat saturation technique, spectral attenuated inversion recovery; acquisition time, 5:35; and EPI factor, 65.
Quantitative Image Analysis
Apparent diffusion coefficient maps were automatically generated on the MR system console with mono-exponential fitting of the selected b-values. ADC maps were generated using six b-value combinations, including b1 = 0, 50, 400, 800; b2 = 0, 800; b3 = 0, 50, 800; b4 = 0, 400, 800; b5 = 50, 800; and b6 = 50, 400, 800 s/mm2. For all cases, the same radiologist, with two years of experience in body MR imaging, drew regions of interest (ROI) for each anatomic region on the b = 0 s/mm2 images using the picture archiving and communication system (PACS) (Maroview 5.4; Marotech, Seoul, Korea). The copy and paste function of the PACS was used to ensure that positions of the ROIs on corresponding ADC maps with different b-value combinations remained identical (Fig. 1). According to each anatomic region and the patient, sizes of the ROIs were variable when excluding vessels, surrounding tissues, and artifacts (range, 2–8 cm2). Anatomic regions analyzed were the right and left liver lobes, spleen, pancreas, and right and left kidneys. For the right and left liver lobes, measurements were obtained for two ROIs from three contiguous slices, with a central section obtained through the level of the right portal vein for the right lobe and umbilical portion of the left portal vein for the left lobe. For the spleen, measurements were made for two ROIs from three contiguous slices, with a central section obtained through the level of the splenic hilum. For the pancreas, two ROIs were obtained at head, body, and tail. Since the pancreas is a particularly difficult organ to measure due to its small size and possibility of artifacts, magnification of DWI was used for better accuracy. Measurements of the ROIs of both kidneys were obtained on three contiguous slices with two ROIs, with a central section through the level of the mid-pole. A total of 216 ROIs were drawn per patient. For normalization, the ADC values of the above mentioned 5 anatomic regions were divided by the ADC values of the spleen.
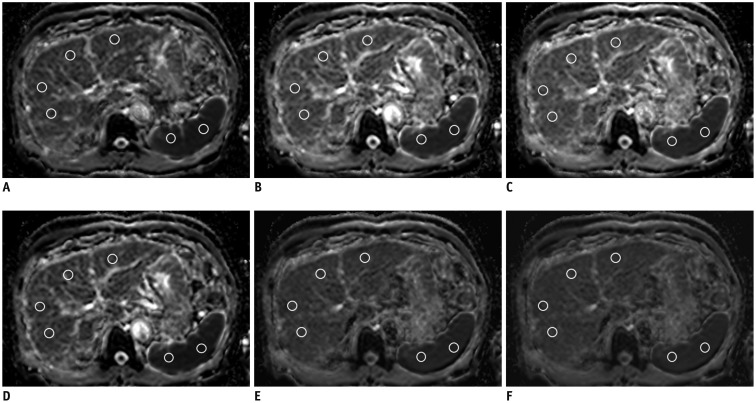 | Fig. 1ADC maps with six b-value combinations in 64-year-old man with hepatitis B cirrhosis.Region of interests for ADC measurements of right and left liver lobe and spleen are indicated by white circles.
A. b1 = 0, 50, 400, 800 s/mm2. B. b2 = 0, 800 s/mm2. C. b3 = 0, 50, 800 s/mm2. D. b4 = 0, 400, 800 s/mm2. E. b5 = 50, 800 s/mm2. F. b6 = 50, 400, 800 s/mm2. ADC = apparent diffusion coefficient
|
Statistical Analysis
Variability in the original and normalized ADCs of 5 anatomic regions in 6 sets of ADC maps were evaluated using the intraclass correlation coefficient (ICC), using a two-way random-effects model with absolute agreement. Degree of agreement between the 6 sets of ADC maps for different values of ICC was interpreted as follows: ICC ≤ 0.20, slight; 0.2 < ICC ≤ 0.4, fair; 0.4 < ICC ≤ 0.6, moderate; 0.6 < ICC ≤ 0.8, substantial; and ICC > 0.8, almost perfect (21). For comparison of ICCs between the original ADC and normalized ADC, Fisher's Z-test for testing equality of dependent ICCs was used (22). To compare original and normalized ADCs in 6 sets of ADC maps, repeated-measures analysis of variances (ANOVA) was conducted. To assess variability of ADCs with multiple b-value combinations, coefficient of variance (CV) was calculated as the standard deviation of the mean for original and normalized ADCs of the 5 anatomic regions. The Wilcoxon test was used to compare CVs of the original and normalized ADCs. Statistical analysis was conducted using commercially available software (SAS, version 9.2; SAS Institute Inc., Cary, NC, USA, and MedCalc, version 13.0.0.0; MedCalc, Mariakerke, Belgium). P values less than 0.05 indicated statistical significance.
Go to :
RESULTS
Variability of ADC Values
Mean ADC values were lowest for the spleen and highest for the kidney at all b-value combinations (Table 1). ICC of the original ADC was lowest for the right liver lobe (0.5145; 95% confidence interval [CI], 0.2111–0.7126) and highest for the pancreas (0.6509; 95% CI, 0.3923–0.7958) (Table 2).
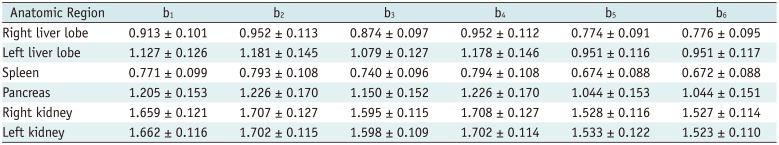
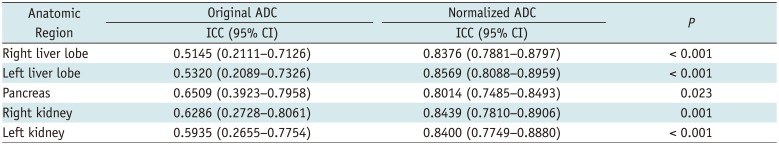
Table 1
ADC Values of Six Anatomic Regions with Multiple b-Value Combinations
![]()
Table 2
Agreement of Original and Normalized ADC Values
![]()
Variability of ADC Values after Normalization
Normalized ADC ranged from 1.168 to 1.214, 1.432 to 1.509, 1.567 to 1.592, 2.184 to 2.307, and 2.182 to 2.310 for the right liver lobe, left liver lobe, pancreas, right kidney, and left kidney, respectively (Table 3). After normalization with the spleen as the reference organ, ICCs ranged from 0.8014 to 0.8569, revealing almost perfect agreement for all 5 anatomic regions. ICCs of the original ADC and normalized ADC differed significantly in all 5 anatomic regions (p < 0.05) (Table 2).
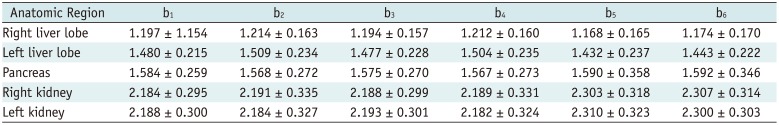
Table 3
Normalized ADC of Five Anatomic Regions with Multiple b-Value Combinations
![]()
Comparison of ADC Values before and after Normalization
Before normalization, ADC values of upper abdominal organ at all b-value combinations were statistically different, except in the b2 vs. b4 and b5 vs. b6 (Table 4). After normalization using the spleen as the reference organ, normalized ADC values of the right liver lobe and pancreas did not differ significantly with six b-value combinations, and most b-value combinations did not differ significantly for the left liver lobe, though some b-value combinations differed significantly for the kidneys (Table 5).
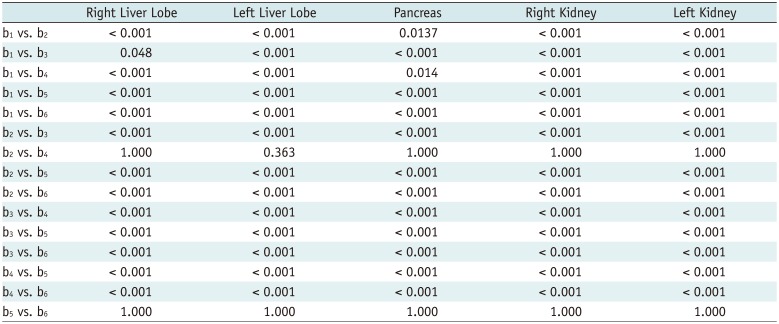
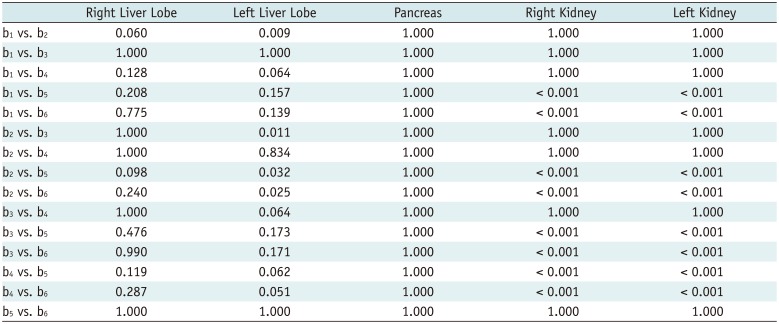
Table 4
Comparison of Original ADC with Multiple b-Value Combinations
![]()
Table 5
Comparison of Normalized ADC Using Spleen as Reference Organ with Multiple b-Value Combinations
![]()
CV Measurements
Median CV of the original ADCs of the 5 anatomical regions ranged from 4.8% to 8.8%, with values lowest for the right and left kidneys and highest for the left liver lobe. Conversely, median CV of normalized ADCs were 3.0–3.8%, with lowest and highest values obtained for the right liver lobe and pancreas, respectively. CVs of the original ADC and normalized ADC revealed significant difference for all anatomical regions, with the CV of normalized ADC consistently lower than that of the original ADC (p < 0.05) (Table 6).
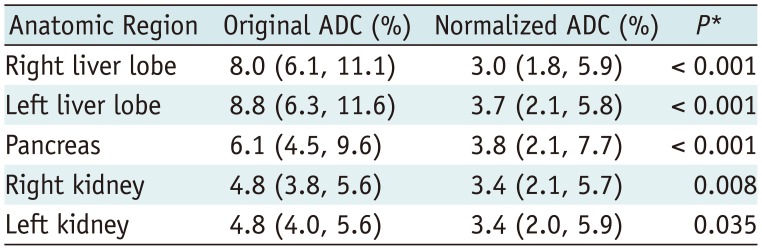
Table 6
Coefficient of Variation between Original ADC and Normalized ADC
![]()
Go to :
DISCUSSION
To use ADC as a quantitative imaging biomarker in research and clinical practice, good reproducibility and reliability is required, as well as standardization and optimization of DWI acquisition techniques. Recent studies have revealed that acceptable levels of reproducibility can be achieved in ADC measurements of the upper abdomen for volunteers and patients (23242526). In addition to good reproducibility, reliability in the interpretation of ADC values from variable acquisition techniques is necessary for longitudinal follow-up or multicenter studies (27).
A recent study suggested the possibility of normalizing ADC values of upper abdominal organs using the spleen as the reference organ in two different 3T MR systems within a patient cohort (28). Another study demonstrated good agreement between three MR examinations at different time points with variable DWI acquisition techniques when normalizing ADC values of the upper abdominal organs using the spleen as a reference organ (17). However, that study was limited in that most of the ADCs (81%) were acquired with two b-value combinations (b = 0, 50, 400, 800 and 0, 50, 600 s/mm2).
In this study, we analyzed 6 sets of ADC maps with variable b-value combinations, with emphasis on the possibility of ADC normalization using a reference organ. We used the spleen as a reference organ because the spleen is usually included in a scan range of liver and abdominal MR imaging, is less prone to systemic disease, and is a highly perfused organ (2930). ICC of the normalized ADC for all 5 anatomic regions revealed almost perfect agreement, and its value was significantly higher than that of the original ADC. On repeated ANOVA, the original ADC revealed significant difference across multiple b-value combinations except in case of b2 (b = 0, 800 s/mm2) vs. b4 (b = 0, 400, 800 s/mm2) and b5 (b = 50, 800 s/mm2) vs. b6 (b = 50, 400, 800 s/mm2). However, normalized ADC did not differ significantly in the right liver lobe, pancreas, and most of the left liver lobe.
Since ADC values are largely affected by the choice of b-values, verifying the possibility of ADC normalization in various b-value combinations is mandatory. Interestingly, combinations of b2 vs. b4 and b5 vs. b6 of the original ADC did not reveal difference on repeated ANOVA (p = 1.0). One common phenomenon noted was that the inclusion or exclusion of b = 400 s/mm2 did not affect the original ADC. Since mono-exponential fitting was used for ADC map calculation, the ADC value is essentially the absolute line slope value of exponential decrease of signal intensities in diffusion images, and the line intercept is not used in the following equation used for ADC map calculation: “S = S0 × exp(−b x ADC),” wherein S is the signal intensity after application of the diffusion gradient and is the signal intensity on the diffusion image acquired at b = 0 s/mm2 (31). When obtaining the best line fit using the least squares line fit formula with three b-values, such as 0, 400, and 800 s/mm2 or 0, 500, and 1000 s/mm2 wherein the third b-value is a multiple of the second, the b-value 400 or 500 s/mm2 will have no effect on ADC values (32). Since there were no studies with large number of patients regarding this issue, we analyzed the value of normalization including b2, b4, b5, and b6. However, when comparing b1 (b = 0, 50, 400, 800 s/mm2) and b3 (b = 0, 50, 800 s/mm2), the original ADC differed significantly (p < 0.05). We, therefore, infer that presence of two low b-values (0 and 50 s/mm2) may have made the ADC values more sensitive to medium b values (400 s/mm2), reflecting the true diffusion coefficient.
Repeated ANOVA revealed that after normalization of the ADC values, some of the b-value combinations applied for the left liver lobe (b1 vs. b2, b2 vs. b3, b2 vs. b5, and b2 vs. b6) and most of the b-value combinations applied for the kidneys were significantly different. Only b1 vs. b3, b1 vs. b4, and b3 vs. b4 did not reveal difference across the 5 anatomic regions. Although b1 vs. b4 and b3 vs. b4 did not reveal difference between the 5 anatomic regions, the left liver lobe revealed relatively low p value (p = 0.064). In longitudinal or multicenter studies, a comparison of the liver ADCs avoiding only b2 will be sufficient, particularly in the case of the right liver lobe. However, when comparing all the upper abdominal organs including the kidneys, more careful choice of b-value combinations is required. The kidney may be more prone to motion and susceptibility artifacts caused by proximity of the bowels, that may cause variability in the ADC measurement. In addition, the ADC values of the kidney can be measured either from the cortex or medulla. Some studies have provided separate ADC measurements for the cortex and medulla, while others have not (151733). In this study, we did not differentiate between the cortex and medulla. These factors may have affected our study result. More studies on normalizing the ADC values of the kidney are warranted.
Although direct comparison of mean ADC values obtained in this study with those reported previously may be inappropriate due to differences in patient cohort and DWI acquisition techniques, the mean of normalized ADC obtained in this study was within range of values reported previously. In our study, highest normalized ADC was obtained for kidneys (2.182–2.310 vs. 2.214–2.279 reported previously) and lowest value was obtained for the right liver lobe (1.168–1.214 vs. 1.303–1.348 reported previously, respectively) (1728). CV of the original ADC (4.8–8.8%) and normalized ADC (3.0–3.8%) was within the range reported in previous studies (6.9–11.1% for original ADC and 2.4–5.5% for normalized ADC) (1728). Additionally, CVs of normalized ADC was significantly lower than that of the original ADC, suggesting that normalized ADC reduced variability in multiple b-value combinations compared to the original ADC. From these results, we derive that more than 11.8% (1.96·CV) change in normalized ADC could be considered a significant difference in follow-up or multicenter studies (24). Further studies to determine the exact range of significant difference in normalized ADC are necessary.
This study has several limitations. First, one radiologist measured ADC; therefore, the effect of inter-observer variation on the results could not be assessed. However, studies have proven that reproducibility and inter-observer agreement regarding ADC measurements are acceptable (263334). Second, the patient cohort was heterogeneous and included emergency room patients. This may have affected the image quality because most of the emergency room patients had acute conditions, resulting in more pronounced image artifacts. Third, only a limited number of b values as well as choice of b-value combinations were evaluated for normalization. Further study including many factors influencing ADC measurements (e.g., choice of different b values, field strength, respiratory motion compensation method) is warranted. Fourth, lesion analysis could not be conducted due to the small number of patients with adequate lesions. Prospective studies with lesion analysis are warranted in the future.
In conclusion, the normalized ADC of upper abdominal organs using the spleen as the reference organ significantly decreased variability in ADC measurement acquired with multiple b-value combinations. Further investigations are necessary to determine the accepted range of difference between different MR systems or acquisition techniques to facilitate widespread application normalized ADC in research and clinical practice.
Go to :
 XML Download