

 PDF
PDF ePub
ePub Citation
 Print
Print


INTRODUCTION
Thymic carcinoma and lymphoma are the two most common malignant lesions originating in the anterior mediastinal region (1). The accurate differentiation of these two entities is very important for determining the individual treatment strategy. Surgery combined with chemoradiotherapy is recommended as the first-line treatment for thymic carcinoma; while chemotherapy is more preferred for lymphoma (23). A biopsy is the gold standard, but it is invasive and may be associated with sampling error (4).
Diffusion weighted imaging (DWI) is sensitive to the random thermal movement of water molecules, and can probe the structure of biological tissues at the microscopic level (5). In terms of the evaluation of mediastinal masses, DWI has been used to differentiate and stage thymic epithelial tumors and differentiate malignant from benign mediastinal masses (4678910). However, to the best of our knowledge, no study has exclusively assessed the value of DWI in differentiating thymic carcinoma from lymphoma until now.
In addition, most previous studies used the manually selected local region-of-interest (ROI) on one or several representative sections for quantitative measurement, and usually only the mean apparent diffusion coefficient (ADC) was obtained (511). The major drawback of this method is that it ignores the tumor's heterogeneity. Moreover, this method can result in noticeable inter-reader variability. In contrast, a histogram analysis based on the entire tumor can reflect the tumor's heterogeneity and reduce the inter-reader variability to a certain extent. Previously, the superiority of the histogram analysis approach was reported in several clinical applications ranging from tumor characterization to the evaluation of treatment response (1213141516).
Therefore, the purposes of this study were to assess the value of a whole-tumor histogram analysis of ADC maps to differentiate thymic carcinoma from lymphoma, and to compare it with that of a commonly used hot spot ROIs based ADC measurement.
Go to : 
MATERIALS AND METHODS
Patients
Our institutional review board approved this retrospective study and waived the requirement for informed consent due to the nature of this study. After searching the database, the MR images of a total of 70 patients with histologically confirmed mediastinal tumors were found between May 2015 and November 2016. The following exclusion criterions were applied: 1) the pathological diagnosis was not thymic carcinoma or lymphoma (n = 27); 2) DWI was not performed as a part of the pre-surgery evaluation (n = 2); 3) a previous history of biopsy or any treatment (n = 5); 4) the diameter of the tumor was less than 1 cm (n = 2); and 5) a significant motion artifact and the image quality of DWI were not adequate for further processing (n = 6). Ultimately, 15 patients with thymic carcinoma (6 men, 9 women, mean age 52.6 years, range 41–76 years) and 13 patients with lymphoma (7 men, 6 women, mean age 33.2 years, range 18–49 years) were enrolled in the study.
Magnetic Resonance Imaging
MR scans were performed by using a 3T MR scanner (Verio, Siemens Medical System, Erlangen, Germany). The imaging protocols included an unenhanced axial T1-weighted imaging (repetition time [TR]/echo time [TE], 140/2.5 ms), coronal T2-weighted imaging (TR/TE, 1200/93 ms) and DWI. A standard single-shot spin echo-planar imaging sequence was used for the DWI scan with two b values (0 and 1000 s/mm2) in 3 orthogonal directions. The imaging parameters were as follows: TR/TE, 6600/76 ms; number of averages, 2; field of view, 360 × 360 mm; slice thickness, 4 mm without gap; matrix, 144 × 117; number of sections, 20. The total acquisition time of DWI was 1 minute 45 seconds.
Imaging Processing
All data were transferred in the Digital Imaging and Communication in Medicine format, from a picture archiving and communication system workstation to an independent, personal computer for further analysis. The DWI data were processed off-line with in-house software (FireVoxel; CAI2R, New York University, New York, NY, USA) (17). An ADC map was generated using a mono-exponential fitting model.
In terms of the histogram analysis, ROIs were manually drawn on all of the image slices which encompassed much of the tumor area. Large fatty, necrotic, cystic, and hemorrhagic areas displayed on the T2-weighed image were excluded. After the ROIs were drawn, a histogram analysis was performed. The parameters derived from the histogram analysis included: mean ADC (ADCmean), median ADC (ADCmedian), 10th and 90th percentiles of ADC (ADC10 and ADC90), skewness, and kurtosis. The nth percentile was the point at which n% of the voxel values that form the histogram were found to the left (1314). Kurtosis, which is a measure of the peakedness of the histogram, was categorized as follows: values that are equal to 3 indicate the histogram is Gaussian, values greater than 3 indicate a sharper peak, and values less than 3 indicate a flatter top. Skewness, which is a measure of the asymmetry of the histogram, is positive if the majority of the data is concentrated on the left of the histogram and negative if the majority of data is concentrated on the right (14).
In terms of the hot-spot-ROI-based mean ADC measurements, the slice on which the tumor showed the biggest diameter was chosen. Three circular ROIs (about 0.5 cm2) were then drawn on the tumor area which demonstrated mostly as increased signal intensity on the DW image (b1000 map). Similarly, large fatty, necrotic, cystic, and hemorrhagic areas were excluded during the placement of the ROIs. The measured ADCs from the three ROIs were then averaged to a mean ADC for further statistical analyses. Two ROIs selection methods during the hot-spot-ROI-based and histogram-based ADC measurements are demonstrated in Figure 1.
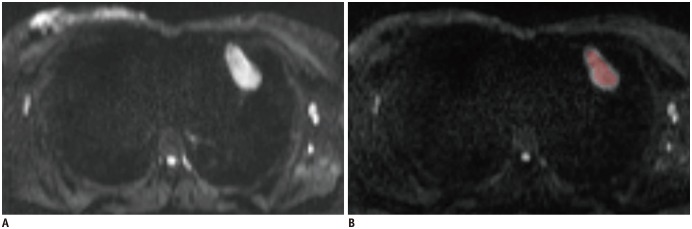 | Fig. 1Schematic diagram of placements of ROIs.In terms of hot spot ROI based mean ADC measurements, slice on which tumor showed biggest diameter was chosen. Three circular ROIs were drawn on tumor's area which demonstrated mostly increased signal intensity on diffusion weighted image (b1000 map) (A). In terms of histogram analysis, ROIs were manually drawn on each slice that encompassed much of tumor area (B). ADC = apparent diffusion coefficient, ROI = region of interest
|
Both the histogram-based and hot-spot-ROI-based ADCs measurements were performed by two experienced radiologists (reader 1: with 14 years of clinical experience; reader 2: with 5 years of clinical experience). The measurements of these two radiologists were used to assess the inter-reader reproducibility. To assess the intra-reader reproducibility, all the measurements were repeated again by the reader 1 a minimum of one month later. The average of the two measurements from reader 1 was used for further statistical analyses.
Statistical Analysis
Statistical analyses were performed using a software package (SPSS 19.0, IBM Corp., Armonk, NY, USA). Numeric data was averaged over all patients and reported as mean ± standard deviation, and Kolmogorov-Smirnov's test was used to test normality. The between-group comparisons of age and histogram parameters were compared using independent sample t tests. Comparisons of patient sex were compared using the Fisher exact test. Receiver operating characteristic (ROC) curves were drawn to determine the diagnostic value of the histogram parameters for differentiating two kinds of tumors, with a calculation of the cut-off value, sensitivity, specificity, and area under the ROC curve (AUC). The AUCs were compared using the method developed by Delong et al. (5). The intra-class correlation coefficient (ICC) was used to estimate the inter- and intra-reader agreement of the histogram parameters. ICCs were interpreted as follows: 0.00–0.40 was poor; 0.41–0.60 was moderate; 0.61–0.80 was good; and 0.81–1.00 was excellent. A p value of less than 0.05 indicated statistical significance.
Go to :
RESULTS
Pathologically, all the thymic carcinomas in our study were squamous cell carcinoma. The pathological compositions of the 13 lymphoma patients included diffuse large B cell lymphoma (n = 10), Hodgkin lymphoma (n = 2), and T-cell lymphoblastic lymphoma (n = 1). There was no significant difference in sex between the two groups (p = 0.464). The lymphoma group were significantly younger than thymic carcinomas group (p < 0.001). There was no significant difference in the largest diameter between the two groups (7.0 ± 2.3 cm vs. 8.8 ± 3.9 cm, p = 0.145). Detailed demographic information is summarized in Table 1.
Table 1
Demographic Information of Our Study Cohort
![]()
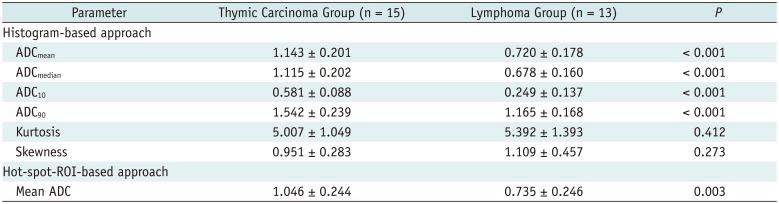
Table 2 summarizes the detailed comparisons of the histogram-based and hot-spot-ROI-based ADC measurements between the thymic carcinoma and lymphoma groups. The lymphoma group exhibited significantly lower ADC10, ADCmedian, ADCmean, and ADC90 (all p values < 0.001) and hot-spot-ROI-based mean ADC (p = 0.003) than were found in the thymic carcinoma group (Fig. 2). There were no significant differences found in the kurtosis (p = 0.412) and skewness (p = 0.273). Representative cases of thymic carcinoma and lymphoma are shown in Figures 3 and 4, respectively.
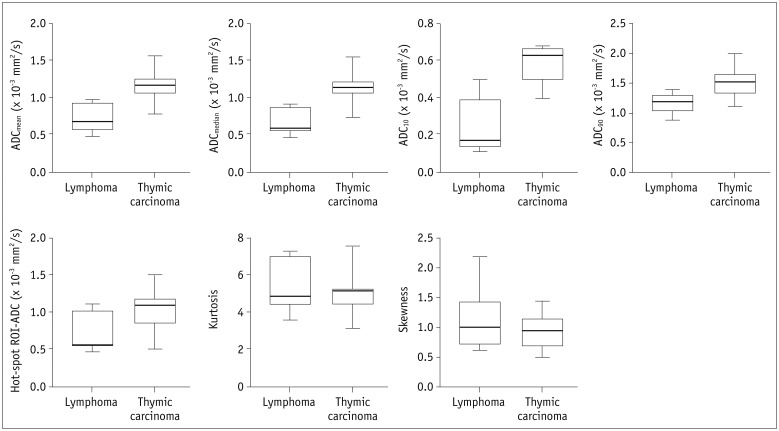 | Fig. 2Box plots show comparison of histogram-based and hot-spot-ROI-based ADC measurements between thymic carcinoma and lymphoma.
|
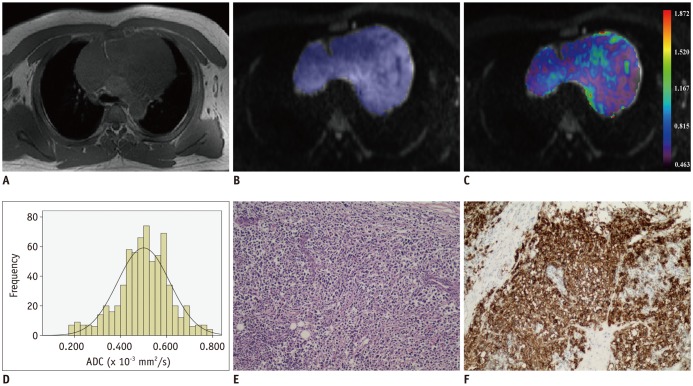 | Fig. 3Images of 39-year-old man with diffuse large B cell lymphoma.Axial T1-weighted image (A) shows mass in anterior mediastinal region. After ROI was placed (B), pixel-by-pixel colored ADC map (C) was generated and embedded in axial diffusion-weighted imaging. Histogram analysis of whole lesion shows lower cumulative ADC value but higher relative frequency (D). ADCmedian and ADC10 were 0.502 and 0.146 × 10⁻³ mm2/s, respectively. Typical histopathologic appearance on hematoxylin-eosin stain (E, × 10) and CD20 positive on immunohistochemistry (F, × 10) confirmed diagnosis of lymphoma.
|
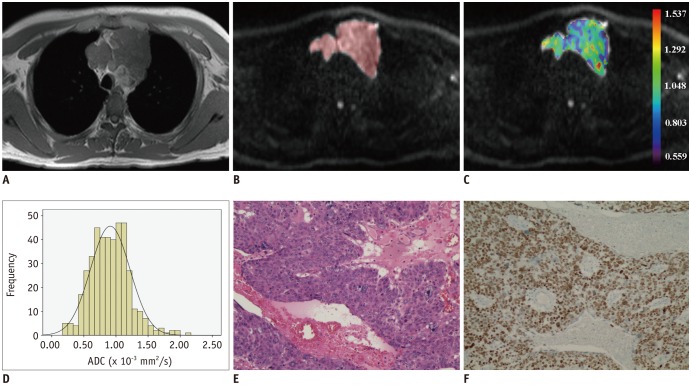 | Fig. 4Images of 42-year-old man with thymic squamous cell carcinoma.Axial T1-weighted image shows mass in anterior mediastinal region (A). After ROI was placed (B), pixel-by-pixel colored ADC map (C) was generated and embedded in axial diffusion-weighted imaging. Compared with lymphoma, histogram analysis of whole lesion showed higher cumulative ADC value but lower relative frequency (D). ADCmedian and ADC10 were 0.895 and 0.395 × 10⁻³ mm2/s, respectively. Typical histopathologic appearance on hematoxylin-eosin stain (E, × 10) and P63 positive on immunohistochemistry (F, × 10) confirmed diagnosis of squamous cell carcinoma.
|
Table 2
Comparisons of Histogram-Based and Hot-Spot-ROI-Based ADC Measurements between Two Groups
![]()
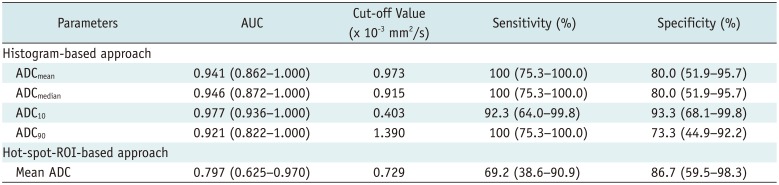
Detailed diagnostic performances of the histogram-based and hot-spot-ROI-based ADC measurements are summarized in Table 3. When using ADC10 = 0.403 × 10⁻³ mm2/s as the cut-off value, the optimal differentiating performance could be obtained (AUC, 0.977; sensitivity, 92.31%; specificity, 93.33%), followed by ADCmedian, ADCmean, ADC90, and hot-spot-ROI-based ADC (Fig. 5). The AUC of ADC10 was significantly higher than that of the hot spot ROI based mean ADC (0.977 vs. 0.797, p = 0.036).
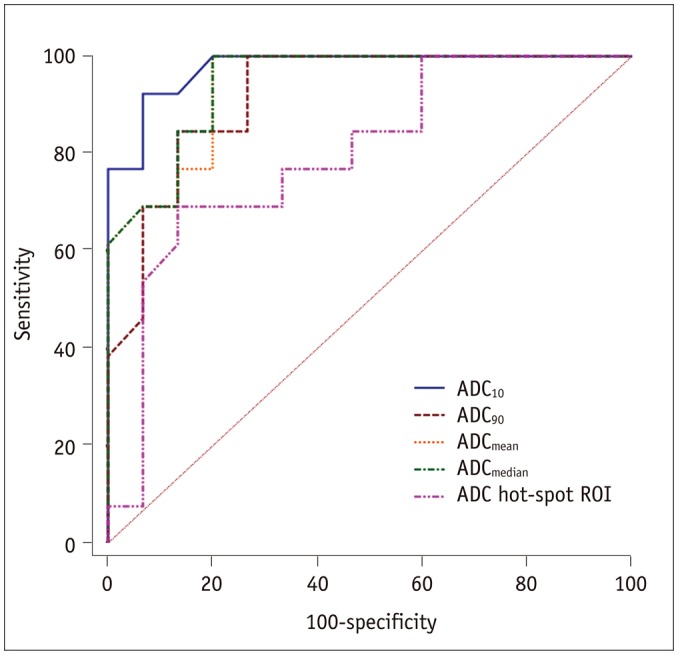 | Fig. 5Receiver operating characteristic curves of histogram-based and hot-spot-ROI-based ADC measurements for differentiating thymic carcinoma from lymphoma.
|
Table 3
Diagnostic Ability of Histogram-Based and Hot-Spot-ROI-Based ADC Measurements for Differentiating Thymic Carcinoma from Lymphoma
![]()
Since patient age differed between the two groups, we then combined ADC10 and patient age to establish a differentiating index using logistic regression. Using a combination of ADC10 and age, an AUC of 1.0, sensitivity of 100%, and specificity of 100% could be obtained, which was higher than when using ADC10 alone (AUC, 0.977) and age alone (cut-off value, 38 years; AUC, 0.905; sensitivity, 76.92%; specificity, 100%).
Good to excellent inter- and intra-reader agreements were obtained for the histogram based and hot-spot-ROI-based ADC measurements. The inter-reader and intra-reader ICCs were 0.783 and 0.808 for ADCmean, 0.781 and 0.813 for ADCmedian, 0.786 and 0.802 for ADC10, 0.775 and 0.799 for ADC90, 0.782 and 0.806 for kurtosis, 0.779 and 0.801 for skewness, and 0.745 and 0.762 for hot-spot-ROI-based ADC measurement, respectively.
Go to :
DISCUSSION
Our study had several major findings. Based on both the histogram and hot spot ROIs approaches, lymphoma showed significantly lower ADCs than thymic carcinoma. Compared with a commonly used hot-spot-ROI-based approach in a previous study, ADC10 demonstrated a significantly better differentiating performance. A histogram analysis of the ADC maps could effectively demonstrate the tumor's heterogeneity and could be a promising approach to improve the differentiating performance between thymic carcinoma and lymphoma.
Regardless of whether the hot spot ROIs or histogram approach was used, the ADC value of lymphoma was significantly lower than that of thymic carcinoma. This result might be associated with the pathological features of the tumor. Lymphoma was characterized by the enlarged nuclei and hyper-cellularity. These histological characteristics would reduce the diffusion space of water protons in the extracellular and intracellular dimensions, which would consequently decrease the ADC value (18). In contrast, thymic carcinoma usually displayed heterogeneous signal intensity on the MRI scans. The heterogeneous signal intensity might reflect the necrotic, cystic, or hemorrhagic regions within the tumor (19). Although we excluded the visually obvious necrotic, cystic, and hemorrhagic areas during the placements of the ROIs, potential tiny necrotic, cystic, or hemorrhagic areas that are pathological would increase the ADC. Therefore, it was not surprising that lymphoma demonstrated a lower ADC value than thymic carcinoma. The results of this study indicate that DWI and the derived ADC value could provide effective quantitative information for the differential diagnosis.
Several previous studies have indicated that the low percentile of ADC was superior to the mean or median ADC in differentiating or grading tumors in various organs (13172021). Donati et al. (20) found that the 10th percentile ADC correlated better with the Gleason score than the other ADC parameters did, which suggests that the 10th percentile ADC may be optimal for differentiating low- from high-grade prostate cancer. Suo et al. (21) found that, compared to the mean or median ADC, the minimum percentile ADC was more accurate for discriminating malignant from benign breast mass lesions. Similarly, our study also found that ADC10 was optimal for differentiating thymic carcinoma from lymphoma. Within a tumor with heterogeneous cellularity, the focal areas with high cellularity were represented to a greater extent by the low percentile ADCs than the mean or median ADCs (20). Therefore, it was not surprising that ADC10 demonstrated a better differentiating performance.
Due to its simplicity, a hot-spot-ROI-based ADC measurement was commonly used in clinical practice and previous clinical studies (411). However, the major disadvantage of this approach is its lower reproducibility. This drawback might result in notable bias among the various studies and limit its extensive application. In the present study, compared to the hot-spot-ROI-based mean ADC value, the ADC10 showed significantly better differentiating performance. This improvement can have a crucial impact on the formulation of individual treatment plans. However, despite the improved differentiating performance, we must admit that a histogram analysis is a time-consuming process. Further studies are needed to optimize histogram analysis and decrease the processing time.
In addition to the ADC-related parameters, our study also found that mediastinal lymphoma affected primarily young patients, while thymic carcinoma involved predominantly elderly patients. This finding is in agreement with previous studies (2223). Furthermore this study demonstrated that using a combination of ADC10 and patient age further improves differentiating performance than when using either of them alone. Finally, our results indicated that patient age may also be a very crucial reference during the differential diagnosis.
Besides the problem of processing time, our study had other limitations. First, the sample size of our study was small. Second, thymoma was the most common tumor in the anterior mediastinal region. This study would have benefitted from more thymoma cases. Third, the ROIs placements were performed manually which depended on the individual experience of the radiologist. Fourth, the image quality of the partial DWI was not adequate for further processing due to the susceptibility artifacts. Further improvement of the image quality would be beneficial for the quantification of thoracic DWI. Last, the conventional ADC used in our study, which assumes that the DWI signals would decay mono-exponentially with two b values, could have been influenced by tissue micro-perfusion (24). Intravoxel incoherent motion MR imaging with multiple b values could potentially separate the diffusion and perfusion features of tumors by using a bi-exponential model.
In conclusion, the preliminary results of this study indicated that a histogram analysis of ADC maps could be a promising approach to improve the differentiating performance between thymic carcinoma and lymphoma compared with a commonly used hot-spot-ROI-based ADC measurement. ADC10 was the optimal imaging parameter for differentiation. Future studies with a large sample size are needed to confirm our results.
Go to :
 XML Download