Abstract
Objective
To selectively visualize the left gastric vein (LGV) with hepatopetal flow information by non-contrast-enhanced magnetic resonance angiography under a hypothesis that change in the LGV flow direction can predict the development of esophageal varices; and to optimize the acquisition protocol in healthy subjects.
Materials and Methods
Respiratory-gated three-dimensional balanced steady-state free-precession scans were conducted on 31 healthy subjects using two methods (A and B) for visualizing the LGV with hepatopetal flow. In method A, two time-spatial labeling inversion pulses (Time-SLIP) were placed on the whole abdomen and the area from the gastric fornix to the upper body, excluding the LGV area. In method B, nonselective inversion recovery pulse was used and one Time-SLIP was placed on the esophagogastric junction. The detectability and consistency of LGV were evaluated using the two methods and ultrasonography (US).
Results
Left gastric veins by method A, B, and US were detected in 30 (97%), 24 (77%), and 23 (74%) subjects, respectively. LGV flow by US was hepatopetal in 22 subjects and stagnant in one subject. All hepatopetal LGVs by US coincided with the visualized vessels in both methods. One subject with non-visualized LGV in method A showed stagnant LGV by US.
The reported incidence rate of esophageal varices in patients with liver cirrhosis is 30–60%, depending on the severity of portal hypertension (12). Esophageal variceal 39hemorrhage is the second most common cause of death in patients with cirrhosis (3), with a 20–35% mortality rate (456); it develops at a 10–30% rate in patients with varices (7). Esophageal varices are mainly supplied by an enlarged left gastric vein (LGV) originating from the portal vein (PV) or splenic vein (SV), which runs to the esophagogastric junction along the lesser curvature of the stomach.
As PV pressure increases, LGV flow in the PV system transforms to a portal systemic shunt by changing the flow direction from normal (toward the liver: hepatopetal) to reversed (away from the liver: hepatofugal) before exceeding the normal LGV diameter (8), which causes gradual formation of esophageal varices. Therefore, early detection of the change in the LGV flow direction is clinically important to predict esophageal varix development. The relationship between LGV diameter and esophageal varices for ultrasonography (US) and magnetic resonance imaging (MRI) has been previously evaluated (910); however, the LGV flow direction has not been evaluated.
The time-spatial labeling inversion pulse (Time-SLIP) method of MRI is a form of spin labeling, providing quantitative and selective inflow information by placing the inversion pulse before data acquisition and background suppression (11). A Time-SLIP can be used for the selective suppression of the blood signal when placed on a vessel of no interest. More than one Time-SLIP can be placed arbitrarily, independent of the imaging area; this Time-SLIP method enables selective visualization of the vessel of interest. Therefore, it can demonstrate the change in the LGV flow direction. The method of placement of Time-SLIP for visualizing selective PV flow supplied by the superior mesenteric vein (SMV) and the inferior mesenteric vein (IMV) or SV has been reported (1213). The source of hepatofugal LGV flow resembles the source of PV flow. The improved methods could facilitate relatively easy imaging of the hepatofugal LGV flow. However, the source of hepatopetal LGV flow is obscure, and how to place Time-SLIP for the selective visualization of hepatopetal LGV is unknown.
Herein, non-contrast-enhanced MR angiography (MRA) with respiratory-triggered three-dimensional (3D) balanced steady-state free-precession (bSSFP) sequence with Time-SLIPs for imaging was used (14). We aimed to selectively visualize hepatopetal LGV by non-contrast-enhanced MRA in healthy subjects and determine the optimal visualization protocol. In addition, we compared the accuracies of the methods of non-contrast-enhanced MRA for the LGV detection using Doppler US as the gold standard.
This study was approved by the Institutional Review Board and conducted in accordance with the ethical standards of the World Medical Association (Declaration of Helsinki). Thirty-one healthy adult subjects (20 males and 11 females; average age, 34.6 years; range, 25–52 years) were included in the study. None of the subjects had viral hepatitis and none were excessive drinkers. Written informed consent was obtained from all subjects before MRI. All subjects underwent US after MRI examinations. The MRI and US examinations were performed after the subjects fasted for at least 4 hours.
All examinations were conducted with the subject in the supine position using a 3T MRI system (Vantage, Toshiba Medical Systems, Otawara, Japan), equipped with a pair of phased array coils that had 16 channel outputs, placed at the front and back of the abdomen.
First, to locate the heart, stomach, spleen, liver, SMV, PV and SV, coronal 2D single-shot fast spin echo images were acquired (repetition time [TR]/echo time [TE] = 17910 ms/80 ms, flip angle [FA] = 90, field-of-view [FOV] = 400 × 350 mm2, matrix size = 288 × 320, number of slices = 22–30, slice thickness = 4 mm, gap = 1 mm, acceleration factor = 2, acquisition time of 18 × 2 seconds during two breath-holds at the beginning of expiration) for Time-SLIP placement.
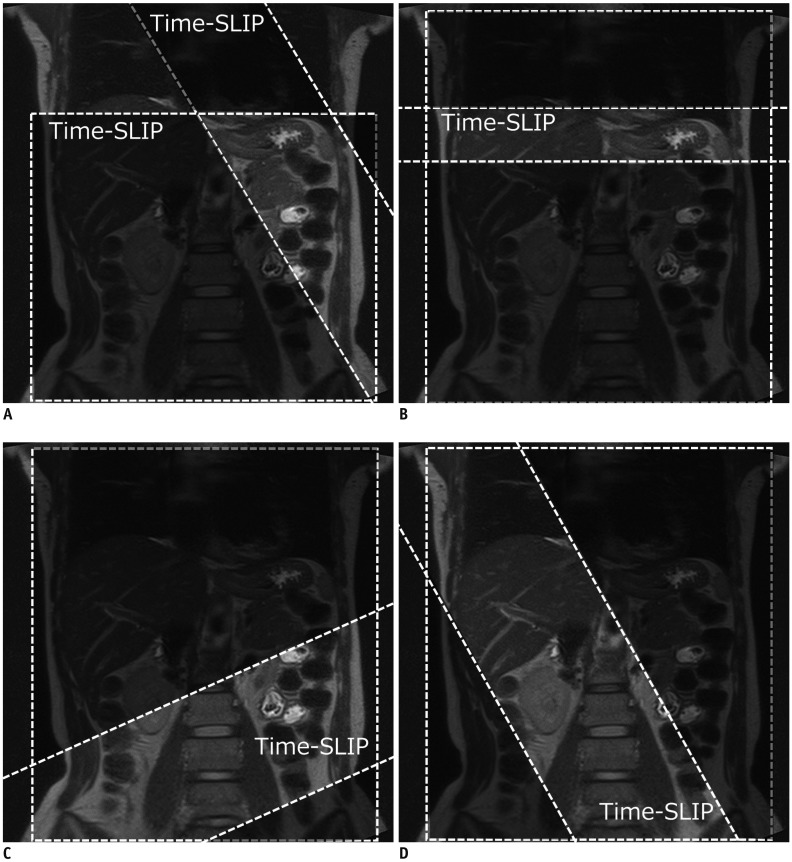
For non-contrast-enhanced MRA, 3D bSSFP with respiratory triggering was acquired in the coronal plane. Detailed tagged and untagged regions using Time-SLIP are shown in Figure 1. Respiratory triggering with an external belt sensing the respiratory cycle was conducted at the beginning of expiration using a bellows wrapped around the abdomen to reduce motion artifacts. All subjects were instructed to breathe calmly and regularly by listening to a recorded voice (“inhale … exhale”). The short tau inversion recovery method (TI = 220 ms) was used for fat suppression. A bSSFP scan was conducted with the following parameters: TR/TE/FA = 4.8 ms/2.4 ms/90° and receiver bandwidth = 781 Hz/pixel. TR and TE were the shortest, and an FA of 90° was the maximal value to clear the specific absorption rate limitation. The phase-encoding order was centric for both acquisition methods. Parameters related to spatial resolution were the same among sequences as follows: FOV = 330 × 200 mm2, matrix size = 256 × 256, slice thickness = 2 mm, number of slices = 38–50 without a gap, number of acquisitions = 1. Parallel imaging was applied in the phase direction with a factor of two, resulting in the collection of 128 phase-encoding lines per respiratory-trigger in a centric order in both acquisitions. The actual spatial resolution was 1.3 × 0.8 × 2 mm3, and final images were reconstructed into an apparent spatial resolution of 0.6 × 0.4 × 1 mm3 with zero filling.
The LGV usually runs from the esophagogastric junction to the portal-SV junction or its vicinity. Two methods for LGV visualization with hepatopetal flow were as follows (Fig. 1). In the first method A, one Time-SLIP was placed on the whole abdomen to suppress signals using TI = 1513 ms. The other Time-SLIP was placed on the spatial area from the gastric fornix to the gastric upper body to recover signals of the area, which was considered the source of the LGV. The Time-SLIP thickness was 80 mm, and TI was 1500 ms. In the second method B, nonselective inversion recovery pulse inverts all magnetization in the region using TI = 1513 ms. One Time-SLIP was placed on the center of the esophagogastric junction in the axial plane to recover signals of the area, which was considered as the LGV source. The Time-SLIP thickness was 30 mm, and TI was 1500 ms.
When the LGV flow is hepatofugal, it is supplied by the SMV and IMV flow and/or SV flow. First, in the method for visualizing the LGV with hepatofugal flow supplied by SMV and IMV (method C), nonselective inversion recovery pulse inverts all magnetization in the region using TI = 1513 ms. One Time-SLIP was placed on the lower abdomen to recover the inflow signal from the mesenteric veins to PV. The Time-SLIP thickness was 150 mm, and TI was 1500 ms. Second, it is necessary to place a Time-SLIP at the spatial area containing the spleen to visualize the LGV with hepatofugal flow supplied from SV (12). However, when the set tagged region contained the spleen, it inevitably included part of the spatial area from the gastric fornix to the gastric upper body, which is a hepatopetal LGV flow source. Therefore, we tried to visualize veins that were distributed around the gastric fornix, cardia, and esophagus derived from the LGV with hepatofugal flow by placing the tagged region on the SV and LGV away from the gastric fornix to the gastric upper body (method D). As the method for visualizing those veins, nonselective inversion recovery pulse inverts all magnetization in the region using TI = 1513 ms. One Time-SLIP was placed on the spatial area containing the lesser curvature of the stomach, excluding the gastric fornix to the gastric upper body. TI was 1500 ms.
All measurements were performed using an ultrasound system (Aplio™ XG, Toshiba Medical Systems) by the same physician to avoid interobserver errors. A convex transducer with a center frequency of 3.75 MHz (PVT-375BT, Toshiba Medical Systems) extended operating frequency range was used. The LGV generally accompanies the left gastric artery (LGA). The vessel accompanying the LGA, which was connected to the PV or SV, was considered as the LGA. Color Doppler US was performed using the color map with a standardized Doppler protocol to detect blood flow direction. The Doppler flow velocity range was set in the maximum range of 8–15 cm/s to detect the LGV flow signal because the blood flow velocity is slow (15). The LGV flow direction was measured during short time breath-holding.
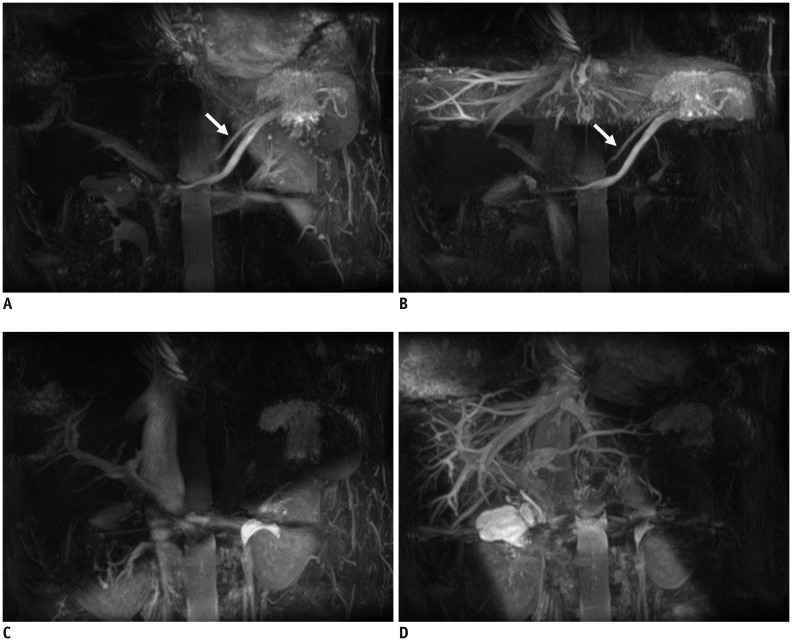
Images using maximum intensity projection (MIP) and source images were evaluated to define the LGV with hepatopetal flow (Fig. 2). We estimated whether the vessel visualized by non-contrast-enhanced MRA was the LGV using anatomical information of the bSSFP without the Time-SLIP. The “visualized LGV”, was defined as the LGV identified in the suppressed signal area on source images; and “clearly visualized LGV”, as the LGV identified in the suppressed signal area on both MIP and source images. Subsequently, we evaluated the vein with method C or method D. Method D was used for veins around the fornix and cardia. When the LGV was visualized with method A or B, and not visualized with method C or D, the visualized vessel was defined as the LGV with hepatopetal flow. Two radiologists evaluated the images, and reached a consensus. All assessments were performed using a free available DICOM viewer (YAKAMI Software, Kyoto, Japan).
To exclude a possibility that the vessel selectively visualized in method A or B was not even partly in accordance with true LGV, we estimated whether the correlation was in agreement with the running course, flow direction of the LGV between non-contrast-enhanced MRA and US, on the basis of US findings.
The image acquisition was successfully conducted in all subjects. The scan time for each method ranged from about 3 to 5 minutes. Including preparations, the total scan time was approximately 25–30 minutes.
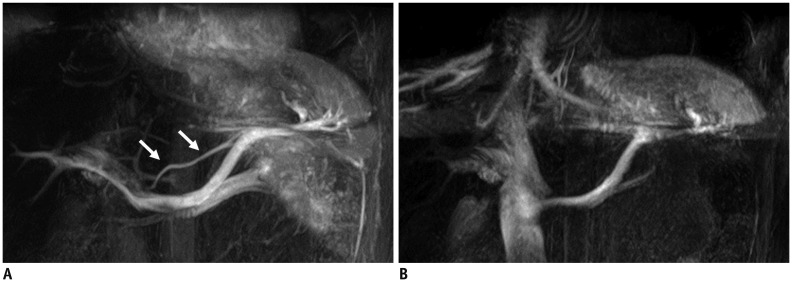
Left gastric veins on method A and B were visualized in 30 (97%) and 24 (77%) (Fig. 3), and clearly imaged in 21 (68%) and 17 (55%) of 31 subjects, respectively. For only one subject in whom the LGV was not visualized by method A, the LGV was also not visualized by method B.
There were no visualized LGVs and veins distributed around the fornix, cardia, and esophagus in methods C and D.
The LGV was detected in 23 (74%) of 31 subjects. The LGV flow direction was hepatopetal in 22 of 23 subjects. In one subject, The LGV could be detected, but the LGV flow direction could not be determined.
The LGV was visualized in all 22 subjects by method A, and the LGV with hepatopetal flow was detected by US. In all the subjects, the running course of LGV was similar in method A and US. In one subject, The LGV was not visualized by method A and US was unable to confirm the flow direction (Fig. 4).
The ability of non-contrast-enhanced MRA has been demonstrated with combined usage of a respiratory triggered 3D bSSFP sequence and Time-SLIP (1617). Using this technique, flow direction of a particular vessel could be visualized by placing the Time-SLIP appropriately. However, there have been few reports of vessel flow direction using the technique only regarding PV (1213).
Herein, two different methods were used to depict the LGV with hepatopetal flow using non-contrast-enhanced MRA. Consequently, the rate of visualization of the LGV with hepatopetal flow by method A was higher than those by method B. Visualization of the vessels differs with slight differences in the range of the tagged region (18). A bright signal flow for visualizing the LGV with hepatopetal flow by method B was not considered as sufficient, because the tagged region containing the source area of the LGV flow by method B was smaller than that by method A (18). The use of a wider tagged region on method B than the current setting could improve the visualized rate of the LGV with hepatopetal flow, because this increases bright signal flow into the LGV. Alternatively, The LGV with hepatopetal flow may not be visualized, because the wider tagged region includes the LGV. Therefore, this study could not expand the tagged region on method B. Further studies in which the tagged region is set only from the gastric fornix to the gastric upper body are required to resolve this problem.
In one subject, the LGV could not be detected by method A; and method C and D did not confirm hepatofugal flow. In that subject, the LGV was detected on US, but the LGV flow direction could not be determined using Doppler US. The results suggested that LGV did not show hepatofugal flow but stagnant flow. The subject was considered to have a healthy liver and clinically normal portal pressure. In general, it is considered that the LGV flow is hepatopetal and rarely stagnant in healthy persons with normal portal pressure. Our results suggested that the LGV flow direction can be determined by method A with C and D, even when the LGV is not visualized by method A because of stagnant or hepatofugal flow.
The LGV detection rate by US was lower than that by non-contrast-enhanced MRA using both methods (A and B), although the LGV detection rate by US in this study was almost similar to that of a previous report (15). Occasionally, the LGV may not be visualized with US because of limited acoustic windows compounded by overlying gas-filled bowels and habitus (1920). Herein, the LGV could not be visualized by US in 8 of 31 subjects due to these limitations. Advantages of non-contrast-enhanced MRA over US are largely related to its unrestricted field of view and insensitivity to these limitations. Successful the LGV detection with US depends on the operator's skill. Alternatively, MRI is not influenced by the operator's skill and patient's condition. Thus, MRI is more effective than US in determining the LGV flow direction.
This study had several limitations. First, this study included only healthy subjects and the LGV flow direction in patients with portal hypertension has not been assessed. Second, since the sample size of this study was small, the data may have been influenced by selection and verification biases. Third, because US-based identification of the LGV was not possible in some subjects, we were unable to estimate agreement in the running courses between non-contrast-enhanced MRA and US. Therefore, it is possible that the visualized vessel on non-contrast-enhanced MRA was not in agreement with true LGV in those subjects. However, the possibility of disagreement is very low, because we also evaluated the anatomical relationship between the LGV and surrounding structures using 3D bSSFP without Time-SLIP. Fourth, depicting the hepatofugal LGV flow but not the hepatopetal LGV flow in the blood flow of SV was probable, because a part of SV was inevitably visualized to partially enter the spleen within the tagged regions on method A or B. However, we believe that the SV blood flow did not mix in the LGV, because the distributed veins derived from the LGV with hepatofugal flow were not visualized by method D. Finally, we did not conduct the correction of LGV's flow velocity by US, because an angle between the Doppler beam and the LGV was so large that it was not often possible to measure correct flow velocity of the LGV (21).
In conclusion, The LGV with flow direction can be more selectively visualized by non-contrast-enhanced MRA using bSSFP sequence with Time-SLIPs compared with US. Method A was superior to method B regarding the visualization of the LGV with hepatopetal flow. It is necessary to place the tagged region on the spatial area from the gastric fornix to the gastric upper body for visualizing the LGV with hepatopetal flow (method A). Further studies are needed using non-contrast-enhanced MRA to recognize the LGV with flow direction in a larger population of chronic liver disease patients with various degrees of portal hypertension.
Acknowledgments
The authors thank Kyoko Takakura, RT (Kyoto University Graduate School of Medicine) for their excellent technical assistance and advice on sequence optimization and all volunteers who were willing to participate in our study.
References
1. Bosch J, Berzigotti A, Garcia-Pagan JC, Abraldes JG. The management of portal hypertension: rational basis, available treatments and future options. J Hepatol. 2008; 48(Suppl 1):S68–S92. PMID: 18304681.
2. Merli M, Nicolini G, Angeloni S, Rinaldi V, De Santis A, Merkel C, et al. Incidence and natural history of small esophageal varices in cirrhotic patients. J Hepatol. 2003; 38:266–272. PMID: 12586291.
3. Garcia-Tsao G, Sanyal AJ, Grace ND, Carey W. Practice Guidelines Committee of the American Association for the Study of Liver Diseases. Practice Parameters Committee of the American College of Gastroenterology. Prevention and management of gastroesophageal varices and variceal hemorrhage in cirrhosis. Hepatology. 2007; 46:922–938. PMID: 17879356.
4. Pagliaro L, D'Amico G, Sörensen TI, Lebrec D, Burroughs AK, Morabito A, et al. Prevention of first bleeding in cirrhosis. A meta-analysis of randomized trials of nonsurgical treatment. Ann Intern Med. 1992; 117:59–57. PMID: 1350716.
5. D'Amico G, Pagliaro L, Bosch J. The treatment of portal hypertension: a meta-analytic review. Hepatology. 1995; 22:332–354. PMID: 7601427.
6. Sarin SK, Lamba GS, Kumar M, Misra A, Murthy NS. Comparison of endoscopic ligation and propranolol for the primary prevention of variceal bleeding. N Engl J Med. 1999; 340:988–993. PMID: 10099140.
7. Garcia-Tsao G. Current management of the complications of cirrhosis and portal hypertension: variceal hemorrhage, ascites, and spontaneous bacterial peritonitis. Gastroenterology. 2001; 120:726–748. PMID: 11179247.
8. Matsutani S, Mizumoto H. To-and-fro waveforms in the left gastric vein in portal hypertension. J Med Ultrason (2001). 2012; 39:101–104. PMID: 27278851.
9. Zhou HY, Chen TW, Zhang XM, Zeng NL, Zhou L, Tang HJ, et al. Diameters of left gastric vein and its originating vein on magnetic resonance imaging in liver cirrhosis patients with hepatitis B: association with endoscopic grades of esophageal varices. Hepatol Res. 2014; 44:E110–E117. PMID: 24107109.
10. Li FH, Hao J, Xia JG, Li HL, Fang H. Hemodynamic analysis of esophageal varices in patients with liver cirrhosis using color Doppler ultrasound. World J Gastroenterol. 2005; 11:4560–4565. PMID: 16052688.
11. Garcia DM, Duhamel G, Alsop DC. Efficiency of inversion pulses for background suppressed arterial spin labeling. Magn Reson Med. 2005; 54:366–372. PMID: 16032674.
12. Ito K, Koike S, Jo C, Shimizu A, Kanazawa H, Miyazaki M, et al. Intraportal venous flow distribution: evaluation with single breath-hold ECG-triggered three-dimensional half-Fourier fast spin-echo MR imaging and a selective inversion-recovery tagging pulse. AJR Am J Roentgenol. 2002; 178:343–348. PMID: 11804889.
13. Tsukuda T, Ito K, Koike S, Sasaki K, Shimizu A, Fujita T, et al. Pre- and postprandial alterations of portal venous flow: evaluation with single breath-hold three-dimensional half-Fourier fast spin-echo MR imaging and a selective inversion recovery tagging pulse. J Magn Reson Imaging. 2005; 22:527–533. PMID: 16161083.
14. Park SH, Han PK, Choi SH. Physiological and functional magnetic resonance imaging using balanced steady-state free precession. Korean J Radiol. 2015; 16:550–559. PMID: 25995684.
15. Matsutani S, Furuse J, Ishii H, Mizumoto H, Kimura K, Ohto M. Hemodynamics of the left gastric vein in portal hypertension. Gastroenterology. 1993; 105:513–518. PMID: 8335205.
16. Shimada K, Isoda H, Okada T, Kamae T, Arizono S, Hirokawa Y, et al. Non-contrast-enhanced MR portography with time-spatial labeling inversion pulses: comparison of imaging with three-dimensional half-fourier fast spin-echo and true steady-state free-precession sequences. J Magn Reson Imaging. 2009; 29:1140–1146. PMID: 19388119.
17. Shimada K, Isoda H, Okada T, Kamae T, Maetani Y, Arizono S, et al. Non-contrast-enhanced MR angiography for selective visualization of the hepatic vein and inferior vena cava with true steady-state free-precession sequence and time-spatial labeling inversion pulses: preliminary results. J Magn Reson Imaging. 2009; 29:474–479. PMID: 19161205.
18. Furuta A, Isoda H, Yamashita R, Ohno T, Kawahara S, Shimizu H, et al. Non-contrast-enhanced MR portography with balanced steady-state free-precession sequence and time-spatial labeling inversion pulses: comparison of imaging with flow-in and flow-out methods. J Magn Reson Imaging. 2014; 40:583–587. PMID: 24924213.
19. Finn JP, Kane RA, Edelman RR, Jenkins RL, Lewis WD, Muller M, et al. Imaging of the portal venous system in patients with cirrhosis: MR angiography vs duplex Doppler sonography. AJR Am J Roentgenol. 1993; 161:989–994. PMID: 8273643.
20. Cakmak O, Elmas N, Tamsel S, Demirpolat G, Sever A, Altunel E, et al. Role of contrast-enhanced 3D magnetic resonance portography in evaluating portal venous system compared with color Doppler ultrasonography. Abdom Imaging. 2008; 33:65–71. PMID: 17440768.
21. Gill RW. Measurement of blood flow by ultrasound: accuracy and sources of error. Ultrasound Med Biol. 1985; 11:625–641. PMID: 2931884.