

 PDF
PDF ePub
ePub Citation
 Print
Print


INTRODUCTION
Chronic total occlusion (CTO) are frequently encountered in patients with obstructive coronary artery disease referred for invasive coronary angiography (ICA) (1). Despite the technical difficulties in recanalizing the lesions, current data suggest that successful percutaneous coronary intervention (PCI) for CTO is associated with improvement in patient symptoms, quality of life, left ventricular function, and survival, compared with those with unsuccessful CTO PCI (23456).
Histological correlation of CTOs has shown the influence of the duration on the presence of calcification, inflammation, and neovascularization (78). Meanwhile, multiple studies have demonstrated a high diagnostic accuracy of coronary computed tomography angiography (CCTA) for the detection of CTOs when compared with ICA and established this modality as a useful alternative to invasive angiography in certain indications (91011121314). Our previous cross-sectional study has also confirmed the different morphological features of CTOs in early and late stage as observed by CCTA (15). However, the natural history and serial follow-up of untreated CTOs as observed by a non-invasive imaging modality has not been explored yet. Therefore, this study aimed to investigate the morphological changes of CTOs as determined by serial CCTA follow-up using semi-automated quantitative analysis.
MATERIALS AND METHODS
Patient Population
Institutional Review Board approval was obtained for this retrospective study, and the informed consent was waived. Between April 2011 and December 2014, consecutive patients with ICA-confirmed CTO lesions, were retrospectively included in this study. The inclusion criteria were 1) patients with ICA-confirmed CTO lesions, 2) Target CTO lesions were not revascularized or did not have PCI attempt, and 3) patients underwent serial CCTA follow-up within one month prior to initial ICA and at least half a year after the initial ICA. Exclusion criteria were 1) history of acute myocardial infarction (AMI) within 3 months prior to the baseline CCTA, 2) the target CTO lesions were successfully revascularized or had failed PCI attempt, 3) Serial CCTA follow-up was not performed, or 4) CCTA was uninterpretable due to poor image quality.
Scan Protocol of CCTA
A 128-slice multidetector CT (Definition AS, Siemens Medical Solutions, Forchheim, Germany) was employed for scanning. β-blocker (25–75 mg) was administrated orally 1 hour prior to the examination in patients with heart rate > 65 beats/minutes. Nitroglycerin was given sublingually in all patients. A bolus of contrast media (iopamidol, Isovist; 370 mg iodine/mL, Bayer Healthcare, Berlin, German) was injected into antecubital vein at the rate of 4.5–5 mL/s, followed by a 20–40 mL saline flush by using a dual-barrel power injector (Tyco, Cincinnati, OH, USA). The amount of the contrast media was determined according to the patient's body weight and scan time. A test bolus was firstly injected and the region of interest (ROI) was placed within ascending aorta to determine a proper delay time, which was defined as 4s plus the peak time of ascending aorta. Retrospective electrocardiography (ECG)-gated CTA was performed in patients with final heart rate ≥ 70 bpm, with following technical factors: collimation, 64 × 0.6 mm; reconstructed slice thickness, 0.6 mm; reconstructed slice interval, 0.5 mm; rotation time, 300 ms. The pitch and current were ECG modified and the effective current was set as 200 mA (ECG-dependent dose modulation technique was applied, full dose during the R-R interval of 40–70%), and tube voltage was 120 kVp. Prospective ECG-triggered CTA was performed in patients with final heart rate < 70 bpm, with the center of the triggering window set at 70% of the R-R interval. The rest of the parameters of prospective acquisition were as the same as in retrospective acquisition.
CCTA Image Reconstruction and Analysis
Data was transferred to an offline workstation (Syngo, Siemens, Forchheim, Germany) for further analysis. Axial images, cross-sectional view, curved planar reformation (CPR), multiplanar reformation, three-dimensional (3D) volume rendering as well as 3D maximum intensity projection images were available for evaluation.
Various morphological parameters were recorded according to CCTA findings as mentioned as follows. The total occlusion length was measured on CPR at best projection view, from the proximal end of complete contrast filling defect to the distal end. The regional coronary calcification of the CTO lesions was analyzed by using Agatston calcium score to calculate the calcium volume. Recanalized lumen was defined as the linear-like enhanced opacity traversing the non-opacified occluded segment, which was scattered and did not connect to the proximal or distal end of the lesion (9). The calcium score images were correlated to CCTA images slice by slice to differentiate the presence of internal calcified plaques from recanalized lumen. The occlusion volume was also measured by manually drawing the contour of the lesions using a dedicated plaque analysis software (Coronary Plaque Analysis, version 2.0, Siemens). The software automatically detected the lesions and all ROIs were manually adjusted if necessary. The total occlusion volume, volume with low attenuation component (< 30 Hounsfield unit [HU]), volume with middle to high attenuation component (30–190 HU) as well as the calcification volume were therefore recorded. Complete spontaneous recanalization was defined as continuous linear contrast filling connecting the proximal and distal end of CTOs. To avoid the impact of measurement variability, CTOs with shorter occlusion length was defined as the measured follow-up occlusion length was shortened more than 10% compared to the baseline length.
Two experienced radiologists, who were blinded to clinical histories and prior ICA results (if any), independently analyzed the lesions. The mean values of measured parameters between two observers were used for further analysis.
ICA Procedure
The ICA was performed with standard techniques, and at least 2 different views were obtained for each main vessel. 2 skilled observers, who were blinded to the results of CCTA, evaluated all segments. CTO of the coronary arteries is defined as the obstruction of the native coronary artery with no luminal continuity and interruption of antegrade blood flow as assessed by ICA with thrombolysis in myocardial infarction grade ≤ 1, and occlusion period of more than 3 month estimated from the clinical events or proven by previous angiography (1). ICA findings served as the reference standard for diagnosis of CTO when patients were retrospectively included.
Statistical Analysis
Statistical analysis was performed using commercial available statistical software (SPSS ver. 13.0, SPSS Inc., Chicago, IL, USA; MedCalc Statistical Software version 15.2.2, MedCalc Software bvba, Ostend, Belgium). One-sample Kolmogorov-Smirnov test was used to check the assumption of normal distribution. Quantitative variables with normal distribution were expressed as mean ± standard deviation while median and quartiles were used otherwise. Paired t test and Pearson test was used for normally distributed data while Mann-Whitney U-test was used for data that were not normally distributed. Chi-square test was used to make comparison of proportions. Bland-Altman analysis was performed test the inter-rater agreement. A 2-tailed p < 0.05 was considered statistically significant.
RESULTS
Clinical Characteristics
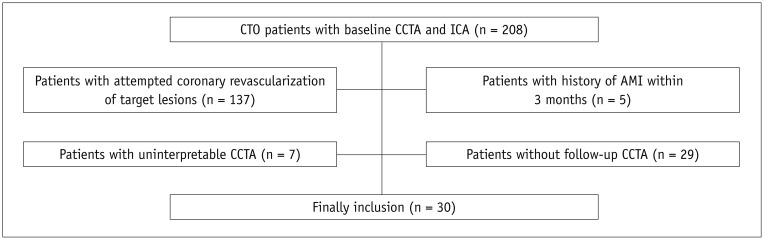
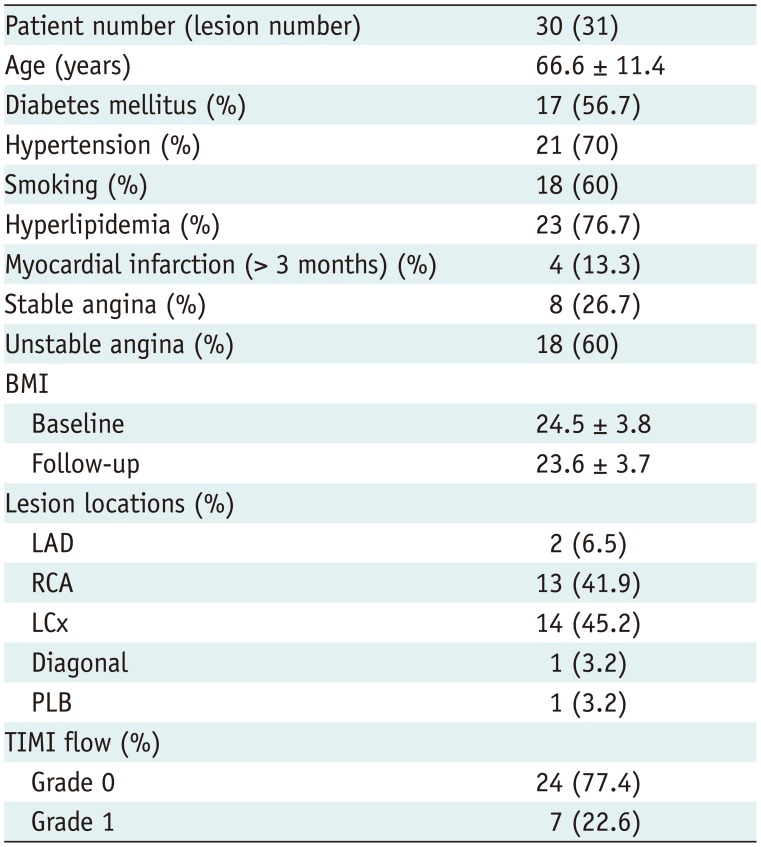
Two hundred and eight patients with baseline CCTA were initially included according to the presence of ICA-confirmed CTO lesions. One hundred and thirty-seven patients with previous history of attempted coronary revascularization of target lesions and 5 patients with history of AMI within 3 months were subsequently excluded. Seven patients were excluded due to partially uninterpretable CCTA examinations and 29 patients without follow-up CCTA were further excluded. Therefore, 30 patients (mean age, 66.6 ± 11.4 years; age range, 35–88 years; 28 males and 2 females) were finally included in our study (Fig. 1). The dose length product of CTCA was 389.3 ± 119.4 mGy*cm (range 254–603 mGy*cm). The mean contrast used for CCTA was 82.3 ± 7.5 mL (range 70–90 mL). The mean interval between baseline and follow-up CCTA was 18.6 ± 11.7 months (range 10–54 months). Detailed demographic data was given in Table 1.
CCTA Findings of ICA-Confirmed CTOs
Invasive coronary angiography revealed 31 CTO lesions in 30 patients. Compared to ICA, baseline CCTA managed to detect all lesions according to the presence of complete filling defect at CT. Left circumflex (LCx) (45.2%, 14/31) was the predominant location of CTOs, followed by right coronary artery (RCA) (41.9%, 13/31), left anterior descending (6.5%, 2/31), diagonal branch (3.2%, 1/31) and posterior lateral branch (3.2%, 1/31) (Table 1).
CTO Imaging Features of Baseline and Follow-Up CCTA
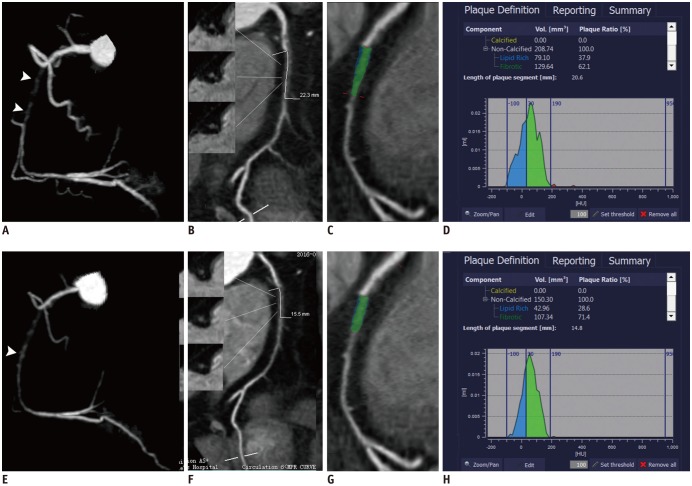
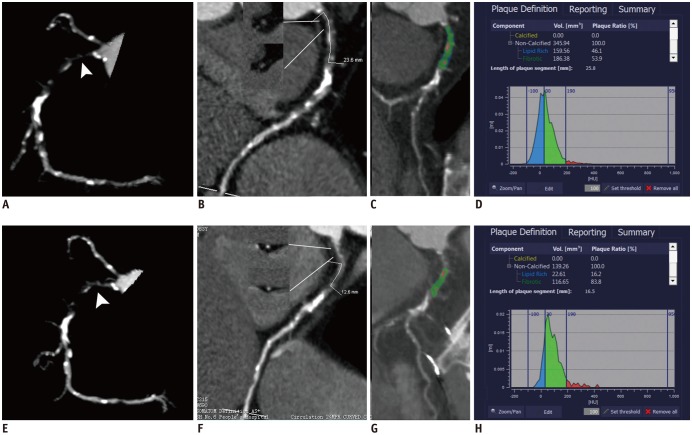
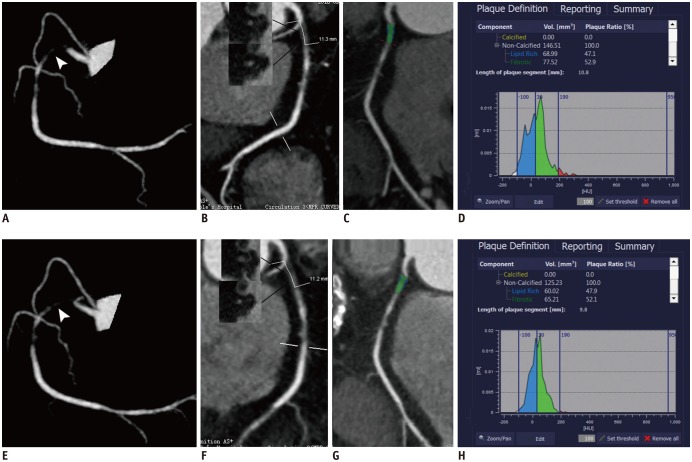
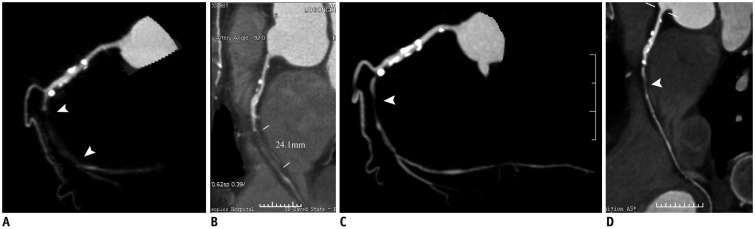
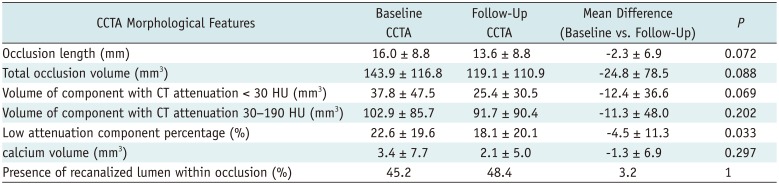
A series of morphological parameters were measured and recorded according to CCTA findings. The Bland-Altman analysis showed a mean difference of occlusion length measured by two raters of −1.5 mm (95% confidence interval: −5.6–2.5 mm). The correlation coefficient for the measurement of occlusion length between two raters was good (r = 0.977, p < 0.001). Recanalized lumen was found within 48.4% (15/31) occlusions on the follow-up CCTA, compared to 45.2% (14/31) occlusions on the baseline CCTA (Figs. 2,3,4). Complete spontaneous recanalization of occlusions was observed in one lesion of RCA (Fig. 5) and one lesion of diagonal branch. The percentage of low attenuation component of occlusions was smaller on follow-up CCTA compared to baseline value (18.1 ± 20.1% vs. 22.6 ± 19.6%, p = 0.033). There were 21 lesions (67.7%, 21/31) that showed higher attenuation of non-calcified components of later stage compared to their earlier stage. Other parameters, such as occlusion length, total occlusion volume, volume of components with different CT density and calcium volume, were not found to be significantly different between baseline and follow-up CCTA groups (Table 2).
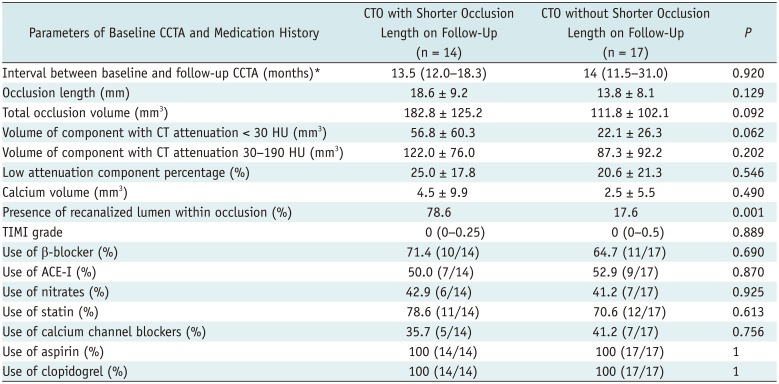
Eleven of 14 lesions (78.6%) with CT-visible recanalized lumen within CTOs had a shorter occlusion length on follow-up compared to only 3 of 17 lesions (17.6%) without CT-visible recanalized lumen (odds ratio, 17.1; p < 0.001). Other parameters, such as follow-up interval, occlusion length, total occlusion volume, volume of components with different CT density and calcium volume, were similarly presented between CTOs with and without shorter occlusion length on follow-up (Table 3).
DISCUSSION
This current study demonstrated several important imaging features that might enhance the understanding of natural history of untreated CTOs. First, CT-visible recanalized lumen was not an uncommon finding and could lead to decreased occlusion length or complete recanalization of occlusions. Second, the high density components within the occluded segments increased in the lesions of later stage.
The clinical importance of CTO imaging lies in guiding the proper treatment strategies for revascularization. Traditional risk factors relating to PCI failure include diffuse long lesion, severe calcification, torturous course and late stage of lesions (1617). The early stage of CTOs is known for ‘loose fibrous tissue’ in the occluded segment, which is a histological feature that amenable to PCI due to the ease of the wire to penetrate the lesion (16). In contrast to the early stage of CTOs, the late stage of the occlusions (duration > 1 year) is highlighted for the microvessel formation (also known as “recanalization”) that occurs as part of the organization phase in CTO in which thrombus is replaced by fibrous tissue. These microvessels generally range in size from 100 to 200 µm but can be as large as 500 µm (7). According to the current study, spontaneous recanalization was found in 48.4% occlusions on the follow-up CCTA, compared to 45.2% occlusions on the baseline CCTA. This finding is in line with the previous histology study that those intravascular microvessel formation is not an uncommon finding in rabbit CTO model (18). Further, our findings also suggested that the presence of CT-visible recanalized lumen within occlusions on baseline CCTA was associated with shortening of lesion length on follow-up. For clinical aspect, it might help to select proper candidates for CCTA dynamic follow-up with higher likelihood of shortening of occlusion length. In addition, the procedural difficulty is significantly lowered in case of the presence of complete spontaneous recanalization as observed by CCTA. Therefore, CCTA might play an important role in CTO revascularization to dynamically monitor the development of such spontaneous recanalization and subsequently identify the lesions with potentially high successful rate of PCI.
In addition to the above parameters, the density of non-calcified CTO component was measured higher on follow-up CCTA than it was measured on the baseline CCTA, as revealed by the current study. Although the underlying histological correlation remains unknown, the pathological features of CTO might contribute to this phenomenon. According to a porcine CTO model study, the occluded segment predominantly consists of collagen and elastin-rich matrix with very little proteoglycan in the late stage of CTO, whereas it was characterized by a proteoglycan-rich matrix with highly cellular content in the early stage of CTO (7). As similarly revealed by another human pathological study of CTO, a significant increase in the frequency of predominantly fibrocalcific intimal plaque lesions was evident with increasing CTO age, whereas cholesterol-laden or mixed intimal plaque lesions predominated as CTO age decreased (18). Our previous cross-sectional study has also revealed that the density of non-calcified CTO component was higher for late stage lesions than that of early stage lesions (15). In the current study, we were able to further confirm the dynamic change of CTO component density over long-term follow-up. According to the present findings, the component density within the occluded segments increased over follow-up period. Therefore, we hypothesized that the density change of non-calcified CTO components might be attributed to the pathological characteristic. In other words, the increased component density on follow-up CCTA might represent the histopathological change from proteoglycan-rich matrix to elastin-rich matrix. However, it needs further histology study for validation.
The major limitation of this study is the lack of pathological correlation, which is obtainable only by autopsy. In addition, the retrospective design might result in a significant inclusion bias. RCA is the most frequent location of CTOs according to previous study (19). However, RCA lesions were more likely to be revascularized in most patients with right dominant coronary arteries and therefore excluded from the current study. In contrast, LCx lesions were less likely to be revascularized which made it as the most frequent location in this current study. This could lead to heterogeneous distribution of lesion locations that is different to the real world situation. Finally, the threshold used for occlusion quantification was the default value set by the plaque analysis software. It differs from the previously reported thresholds, which ranged from 126 HU to 323 HU (2021). However, we found the current value perform best for discriminating occlusion components and opacified lumen. Thus, the current results need further validation when different thresholds are used.
In conclusion, CCTA enables non-invasive characterization of natural progression of untreated CTO lesions. Recanalized lumen within CTOs observed at baseline CCTA was associated with shortening of occlusion length on follow-up. Compared to their earlier stage, occlusions of later stage were presented with higher density of non-calcified components.
 XML Download