

 PDF
PDF ePub
ePub Citation
 Print
Print


INTRODUCTION
Single breath-hold retrospectively electrocardiography (ECG)-gated spiral scanning is useful for evaluating not only the coronary arteries, but also the thoracic cardiovascular structures with excellent image quality in both congenital and acquired heart diseases (12). However, the main drawback of this imaging technology is the high radiation dose that is particularly problematic in a longer scan range of cardiothoracic computed tomography (CT) in young patients. As a result, various radiation dose reduction techniques including low tube voltage, ECG-controlled tube current modulation, prospectively ECG-triggered sequential scanning, prospectively ECG-triggered high-pitch dual-source spiral scanning, and iterative reconstruction algorithm, have been developed (12345). In cardiothoracic CT, prospectively ECG-triggered sequential scanning considerably prolongs scan time to enable a long scan range with sequential scanning, which makes its clinical application difficult in patients who cannot hold their breath for a long time. In prospectively ECG-triggered high-pitch dual-source spiral scanning, the image quality tends to be degraded at high heart rates (e.g., > 65 beats per minute) and the cardiac phases are different in different slice positions precluding ventricular function assessment. Ventricular function assessment using cardiac CT data has been reported to be accurate and its utility is recently increasing (6789).
In a multicenter, multivendor study on radiation dose of pediatric cardiac CT, retrospectively ECG-gated spiral scan was frequently used for the anatomic and functional evaluation of congenital heart disease in pediatric patients, up to 51.3% in the 40.0–59.9 kg body weight group (10). Because effective dose of retrospectively ECG-gated spiral cardiothoracic CT using low tube voltage and ECG-controlled tube current modulation often exceeds 10 mSv, an additional radiation dose reduction strategy is necessary to improve its benefit-risk ratio.
The dual-source chest pain protocol using retrospectively ECG-gated spiral scanning was developed for a simultaneous evaluation of pulmonary embolism, coronary artery stenosis, and aortic disease, and showed a high sensitivity of 98% in detecting the cause of chest pain (11). In this respect, the protocol showing all the thoracic cardiovascular structures in a single scanning appears suitable for cardiothoracic CT, which is commonly indicated in patients with congenital heart diseases and some patients with acquired heart diseases. Compared with radiation dose of dual-source chest pain protocol using 120 kVp, approximately 47% dose reduction could be achieved by using 100 kVp (12). Tube current is described to be saturated when necessary X-ray output is beyond its maximum limit. Tube current saturation reduces CT radiation dose efficiency and may occur more often at low tube voltage than high tube voltage. The comparison of radiation dose between conventional and chest pain dual-source retrospectively ECG-gated spiral scans, to the best of my knowledge, has not been reported. Therefore, the purpose of this study was to compare radiation doses between these cardiothoracic CT protocols in children and adults and assess the effect of tube current saturation on radiation dose reduction.
Go to : 
MATERIALS AND METHODS
Study Population
This retrospective study, approved by a local Institutional Review Board, included CT examinations that were all clinically indicated. Between January 2013 and December 2014, 104 consecutive patients (mean age 16.6 ± 7.7 years, age range 5–48 years; M:F = 62:42) who were scheduled for breath-hold retrospectively ECG-gated cardiothoracic CT (SOMATOM Definition Flash; Siemens Healthcare, Forchheim, Germany) was included in this study. Fifty-seven of 104 patients were children younger than 15 years of age. Uncooperative or sedated patients (n = 1057) were excluded from this study. Patients with renal failure or a previous history of severe allergic reaction to intravenously administered iodinated contrast agent also were excluded from this study. In our institution, the longitudinal coverage of cardiothoracic CT ranges from the thoracic inlet to the first lumbar spine, which is considerably longer than coronary CT angiography which usually ranges from the carina to the cardiac apex. The majority of underlying diseases in this study's population were various congenital heart diseases (94.2%, 98/104) (Table 1). Three patients had a permanent cardiac pacemaker.
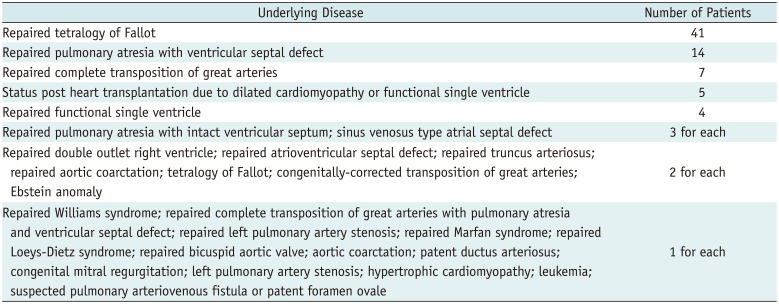
Table 1
Underlying Diseases of Study Population (n = 104)
![]()
Cardiothoracic CT Imaging
In the same patients, the following three dual-source retrospectively ECG-gated spiral cardiothoracic CT protocols were planned: 1) conventional retrospectively ECG-gated spiral protocol, 2) uniphasic chest pain protocol, and 3) biphasic chest pain protocol. In uniphasic chest pain protocol, only one tube was switched on to generate the planned tube current time product per rotation. In biphasic chest pain protocol, the two tubes of the dual-source CT scanner were switched on to produce the planned tube current time product per rotation in the user-defined cardiac scan range generally from the carina to the cardiac apex. Only one tube was switched on in the remaining upper and lower parts of the scan range outside the cardiac scan range with a half radiation dose. Other scanning parameters of the three CT protocols were kept the same in the same patients as follows: a gantry rotation time of 0.28 seconds (temporal resolution of 75 ms), 2 × 64 × 0.6 mm detector collimation with a z-flying focal spot, longitudinal scan range, tube voltage, tube current time product per rotation before the application of tube current modulation (CARE Dose 4D; Siemens Healthcare), pitch (0.35), a full-dose period (250–350 ms) of ECG-controlled tube current modulation (MinDose; Siemens Healthcare), field of view, and caudocranial scan direction. Selection of the tube voltage was empirically based on patient body size: 70 kVp in two, 80 kVp in 21, 100 kV in 76, and 120 kVp in five patients. Selection of the tube current time product per rotation (307.0 ± 25.9) also was empirically based on patient body size. Volume CT dose index values, that were derived from the 32 cm-sized CT dose index phantom displayed on the CT console, were recorded to reflect the radiation dose of the three CT protocols. This approach was used because the longitudinal scan ranges of the three were the same and the volume CT dose index values could be used for radiation dose instead of dose-length product values. Estimated volume CT dose index values derived from the 32 cm-sized CT dose index phantom also were individually calculated from the cross sectional body area and mean body density as measured by an axial CT image obtained approximately 1–2 cm above the dome of the liver for bolus tracking. The method was developed to determine an optimal radiation dose level for non-ECG-synchronized cardiothoracic CT (13).
Actual patient CT scanning was performed with the biphasic chest pain protocol after further adjustment of tube voltage and tube current time product per rotation. This step allowed us to avoid tube current saturation in order to maximize radiation dose efficiency with heart-rate-adapted pitch and ECG-controlled tube current modulation changed for each patient and each diagnostic purpose. A beta-blocker was not used to control heart rate prior to retrospectively ECG-gated spiral cardiothoracic CT scanning in all the patients. For CT image reconstruction, the sonogram-affirmed iterative reconstruction (SAFIRE; Siemens Healthcare) with strength 5 was used. An iodinated contrast agent (Iomeron 400, iomeprol 400 mg I/mL; Bracco Imaging SpA, Milan, Italy; < 1.5–2.0 mL/kg) was intravenously administered at an injection rate of 1.5–3.0 mL/s by using a dual-head power injector. A tri-phasic injection protocol, whereby an undiluted contrast agent was followed by a 50% diluted contrast agent and then by a 5% diluted contrast agent, was to achieve uniform cardiovascular enhancement and minimal peri-venous streak artifacts from an undiluted contrast agent.
Tube Current Saturation
Using a tube current modulation curve calculated over the entire scanning range, the presence of tube current saturation in the CT protocol was evaluated. When tube current remained within the upper limit of the X-ray tube, the entire curve appeared in green (Fig. 1). In contrast, a portion of the curve exceeding the upper limit appeared in yellow and indicated the presence of tube current saturation (Fig. 2). Tube current saturation occurred in 48 patients (46.2%, 48/104) in the conventional protocol, 71 patients (68.3%, 71/104) in the uniphasic chest pain protocol, and 25 patients (24.0%, 25/104) in the biphasic chest pain protocol.
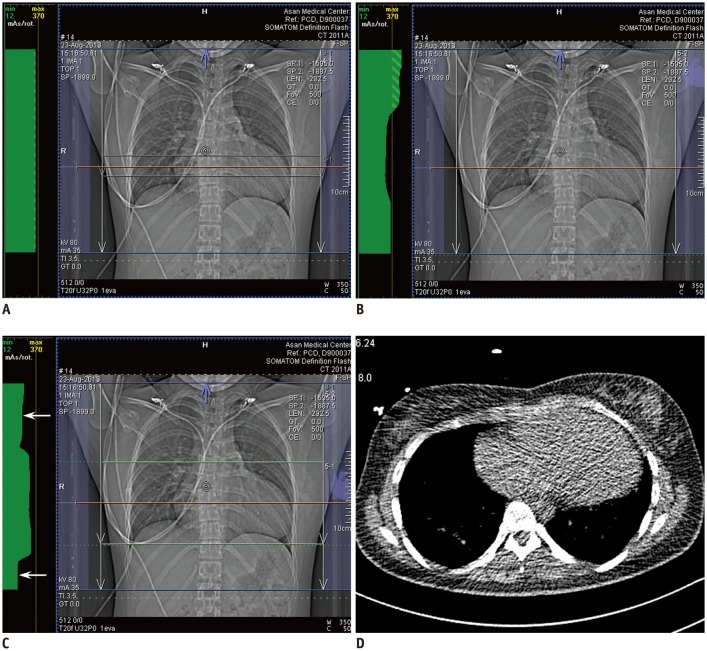 | Fig. 1Retrospectively ECG-gated spiral cardiothoracic CT using dual-source technique in 23-year-old woman with repaired tetralogy of Fallot.
A. Anteroposterior scout image of conventional CT protocol shows tube current modulation curve in green throughout whole longitudinal scan range indicating no tube current saturation. In other words, tube current time product per rotation remains below maximum value of 370 over entire scanning range. Of note, tube current modulation curve is flat on top indicating no change in tube current time product per rotation over whole scan range in this protocol. B. Anteroposterior scout image of uniphasic chest pain CT protocol demonstrates tube current modulation curve in green over whole longitudinal scan range. In contrast to conventional CT protocol (A), tube current time product per rotation is modulated in this protocol according to patient-specific attenuation information acquired from scout image. C. Anteroposterior scout image of biphasic chest pain CT protocol also displays tube current modulation curve in green over whole longitudinal scan range. In this protocol, cardiac region is defined by user as green dotted lines and radiation dose is subsequently reduced to half (arrows) in upper and lower parts of scan range outside cardiac region because one of two X-ray tubes in dual-source CT system is switched off in these regions. D. From axial CT image acquired at slice position (orange line in A–C) approximately 2.5 cm above liver dome for bolus tracking, cross sectional area and mean body density was measured as 597 mm2 and −147 Hounsfield unit, respectively, and optimal volume CT dose index for non-ECG-synchronized cardiothoracic CT was calculated as 3.8 mGy (for one slice) that was increased to 4.8 mGy (for whole scan range) after application of automatic tube current modulation. Axial CT image looks noisy because low radiation dose setting (80 kVp and 25 mA) was used to minimize patient radiation exposure. CT = computed tomography, ECG = electrocardiography
|
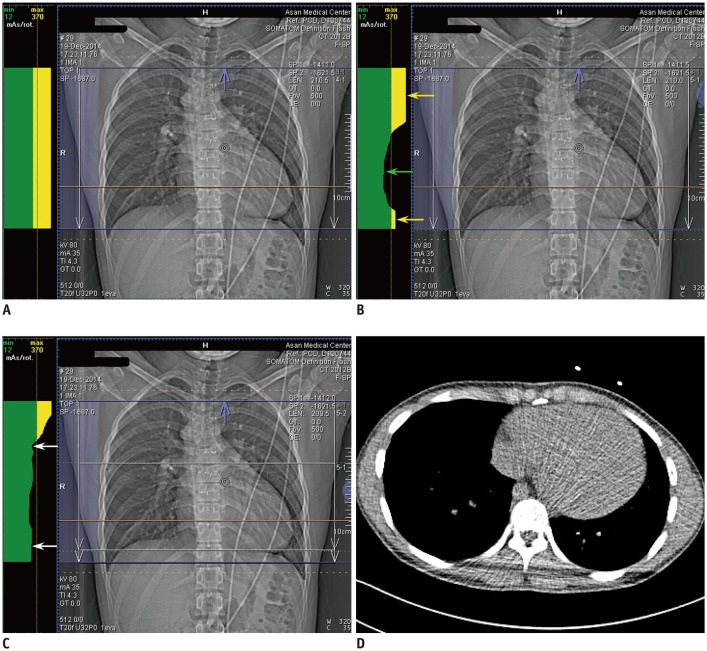 | Fig. 2Retrospectively ECG-gated spiral cardiothoracic CT using dual-source technique in 19-year-old man with repaired double-outlet right ventricle and subaortic ventricular septal defect.
A. Anteroposterior scout image of conventional CT protocol shows upper part of tube current modulation curve in yellow throughout whole longitudinal scan range indicating tube current saturation. It means that tube current time product per rotation exceeds maximum value of 370 over entire scanning range. Of note, tube current modulation curve is flat on top indicating no change in tube current time product per rotation over whole scan range in this protocol. B. Anteroposterior scout image of uniphasic chest pain CT protocol demonstrates upper part of tube current modulation curve in yellow in upper thorax (yellow arrow) and lower thorax (yellow arrow) exceeding maximum tube current time product per rotation of 370. In contrast, tube current time product per rotation is modulated below maximum value of 370 in cardiac region (green arrow). C. Anteroposterior scout image of biphasic chest pain CT protocol shows that tube current time product per rotation is reduced (arrows) in upper and lower parts of scan range outside cardiac region defined by user as green dotted lines. Nonetheless, yellow tube current saturation is still shown in upper thorax. D. From axial CT image acquired at slice position (orange line in A–C) approximately 2.0 cm above liver dome for bolus tracking, cross sectional area and mean body density was measured as 522 mm2 and −240 Hounsfield unit, respectively, and optimal volume CT dose index for non-ECG-synchronized cardiothoracic CT was calculated as 2.8 mGy (for one slice) that was increased to 5.1 mGy (for whole scan range) after application of automatic tube current modulation. Axial CT image looks noisy because low radiation dose setting (80 kVp and 25 mA) was used to minimize patient radiation exposure.
|
Statistical Analysis
For statistical analysis, statistical software (SPSS version 23.0; IBM Corp., Armonk, NY, USA) was used. Variables are expressed as a mean with standard deviation. Dose reduction percentages, patient ages, volume CT dose index values, and tube current time products per rotation were compared between two groups with and without tube current saturation in the same protocols by using an unpaired t test. In 76 patients using 100 kVp, patient age, volume CT dose index value based on cross sectional area and mean body density, tube current time product per rotation of conventional protocol were compared between groups with and without tube current saturation. In the other tube voltages, the numbers of patients were regarded insufficient to ensure good statistical power. A p value < 0.05 was considered statistically significant.
Go to :
RESULTS
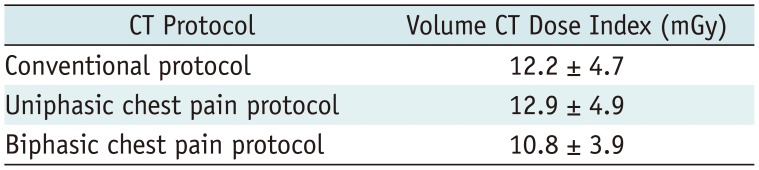
Volume CT dose index values of the three retrospectively ECG-gated spiral cardiothoracic CT protocols are described in Table 2. The volume CT dose index values of the biphasic chest pain protocol (10.8 ± 3.9 mGy) were significantly lower than those of the conventional protocol (12.2 ± 4.7 mGy, p < 0.001) and those of the uniphasic chest pain protocol (12.9 ± 4.9 mGy, p < 0.001). The difference in the volume CT dose index values between the conventional and the biphasic chest pain protocols was 1.4 ± 2.0 mGy which accounts for 10.0 ± 12.0% of the volume CT dose index values of the conventional protocol. The difference in the volume CT dose index values between the uniphasic and the biphasic chest pain protocols was 2.1 ± 2.2 mGy which accounts for 15.1 ± 10.7% of the volume CT dose index values of the uniphasic chest pain protocol.
The volume CT dose index values determined by the cross sectional area and mean body density were 1.3 ± 0.3 mGy in two patients using 70 kVp; 2.2 ± 0.6 mGy in 21 patients using 80 kVp; 4.2 ± 1.0 mGy in 76 patients using 100 kVp; and 8.8 ± 1.8 mGy in five patients using 120 kVp.
The differences in the volume CT dose index values between the biphasic chest pain and other protocols are described in the two groups with and without tube current saturation in the same CT protocols in Table 3. Compared with the group with tube current saturation in the conventional protocol, the group without tube current saturation in the same protocol showed significantly greater dose reduction percentages between the conventional and the biphasic chest pain protocols (14.8 ± 11.5% vs. 4.5 ± 10.2%, p < 0.001) as well as between the uniphasic and the biphasic chest pain protocols (19.3 ± 8.8% vs. 10.1 ± 10.5%, p < 0.001) (Table 3). In the uniphasic chest pain protocol, the dose reduction percentages between the conventional and the biphasic chest pain protocol in the group without tube current saturation showed no significant difference (13.1 ± 9.8% vs. 8.6 ± 12.7%, p = 0.074) compared with those in the group with tube current saturation, but the values between the uniphasic and the biphasic chest pain were significantly greater in the group without tube current saturation than in the group with tube current saturation protocols (19.1 ± 7.4% vs. 13.2 ± 11.5%, p = 0.008) (Table 3). Compared with the group with tube current saturation in the biphasic chest pain protocol, the group without tube current saturation in the same protocol showed significantly greater dose reduction percentages between the conventional and the biphasic chest pain protocols (12.0 ± 11.9% vs. 3.8 ± 10.3%, p = 0.002) as well as between the uniphasic and the biphasic chest pain protocols (17.2 ± 10.2% vs. 8.3 ± 9.5%, p < 0.001) (Table 3).
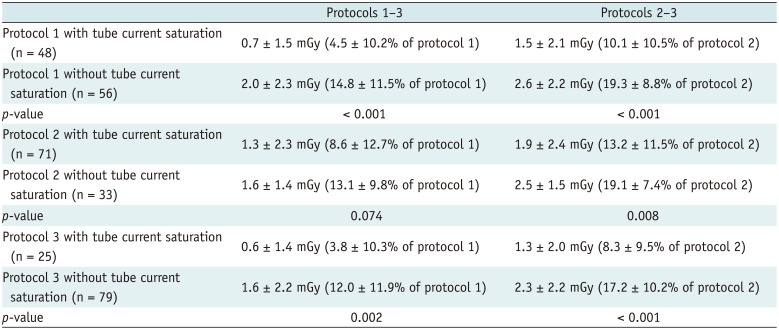
Table 3
Differences in Volume CT Dose Index Values between Biphasic Chest Pain and Other CT Protocols in Groups with and without Tube Current Saturation
![]()
In 76 patients using 100 kVp, patient age showed no significant differences between the groups with and without tube current saturation in all the three protocols (p > 0.05); the groups with tube current saturation showed significantly higher volume CT dose index values based on the cross sectional area and mean body density than the groups without tube current saturation in all the three protocols (the conventional protocol, p < 0.001; the uniphasic chest pain protocol, p = 0.007; the biphasic chest pain protocol, p < 0.001). The groups with tube current saturation also showed significantly higher tube current time product per rotation of the conventional protocol than the groups without tube current saturation in all the three protocols (p < 0.001) (Table 4).
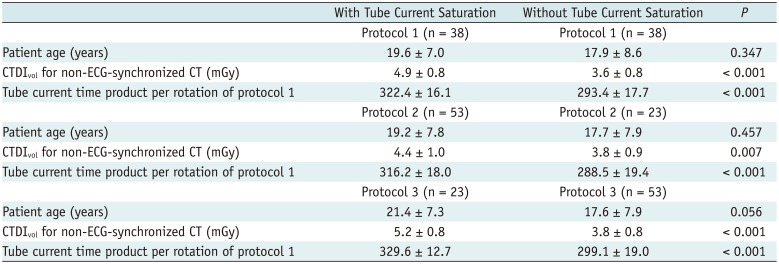
Table 4
Comparisons of Patient Age, Volume CT Dose Index Value based on Cross Sectional Area and Mean Body Density, Tube Current Time Product per Rotation of Conventional Protocol between Groups with and without Tube Current Saturation in 76 Patients Using 100 kVp
![]()
Go to :
DISCUSSION
In this study, overall radiation dose reduction achieved by the biphasic chest pain protocol was 10.0% in dual-source retrospectively ECG-gated spiral cardiothoracic CT in children and adults, compared with the radiation dose of the conventional protocol. Of importance, tube current saturation in the conventional protocol decreased radiation dose reduction to 4.5% accomplished by the biphasic protocol, whereas a significantly greater 14.8% radiation dose reduction by the biphasic protocol could be achieved in the group without tube current saturation. A significant difference in the dose reduction percentages between the conventional and biphasic protocols also was found between the groups with and without tube current saturation in the biphasic chest pain protocol (3.8% vs. 12.0%). However, the difference in the dose reduction percentages between the two protocols was not statistically significant for the groups with and without tube current saturation in the uniphasic chest pain protocol (8.6% vs. 13.1%).
Frequent tube current saturation (24.0–68.3%) in the tube current modulation curve in this study might be attributed to fast gantry rotation time of the three tested retrospectively ECG-gated spiral scans, as reported in a previous study (14). However, fast gantry rotation time cannot be compromised in cardiovascular CT. Tube current saturation might also be influenced by the use of lower tube voltages empirically determined in this study, as demonstrated in previous studies (1516). Consequently, the tube voltage showing tube current saturation needs to be changed to the next high tube voltage to increase radiation dose efficiency of these CT protocols. In fact, this strategy was applied to actual patient scanning using the biphasic chest pain protocol for major tube current saturation. Minor tube current saturation could be resolved by slightly decreasing the tube current time product per rotation.
The volume CT dose index values of the uniphasic chest pain protocol (12.9 ± 4.9 mGy) was, as expected, higher than those of the biphasic chest pain protocol (10.8 ± 3.9 mGy) and even slightly higher than those of the conventional protocol (12.2 ± 4.7 mGy). As a result, the clinical use of the uniphasic chest pain protocol appears irrelevant. Nevertheless, the comparison between the uniphasic and biphasic chest pain protocols in this study seems to facilitate the understanding of a dose reduction principle in the dual-source biphasic chest pain protocol.
As compared with dual-source conventional retrospectively ECG-gated spiral scan, effective dose (20.4 mSv vs. 3.8–4.1 mSv) and scan time (15 seconds vs. 0.7–0.8 seconds) of the chest pain protocol using prospectively ECG-triggered high-pitch dual-source spiral scan can be substantially decreased (1718). Radiation dose of the chest pain protocol using high-pitch dual-source spiral scan was comparable to that (4.4 mSv) of non-ECG-synchronized chest CT (17). Because of these merits, the high-pitch dual-source spiral scan is often used for cardiothoracic CT in our institution if the CT examination is required only for the morphologic evaluation of cardiovascular structures. It should be noted that image quality of high-pitch dual-source spiral CT may be degraded, especially in assessing the coronary arteries, at high heart rates (> 65 beats per minute) which is common in children (18). Despite its low radiation dose, prospectively ECG-triggered high-pitch dual-source spiral acquisition cannot provide ventricular function assessment because the cardiac phases are different in different slice positions (19). Therefore, retrospectively ECG-gated spiral acquisition is currently the best way for ventricular function assessment in cooperative patients at the expense of high radiation dose.
Effective dose of dual-source retrospectively ECG-gated spiral biphasic chest pain cardiothoracic CT using 100 kVp or 120 kVp remains high with a range of 9.6–21.9 mSv (1220). Automatic tube voltage selection based on patient attenuation, examination type, and system limitations allows for a significant reduction in radiation dose in the range of 18–49% while maintaining or improving image quality primarily by lowering tube voltage in the majority of patients in chest and abdominal CTs (212223). It remains to be clarified in a further study whether a comparable radiation dose reduction of the biphasic chest pain CT protocol can be achieved by using the automatic tube voltage selection. The automatic tube voltage selection software may suggest the use of higher tube voltage in the biphasic chest pain CT protocol because low tube voltages are already used in the protocol that was proven to be the main cause of tube current saturation decreasing radiation dose efficiency.
Of importance, target reference radiation dose level should be determined by a user prior to the automatic tube voltage selection. In this regard, the volume CT dose index value determined by the cross sectional area and mean body density of an axial image may be used to decide an initial radiation dose level. A final radiation dose level may be automatically adjusted by applying tube current modulation to a whole scan range. Actually, in this study, higher volume CT dose index values based on the cross sectional area and mean body density developed for non-ECG-synchronized cardiothoracic CT as well as higher tube current time product per rotation of the conventional protocol were closely related to tube current saturation in 76 patients using 100 kVp as expected (Table 4).
Although pediatric cardiac CT (median effective dose 1.0 mSv, range 0.2–10.5 mSv) was not a major contributor to high 5-year cumulative CT dose in a study (24), the increasing use of retrospectively ECG-gated spiral cardiothoracic CT in children and adults is anticipated to increase its contribution to high cumulative CT dose in the near future. Therefore, an approximately 15% radiation dose reduction achieved by the biphasic chest pain CT protocol in this study, as long as tube current saturation is avoided, seems to have a non-negligible clinical implication.
This study has severe limitations. First, image quality of the three CT protocols was not evaluated in this study. However, it is clearly unethical to perform three high-dose CT scans in the same patients for clinical research. On the other hand, estimated radiation doses between the three CT protocols could be compared without actual scanning in the same patients to minimize intergroup bias, as demonstrated in a previous study (23). Based on the results of this study, the conventional retrospectively ECG-gated spiral cardiothoracic CT was completely replaced by the biphasic chest pain protocol in our institution. Since then, no substantial image degradation on the cardiothoracic CT images acquired with the biphasic chest pain protocol has occurred in clinical practice. Currently, the conventional protocol is used only for coronary CT angiography in our institution. Second, tube voltage was not completely optimized for the cardiothoracic CT protocols in this study. The software showing the tube current modulation curve was not available before January 2013 in our institution and it is very difficult to appreciate tube current saturation without this software. The empirical use of less optimized low tube voltages actually unveiled the importance of avoiding tube current saturation to maximize radiation dose reduction of the biphasic chest pain CT protocol. The remedies to avoid tube current saturation in the current biphasic chest pain protocol include an increase of tube voltage to the next level and a slight decrease in tube current. Increased image noise caused by the latter remedy may be compensated by using an iterative reconstruction algorithm or a slightly thicker slice thickness.
In conclusion, radiation dose of dual-source retrospectively ECG-gated spiral cardiothoracic CT can be reduced by approximately 15% by using the biphasic chest pain protocol instead of the conventional protocol in children and adults if radiation dose parameters are further optimized to avoid tube current saturation.
Go to :
 XML Download