

 PDF
PDF ePub
ePub Citation
 Print
Print


INTRODUCTION
Kidney transplantation is the therapy of choice in patients with end-stage renal diseases, but has an inherent risk of deterioration in kidney function. Early detection of transplanted kidney parenchymal abnormalities is vital during post-transplantation assessment to allow for initiating an appropriate treatment and to improve graft survival (1234). A transplanted renal biopsy with histopathologic evaluation is the gold standard for evaluating transplanted kidney parenchymal abnormalities. However, transplanted renal biopsy has inherent risks and complications such as bleeding and sampling errors. Thus, it is necessary to develop noninvasive methods to assess transplanted kidneys.
Imaging, especially magnetic resonance (MR), is playing an important role in transplanted kidney evaluation (56). Diffusion-weighted imaging (DWI) provides functional information on the Brownian motion of water molecules. Since the main kidney functions are related to the transportation of water, diffusion characteristics may be indicative of the functional status of different renal diseases (7). DWI yields an apparent diffusion coefficient (ADC) value as a quantitative parameter, which integrates the effects of both diffusion of the water molecules and microcirculation of blood in capillaries and leads to overestimate diffusion effects.
To overcome these shortcomings, LeBihan et al. (8) proposed the intravoxel incoherent motion (IVIM) theory. In this approach, signal attenuation is fitted bi-exponentially to a number of b-values, which makes it possible to separate diffusion and micro-circulation contributions quantified with some selected parameters, such as total ADC (ADCT), perfusion-free ADC (ADCD) and perfusion fraction (FP). ADCT values were calculated with a monoexponential analysis. FP represents the contribution of microcirculation of blood and movement in predefined structures, such as tubular flow to signal decay, while ADCD represents predominantly pure diffusion.
Although many studies reported the values of DWI in evaluating renal disease, only a few studies used this type of imaging to assess renal grafts (79101112). Thoeny et al. (7) demonstrated the feasibility and reproducibility of DWI with multi-b values in allografts, with stable function at 9 months after transplantation and showed a significant correlation between ADC and serum creatinine level. DWI was also an indicator for the diagnosis of acute renal transplant dysfunction (910). Furthermore, it yields constant results on the role of DWI in evaluating recipients during longitudinal follow-up studies (1112). These studies suggest that DWI is a promising indicator of graft dysfunction. However, traditional DWI sequence is prone to the artifacts related to susceptibility and eddy currents, leading to image ghosting and distortion, and impaired accuracy of diagnosis.
Saritas et al. (13) proposed a reduced field-of-view diffusion-weighted imaging (rFOV DWI) method, which employed a two-diemnsional spatially selective echo-planar radiofrequency excitation pulse and a 180° refocusing pulse to reduce the FOV in the phase-encode direction. This method also suppressed the signal from fat simultaneously. This technique provides images with higher in-plane resolution and less artifacts and distortion (13). To the best of the researchers' knowledge, there has been no report on the role of rFOV DWI in evaluating transplanted kidneys.
Thus, in this study, the research sought to determine whether diffusion parameters vary in different estimated glomerular filtration rate (eGFR) levels and correlate with clinical indicators.
Go to : 
MATERIALS AND METHODS
Study Population
The local ethics committee approved this prospective study and all participants provided written informed consent. Forty-nine renal allograft recipients were subsequently recruited in this study between March 2014 and October 2014. The inclusion criterion was written informed consent. Exclusion criteria were the MR imaging contraindications such as metallic implants (n = 3), pregnancy (none) and marked motion artifacts (n = 6). Thus, 40 consecutive participants (14 females, 26 males; mean age, 36 ± 10 years; range, 16–59 years) were included. MR examination was performed 10 ± 11 months (range, 1–42 months) after kidney transplantation. This study also included 18 healthy volunteers (13 women, 5 men; mean age, 45 ± 8 years; range, 32–59 years) without a previous history or findings related to renal diseases, who underwent the same protocol.
MR Imaging
The subjects required fasting and water deprivation for 6 hours before the MR imaging, so as not to affect the diffusion results. They were also trained to breathe in a quiet regular rhythm with uniform respiratory frequency and amplitude before the MR examinations. MR imaging was performed on a 3T MR imaging system (Discovery MR750; GE Healthcare, Milwaukee, WI, USA) with a 32-channel phase-array torso coil. For the morphologic evaluation, a coronal T2-weighted single shot fast spin echo sequence with auto-calibrating reconstruction for Cartesian sampling acceleration, an axial propeller T2-weighted imaging and an axial liver acquisition with volume acceleration sequence were performed.
For DWI, an axial rFOV DWI sequence was applied. Ten b values were fitted to separate microcirculations from diffusion contributions. Diffusion gradients were applied in three orthogonal directions and were subsequently averaged. Respiratory triggering was used to reduce the motion artifacts. Section positioning was identical to that of the coronal T2-weighted imaging sequence. Mean acquisition time was about 4 minutes and 30 seconds, depending on the breathing cycle, which is similar to conventional DWI. The MR scanning parameters used in this study are listed in Table 1.
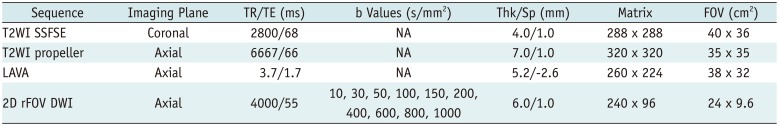
Table 1
Magnetic Resonance Imaging Parameters
FOV = field of view, LAVA = liver acquisition with volume acceleration, NA = not applicable, rFOV DWI = reduced field-of-view diffusion-weighted imaging, Sp = intersection gap, SSFSE = single shot fast spin echo, TE = echo time, Thk = section thickness, TR = repetition time, T2WI = T2 weighted imaging, 2D = two-dimensional
![]()
MR Data Processing
Magnetic resonance data were reconstructed on a host computer and transferred to a GE workstation with a standard software package (Advantage Workstation Volume Share 5, GE Healthcare). Two abdominal radiologists (with 8 and 6 years of experience in interpreting abdominal MR imaging) worked in consensus to place regions of interest (ROIs) on rFOV DWI images, based on the T1-weighted images. They were blinded to the clinical findings. ROIs were placed in the upper, middle, and lower pole of the renal cortex and medulla on sections that covered large parts of the kidney in DWI images.
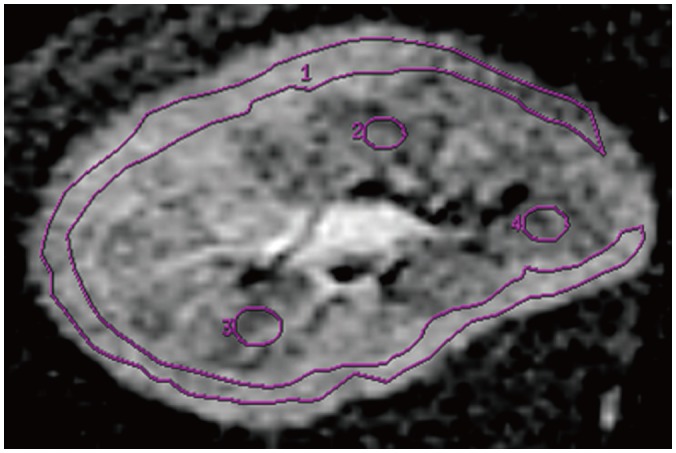
The ROI should be as large as possible in the cortex and several elliptical ROIs in the medulla for each section (Fig. 1). The diffusion parameters were calculated by Functool software 9.4.05 of Advantage Workstation Volume Share 5 (GE Healthcare) and averaged values within each ROI were calculated and recorded. Mean values and standard deviations of ADCT, ADCD, and FP values in renal medulla and cortex were calculated for each patient. ADCT values were calculated by a monoexponential analysis (equation 1), while ADCD and FP values were calculated by a biexponential analysis (equation 2).
The same procedure was applied to measuring both kidneys in each healthy volunteer. The values of ROIs in the both kidneys in each subject were averaged for final analysis.
Blood Tests
The blood samples were obtained immediately after MR imaging both in patients and healthy volunteers to measure the serum creatinine and calculate the eGFR, by using the Chronic Kidney Disease Epidemiology Collaboration (CKD-EPI) equation (14). The patients were further grouped into 3 groups according to allograft function: Group 1: eGFR ≥ 60 mL/min/1.73 m2 (chronic kidney disease stage I–II, the numbers of CKD stage I and II were 4 and 12, respectively); Group 2: eGFR equal or more than 30 and below 60 mL/min/1.73 m2 (CKD stage III, the numbers of CKD stage IV and V were 6 and 2, respectively); Group 3: eGFR < 30 mL/min/1.73 m2 (CKD stage IV–V).
All volunteers had eGFR ≥ 60 mL/min/1.73 m2. Group 1 included 16 patients with eGFR ≥ 60 mL/min/1.73 m2 (7 females, 9 males; mean age, 33 ± 9 years; range, 20–46 years); Group 2 had 16 patients with eGFR equal or more than 30 and below 60 mL/min/1.73 m2 (3 females, 13 males; mean age, 38 ± 11 years; range, 23–59 years); and Group 3 had 8 patients with eGFR < 30 mL/min/1.73 m2 (4 females, 4 males; mean age, 37 ± 11 years; range, 16–47 years).
Statistical Analysis
All statistical analyses were performed with statistical software (ver. 16.0; SPSS Inc., Chicago, IL, USA). Kolmogorov-Smirnov tests were performed to evaluate for normality. ADC, FP, and eGFR values were found to be normally distributed. Two-tailed paired Student t tests were used to compare DWI parameters in the cortex and medulla. The differences of ADCT, ADCD, and FP values among 4 groups were performed with an one-way analysis of variance (ANOVA) with Student-Newman-Keuls post hoc contrasts, to detect significant differences between subgroups. Renal cortical ADCT and ADCD were applied with the Kruskal-Walls test to detect heterogeneity of variance, and further multiple intergroup paired comparisons were performed with the Nemenyi test. The Pearson correlation analysis was performed to determine relationships between the diffusion parameters and eGFR. The researchers applied diffusion parameters to perform a receiver operating characteristic (ROC) curve analysis to predict normal and mildly decreased renal function (eGFR ≥ 60 mL/min/1.73 m2) in renal transplanted recipients. The ROC curve was used to evaluate the diagnostic performances of diffusion parameters in predicting normal and mildly decreased renal function. A p value of less than 0.05 was assumed to represent a significant difference.
Go to :
RESULTS
Diffusion-Weighted Imaging
Diffusion-weighted images with low b values presented transplanted kidneys with high resolution (1 × 1 mm2 for axial images) and marked corticomedullary difference. The ADC maps demonstrated corticomedullary difference to a lesser extent and FP with relatively homogeneous signal intensity within the kidney (Fig. 2).
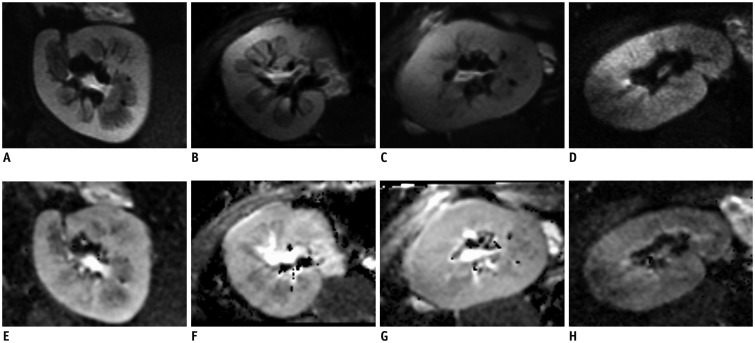 | Fig. 2DWI images and ADC maps of transplanted kidneys in different groups.DWI images (A–D) with b value of 10 s/mm2 with high resolution (1 × 1 mm2 for axial images) and ADC (E–H) maps of kidneys in 4 groups. Images from healthy volunteer (A, E) with eGFR = 102.1 mL/min/1.73 m2 and patient (B, F) in Group 1 with eGFR = 97.1 mL/min/1.73 m2 show marked corticomedullary differences. Images (C, G) from patient (eGFR = 54.59 mL/min/1.73 m2) in Group 2 show corticomedullary difference to lesser extent. Images (D, H) from patient (eGFR = 17.00 mL/min/1.73 m2) in Group 3 show no marked corticomedullary difference. ADC = apparent diffusion coefficient, DWI = diffusion-weighted imaging, eGFR = estimated glomerular filtration rate
|
Table 2 illustrates the values of different DWI parameters in the renal cortex and medulla in 4 groups. Renal cortical parameters including ADCT, ADCD, and FP were significantly higher than those in the medulla of the subjects (all p < 0.05).
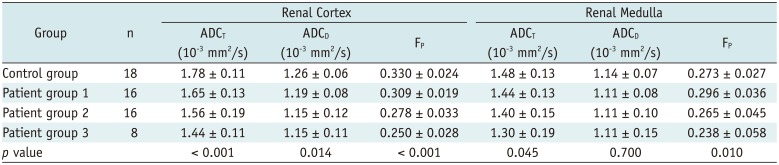
Table 2
Comparison of Diffusion-Weighted Imaging Parameters among 4 Groups
![]()
Cortical FP (0.330 ± 0.024) in the control group was significantly higher that in Group 1 (0.309 ± 0.019). The cortical ADCT (1.78 ± 0.11 × 10⁻³ mm2/s) and FP in the control group was significantly higher than those in Groups 2 and 3. The cortical ADCD (1.26 ± 0.06 × 10⁻³ mm2/s) in the control group was significantly higher than that in Group 2 (1.15 ± 0.12 × 10⁻³ mm2/s). The medullary ADCT (1.48 ± 0.13 × 10⁻³ mm2/s) in the control group was significantly higher than that in Group 3 (1.30 ± 0.19 × 10⁻³ mm2/s).
For patients with renal transplantation, significant differences were detected in all parameters except for medullary ADCD. There were no differences between patients of 3 groups in cortical ADCD and medullary ADCT with post hoc contrasts. In the cortex, ADCT in Group 1 was higher than Group 3 (p < 0.05), and the differences in FP values between each two groups were statistically significant (p < 0.05). The medullary FP was significantly higher in Group 1 than Group 3 (p < 0.05) (Table 2, Fig. 3).
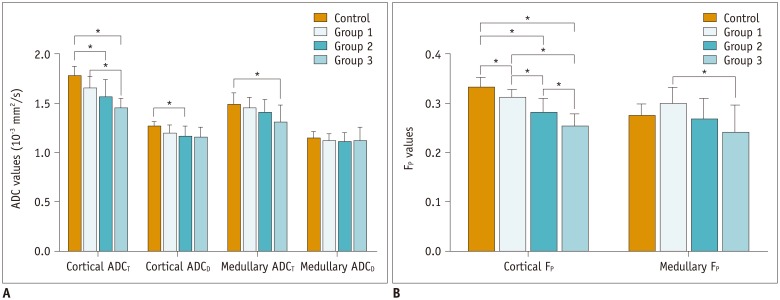 | Fig. 3Diffusion parameters in different groups.
A. Cortical ADCT differs significantly among eGFR levels (p < 0.001). ADCT in Group 1 is significantly higher than Group 3 (p < 0.05). B. Cortical FP differs significantly among eGFR levels (p < 0.001), cortical FP values between each two groups show significant differences (p < 0.05). Medullary FP is significantly higher in Group 1 compared to Group 3 (p < 0.05). ADCD = perfusion-free apparent diffusion coefficient, ADCT = total apparent diffusion coefficient, FP = perfusion fraction
|
Correlations of DWI Parameters with eGFR
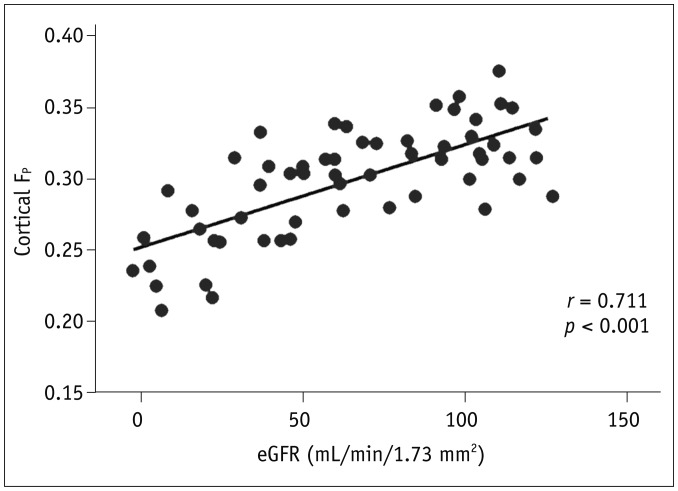
In the renal cortex of renal transplanted recipients, ADCT (r = 0.596, p < 0.001), ADCD (r = 0.403, p = 0.002), and FP (r = 0.711, p < 0.001) showed positive correlations with eGFR, while the transplanted renal medullary ADCT (r = 0.341, p = 0.009) and FP (r = 0.323, p = 0.013) positively correlated with eGFR (Fig. 4).
ROC Analysis Results
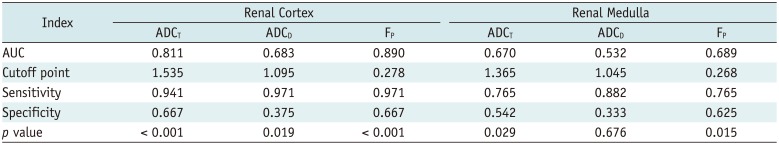
Among all six parameters, the renal cortical FP showed the largest area under curve of 0.890. Using the cutoff value of equal to or more than 0.278, FP in the cortex showed a sensitivity of 97.1% and specificity of 66.7% for predicting normal and mildly decreased renal function (Fig. 5, Table 3).
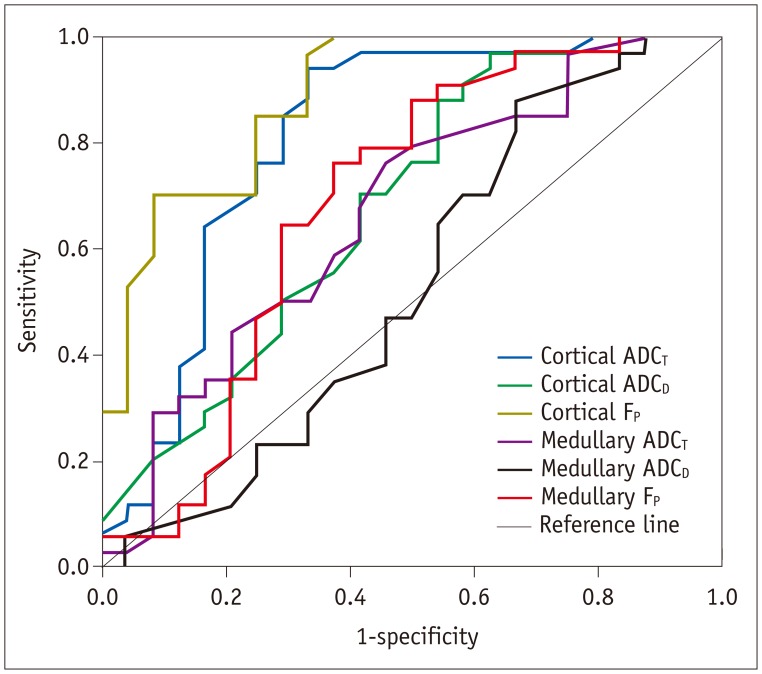 | Fig. 5Receiver operating characteristic curves of diffusion parameters.Using diffusion parameters as predictors for normal and mildly decreased renal function (eGFR ≥ 60 ml/min/1.73 m2), cortical FP shows best performance with area under curve of 0.890.
|
Table 3
Performances of Diffusion-Weighted Imaging Parameters in Predicting Decreased Transplanted Kidney Function
![]()
Go to :
DISCUSSION
This study found ADCT and FP values in patients with higher eGFR level were significantly higher than those in patients with severely decreased eGFR. This demonstrated the promising clinical utility of multi-b rFOV DWI to non-invasively monitor the function of renal allografts at different stages. Using a cutoff value of 0.278, the FP in the cortex showed a sensitivity of 97.1% and specificity of 66.7% for predicting decreased transplanted renal function. To the best of the researchers' knowledge, this is the first report using rFOV DWI to investigate the function of transplanted kidneys. In this study, ADC and FP values were significantly higher in the cortex than the medulla of transplanted kidneys. In the healthy volunteers, ADC values were higher in the renal cortex than in the medulla (15).
Yang et al. (16) used DWI to assess transplanted kidneys in rats at 7T and they observed a small difference in ADC between the cortex and medulla (16). In contrast to the findings in rats, human renal allografts presented the same signal intensity between cortex and medulla (71011). Even though conventional full FOV DWI has a good image contrast, the spatial resolution is limited, and image distortions and artifacts can be severe. Saritas et al. (13) demonstrated that images with a higher spatial resolution than regular single-shot-EPI can be obtained using the rFOV DWI method. The advantages of higher spatial resolution, less susceptibility, and partial volume artifacts of rFOV DWI can reveal details of corticomedullary difference of transplanted kidney without the need for a longer readout.
Perfusion fraction showed the differences between different kidney function levels with a higher sensitivity than ADC in this study. The separation of perfusion and diffusion from DWI measurements, according to IVIM theory, has been applied in abdominal organs such as liver, pancreas and kidney (17181920). Recent investigations suggest that this separation may be clinically useful and provide additional information compared with the standard procedure of estimating only a single parameter-ADC value. Eisenberger et al. (10) reported four patients with acute rejection and lower FP in grafts with acute rejection along with relatively unchanged ADCD suggested that lower micro-circulation rather than decreased diffusion accounted for the lower ADCT.
Heusch et al. (21) reported a significant correlation between renal allograft perfusion assessed by arterial spin-labeling perfusion measurements and FP derived from bi-exponential diffusion-weighted imaging measurements, thereby confirming FP as a reliable indicator of perfusion.
Perfusion-free ADC values remained stable between different groups in this research when ADCT and FP changed. The research results may suggest the fact that perfusion decrease was prevalent in impaired allografts as opposed to diffusion changes. Without the diffusion/perfusion separation, these changes would have been erroneously attributed to an altered diffusion status. According to the IVIM theory, FP measures the fractional volume of capillary blood flowing in each voxel (22). As interstitial fibrosis is generated in the kidneys with impaired function, the microcirculation of blood in capillaries would decrease, leading to lower FP values in DWI. This may allow research in the future to apply DWI, especially FP values, to noninvasively monitoring kidney function of recipients at different stages.
In accordance with previous studies (2324), this research found that ADCT values in patients with better kidney function were significantly higher than in patients with impaired kidney function. Toya et al. (23) retrospectively divided patients into 3 groups, according to the eGFR level with the same criteria as this research. The mean ADC values were significantly lower in the patients with eGFR < 30 mL/min/1.73 m2 than those in other groups. Cosio et al. (25) assessed the pathology of renal grafts and interstitial fibrosis/tubular atrophy was prevalent, and associated with reduced renal function. It has been demonstrated that ADC decreased in murine models of renal fibrosis (26). Therefore, the lower diffusion parameters in patients with decreased renal function may be partially a consequence of interstitial fibrosis. The cause of lower ADC values in fibrotic kidneys may be due to higher cell density and collagen deposition (27).
There are limitations in this study. First, the number of patients with eGFR < 30 mL/min/1.73 m2 was small. Second, variability in the hydration state of participants may have anticipated a small effect on diffusion results (10). The research did not exclude a systematic bias, because the subjects were told to drink moderately before MR imaging and all patient groups were affected equally. Third, no renal biopsy was performed in this study to analyze the correlation between histopathologic results and diffusion parameters. Further evaluations are needed to substantiate the interpretation of the detected DWI findings. Lastly, the researchers did not perform arterial spin labeling MR perfusion imaging to obtain blood flow of transplant kidneys which can have a correlation with FP. A further study is needed to clarify this issue in future.
In conclusion, FP seems to hold the best performance among all determined diffusion parameters to evaluate kidney transplantation function and multi-b rFOV DWI is a promising new technique for functional evaluation of renal allografts.
Go to :
 XML Download