

 PDF
PDF ePub
ePub Citation
 Print
Print


INTRODUCTION
Quantitative CT (QCT) analysis has wide acceptance as a tool to evaluate severity of chronic obstructive pulmonary disease (COPD) (12). Density mask technique is widely used to quantify emphysema. Threshold value of ≤ −950 Hounsfield unit (HU) on inspiratory CT is commonly used to define emphysema and correlates well with some spirometric measurements (345678910) and with pathologic severity of emphysema (111213). It may also correlate better with clinical status of COPD patients than spirometric evaluations (141516). However, a drawback of the density mask technique is that it is based solely on CT attenuation of voxels, and does not utilize morphological information provided by CT. It can vary depending on scanner model, scanner reconstruction parameters, degree of inspiration and smoking status (171819). Inclusion of morphological information in QCT analysis may more accurately define degrees of emphysema.
Low-attenuation (LA) cluster analysis calculates size and number of low-attenuation areas (LAA) seen in COPD on CT (20). This technique may provide additional morphological information regarding LAA, perhaps reproducing visual assessment of emphysema pattern (21). Although several investigators have used this measurement in studies (202122232425), its clinical relevance is not fully determined. Now both two-dimensional (2D) and three-dimensional (3D) methods (i.e., measuring cluster sizes two-dimensionally in each section as an area [mm2] and measuring cluster sizes three-dimensionally as a volume [mm3]) are available to calculate this measurement.
Thus the purpose of this study was to test if LA cluster analysis can provide information about severity of COPD independent of density mask technique by correlating CT measurements with physiological indices for assessment of COPD.
Go to : 
MATERIALS AND METHODS
This study was approved by our Institutional Review Board (HS-2778). Written informed consent was obtained from all subjects, and the study was compliant with the Health Insurance Portability and Affordability Act. This study was retrospectively conducted in an institution using part of the prospectively acquired COPD Gene study data.
Study Subjects
From February 2008–December 2010, 199 current and former cigarette smokers were examined by CT for COPD Gene study at our institution according to the study protocol (26) and had physiological measurements conducted, including diffusion capacity for carbon monoxide (DLCO) adjusted for alveolar volume (VA) measurement within 90 days of CT examination.
Physiological Measurements
Physiological measurements were conducted according to American Thoracic Society/European Thoracic Society guidelines (2728). Physiological measurements included forced expiratory volume during the first second of exhalation (FEV1) percent to the predicted value (%FEV1) post inhalation of a bronchodilator, FEV1/forced vital capacity ratio, and DLCO corrected for VA (DLCO/VA).
CT Examination
CT examination was conducted according to standardized COPD Gene study protocol (26). In brief, the subjects underwent volumetric CT at full inspiration and at the end of normal expiration. CT scans were conducted with tube potential peak of 120 kV with fixed mAs of 200 for inspiratory CT and 50 for expiratory CT at a gantry rotation time of 0.5 seconds. Reconstructed slice thicknesses were 0.625 mm, and 0.60 mm, depending on scanners. Scans were acquired on LS-16 (General Electric Healthcare, Chicago, IL, USA), Definition-64 (Siemens Medical Solutions, Erlangen, Germany) or Definition-AS-128 (Siemens Medical Solutions) scanner.
CT Quantification
Soft tissue algorithm reconstruction of inspiratory CT images were analyzed using Pulmonary Workstation 2 software (VIDA Diagnostics, Inc., Coralville, IA, USA). Both lungs were automatically segmented, with additional manual edits as necessary by trained research assistants. Expiratory CT was not analyzed in this study.
Percent lung volumes ≤ −950 HU (LAA%) were calculated. Relationships between size and number of LAA in pulmonary emphysema conform to the power law (20). If cumulative size of the lesion is plotted against number of lesions (number of each size of a lesion) on the log-log scale, linear relationship is revealed. Cluster sizes were calculated two-dimensionally (as an area [mm2] using axial CT images) and three-dimensionally (as a volume [mm3] with LA voxels tracked in 3D) in this study (Fig. 1). Three threshold CT values (−950, −910, and −856 HU) for tracking LAA were available. Slopes (D value) of these relationships with 2D and 3D techniques at three threshold CT values were used as measurements of LA cluster analysis (2D D value-856HU, 2D D value−910HU, 2D D value−950HU, 3D D value−856HU, 3D D value−910HU, and 3D D value−950HU). The steeper the slope (increase in absolute D value), the smaller the LAA.

Data Analyses
Correlation coefficients (Spearman's rank correlation for gender and global initiative for chronic obstructive pulmonary disease [GOLD] stage and Pearson's correlation for the others) between D values (those by the 2D and 3D techniques at threshold CT values of −950 HU [D value−950HU], −910 HU [D value−910HU], and −856 HU [D value−856HU]) and LAA%, and clinical metrics and physiological measurements were calculated. Fisher's z test was used to determine if statistically significant differences existed between correlation coefficients.
Multivariable regression analyses were conducted for %FEV1 and DLCO/VA, respectively, with independent variables of sex, body mass index (BMI), age, LAA%, and D value that had strongest correlation coefficients with physiological measurements. These analyses were conducted for subjects and for subjects with mild COPD (GOLD stage 0, I, and II). p values less than 0.05 were considered statistically significant. Statistical analyses were conducted by using the IBM SPSS Statistics version 18 (SPSS Inc., Chicago, IL, USA).
Go to :
RESULTS
Subject characteristics and descriptive statistics of physiological measurements and QCT are summarized in Table 1. Results of correlation coefficients between 2D D value−950HU and −910HU and 3D D value−950HU and −910HU, and LAA%, clinical metrics and physiological measurements in subjects including subjects with mild COPD are shown in Tables 2 and 3, respectively. Data of 2D and 3D D values−856HU are not shown because these values consistently revealed lower correlations than those of corresponding D values−950HU and −910HU.
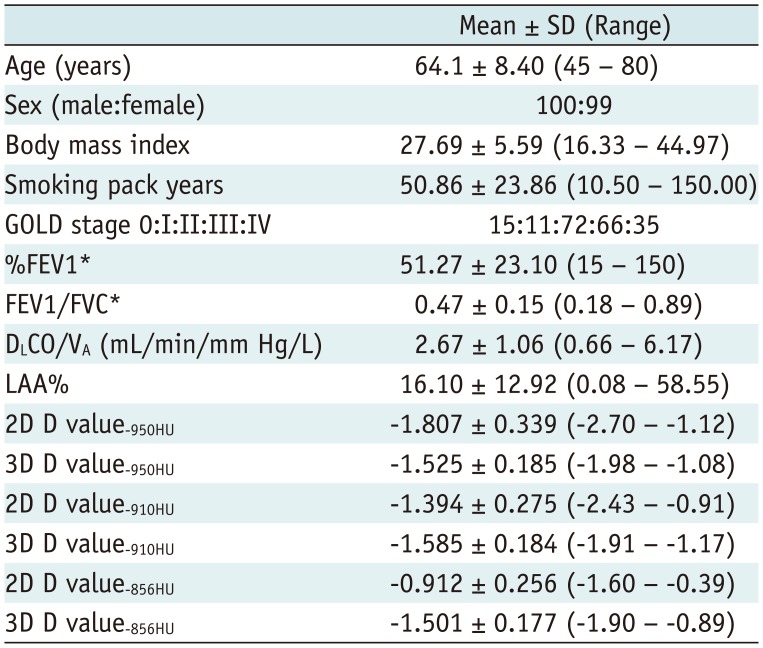
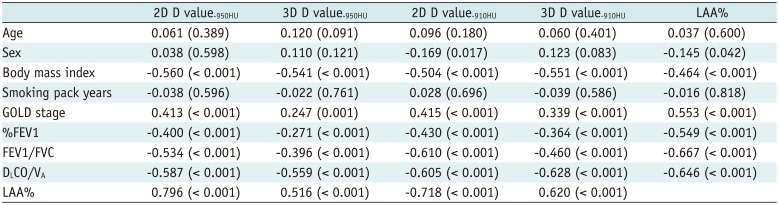
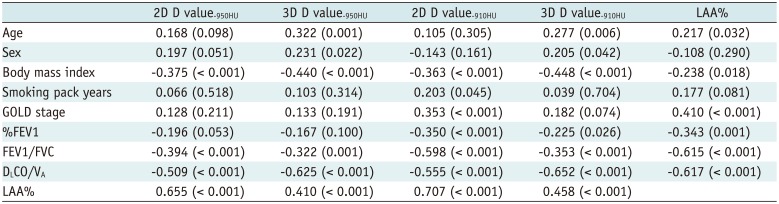
Table 1
Patient Characteristics (n = 199) and Measurements of Physiological Examinations and Quantitative CT
*%FEV1 and FEV1/FVC were measured after inhalation of bronchodilator. DLCO = diffusion capacity for carbon monoxide, FEV = forced expiratory volume, FVC = forced vital capacity, GOLD = global initiative for chronic obstructive pulmonary disease, LAA% = percentages of low attenuation areas ≤ −950 Hounsfield unit in CT value, VA = alveolar volume, 2D = two-dimensional, 3D = three-dimensional, 2D and 3D D value = slopes of functions of cluster sizes and cumulative frequencies that were calculated two-dimensionally and three-dimensionally, respectively, on log-log scale, %FEV1 = percentage of predicted forced expiratory volume at one second (see text for details)
![]()
Table 2
Correlation Coefficients (p value) between Quantitative CT Measurements (D values of Cluster Analyses and %LAA−950HU), and Clinical Metrics and Physiological Measurements in All Subjects (n = 199)
![]()
Table 3
Correlation Coefficients (p value) between Quantitative CT Measurements (D values of Cluster Analyses and %LAA−950HU), and Clinical Metrics and Physiological Measurements in Subjects with Mild COPD (GOLD Stage 0–II, n = 98)
![]()
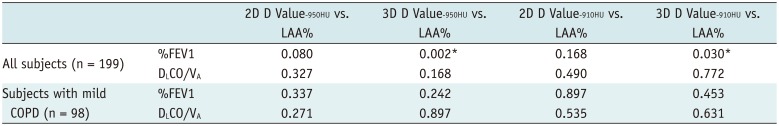
Two-dimensional and 3D D values had significant but mildly lower correlation coefficients with physiological measurements (r = −0.430, p < 0.001 between 2D D value−910HU and %FEV1; r = −0.628, p < 0.001 between 3D D value−910HU and DLCO/VA) than LAA% had (r = -0.549, p < 0.001 between LAA% and %FEV1; r = −0.646, p < 0.001 between LAA% and DLCO/VA) in subjects whereas in subjects with mild COPD some D values revealed slightly higher correlation coefficients with %FEV1 (r = −0.350, p < 0.001 between 2D D value−910HU and %FEV1) and DLCO/VA (r = −0.652, p < 0.001 between 3D D value−910HU vs. DLCO/VA) than LAA% did (r = −0.343, p = 0.001 between LAA% and %FEV1; r = -0.617, p < 0.001 between LAA% and DLCO/VA) (Fig. 2). Differences of correlation coefficients were not statistically significant (p = 0.168 for %FEV1 between 2D D value−910HU vs. LAA%, p = 0.772 for DLCO/VA between 3D D value−910HU vs. LAA% in subjects; p = 0.897 for %FEV1 between 2D D value−910HU vs. LAA%, p = 0.631 for DLCO/VA between 3D D value−910HU vs. LAA% in subjects with mild COPD) except for those between 3D D value−950HU and −910HU and LAA% in subjects (p = 0.002 between 3D D value−950HU vs. LAA%, p = 0.030 between 3D D value−910HU vs. LAA%) (Table 4).
 | Fig. 2Scatter plots showing relationships between %FEV1 and LAA%, and %FEV1 and 2D D value−910HU.
A. %FEV1 vs. LAA% in subjects. B. %FEV1 and 2D D value−910HU in subjects. C. %FEV1 vs. LAA% in subjects with mild emphysema. D. %FEV1 vs. 2D D value−910HU in subjects with mild emphysema. Note that dots are more scattered in areas with lower LAA% in (A) and (C) and that dots are closer to regression line in subjects with mild emphysema (D) than in all subjects (B). LAA% = percentages of low attenuation areas ≤ −950 Hounsfield unit in CT value, 2D = two-dimensional, 2D D value = slopes of functions of cluster sizes and cumulative frequencies that were calculated two-dimensionally, on log-log scale, %FEV1 = percentage of predicted forced expiratory volume at one second
|
Table 4
Results of Fisher's Z Tests
![]()
Among threshold CT values for calculating D value, 2D or 3D values at −910 HU always had the highest correlation coefficients with physiological measurements (r = −0.430, p < 0.001 between 2D D value−910HU and %FEV1, and r = −0.628, p < 0.001 between 3D D value−910HU and DLCO/VA in subjects; r = −0.350, p < 0.001 between 2D D value−910HU and %FEV1, and r = −0.652, p < 0.001 between 3D D value−910HU and DLCO/VA in subjects with mild COPD). Comparing between 2D and 3D techniques, 2D D values revealed higher correlations with physiological measurements except for DLCO/VA (r = −0.628, p < 0.001 for 3D D value−910HU vs. r = −0.605, p < 0.001 for 2D D value−910HU in subjects; r = −0.652, p < 0.001 for 3D D value−910HU vs. r = −0.555, p < 0.001 for 2D D value−910HU in subjects with mild COPD) than 3D D values did. Consequently, 2D D value−910HU most frequently revealed highest correlations coefficients among D values. 2D D value−910HU and 3D D value−910HU had the highest correlation coefficients with %FEV1 and DLCO/VA, respectively, both in subjects (r = −0.430, p < 0.001 between 2D D value−910HU and %FEV1; r = −0.628, p < 0.001 between 3D D value−910HU and DLCO/VA) and in subjects with mild COPD (r = −0.350, p < 0.001 between 2D D value−910HU and %FEV1; r = −0.652, p < 0.001 between 3D D value−910HU and DLCO/VA), and values were used as an independent variable in the following multivariable analyses.
Multivariable analyses for %FEV1 revealed that LAA% (p < 0.001) in addition to BMI (p = 0.045) was a significant independent predictor of %FEV1 at an adjusted R2 of 0.303 in subjects (Table 5) and that no independent variable remained significant with only 2D D value−910HU revealing a marginal p value (0.050) at an adjusted R2 of 0.119 in subjects with mild COPD (Table 6). Multivariable analyses for DLCO/VA revealed that LAA% (p < 0.001 both in subjects and subjects with mild COPD) and 3D D value−910HU (p < 0.001 both in subjects and subjects with mild COPD) in addition to age (p < 0.001 in subjects and p = 0.022 in subjects with mild COPD) were significant independent predictors of DLCO/VA both in subjects (adjusted R2 = 0.520) (Table 5) and subjects with mild COPD (adjusted R2 = 0.555 ) (Table 6). Additionally, LAA% had the highest standardized β value among independent variables on the multivariable analysis for all subjects (−0.424) (Table 5) whereas 3D D value−910HU had the highest β value (−0.410) (Table 6) for subjects with mild COPD.
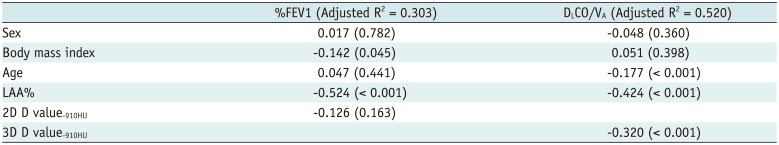
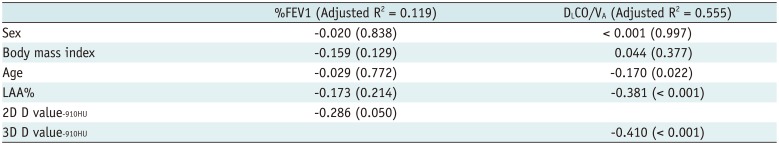
Table 5
Multivariable Analyses for FEV1% and DLCO/VA in All Subjects (n = 199)
![]()
Table 6
Multivariable Analyses for FEV1% and DLCO/VA in Subjects with Mild COPD (GOLD Stage 0–II, n = 98)
![]()
Go to :
DISCUSSION
Our study validated that cluster size analysis significantly correlated with physiological measurements for COPD although correlations were slightly weaker than those of the density mask technique (LAA%). When subjects were restricted to those with mild COPD, correlation coefficients between 2D and 3D D values and physiological measurements became higher whereas those between LAA% and physiological measurements became lower with 3D D values−950HU and −910HU revealing higher correlation coefficients with DLCO/VA than LAA% although these differences were not statistically significant. Multivariable analyses also validated that only 2D D value−910HU revealed a marginal p value (0.05) among independent variables in the regression model for %FEV1 and that 3D D value−910HU had slightly higher standardized β value than LAA% in the regression model for DLCO/VA in subjects with mild COPD. Results may suggest that in mild COPD cluster analysis more accurately represents severity of diseases. Zach et al. (29) revealed that healthy non-smoking adults had low attenuation areas, with a mean LAA% of 2.0 percent perhaps related to image noise and/or air in small peripheral airways. LAA impair detection of early emphysema. Since such LAA are likely to occur in isolated voxels, cluster size analysis may be less affected by LAA unrelated to COPD. Conversely, in the case of far advanced COPD of which most LAA have reached maximum size, size distribution of LAA on cluster analysis may no longer considerably contribute to grading severity of COPD, and therefore LAA% may be more advantageous.
Cluster analysis of LAA has been used in several previous studies to evaluate severity of emphysema. Mishima et al. (20) observed that COPD patients with normal LAA% had significantly smaller D value (i.e., gentler slopes, larger LAA predominant) than healthy subjects and hypothesized that small LAA coalesce to form larger LAA in COPD patients, and D value can become smaller without increasing LAA%. Gietema et al. (21) validated that visually assessed regions of air trapping had smaller cluster sizes for a similar LAA% than those without air trapping. Tanabe et al. (25) documented that increase in LAA% and decrease in D were greater in COPD patients with acute exacerbation than those without and validated that not only enlargement of LAA but also coalescence of adjoining LAA caused progression of emphysema in patients with acute exacerbation. These reports, in addition to this study, support the concept that cluster analysis provides incremental information to density mask technique because it estimates sizes of LAA that cannot be assessed by density mask technique, namely LAA%.
The selection of LAA threshold level for defining extent of emphysema is of interest. Several previous studies revealed that threshold levels around −950 HU for LAA provide strongest correlation with pathologic extent of emphysema (12). In our study, too, LAA% at threshold of −950 HU had higher correlations with FEV1 and DLCO/VA than LAA% at thresholds of −910 HU and -856 HU (data not shown). However, as for LA cluster analysis in this study, −910 HU was a better threshold for correlations with physiological measurements. One possible explanation for this discrepancy is the effect of respiratory bronchiolitis that may increase attenuation of LAA. Several previous studies revealed that current smokers have lower LAA% than former smokers (171819). Shaker et al. (19) revealed that smoking cessation results in apparent increase in LAA%, due to improvement of respiratory bronchiolitis. Although this effect affects LAA% and cluster analysis, the impact may be significant on cluster analysis because effacement of thin connections between LAA that may occur by using a lower threshold results in substantial underestimation of sizes of LA clusters. The cluster size may be more accurately represented at higher threshold of HU.
Madani et al. (24) compared cluster analysis (D value at −960 HU and 1st percentile HU) with LAA% at the threshold of −960 HU and first percentile HU, and revealed that LAA% and first percentile HU significantly correlated with pulmonary functional tests and pathological extent of emphysema, while D value at −960 HU did not. Our results are contradictory to their observations. A couple of explanations may account for discrepancies. First, as revealed in our study, −910 HU was a better threshold than −950 HU for cluster analysis. The −960 HU they used for cluster analysis may have not been the optimal threshold for evaluating potential of cluster analysis. We used 2D and 3D techniques, each of which had advantages over each other. Second, as their results were based on investigation of resected lung specimens from lung cancer surgeries, whole lung correlations in our study may have revealed different results.
In comparison between 2D and 3D techniques, 2D D value−910HU generally revealed highest correlations with physiological measurements. However, as for DLCO/VA, 3D D value−910HU correlated better than 2D D value−910HU. We cannot determine if 2D or 3D technique is better for evaluation of COPD based on our results. We currently recommend that 2D and 3D techniques are used in evaluation of COPD.
Our study had limitations. First, although we revealed threshold of −910 HU was better than those of −950 HU and −856 HU in cluster analysis, the best threshold should be determined based on a more detailed investigation focusing on threshold CT value with smaller CT value intervals (e.g., 10 HU). Second, R2 were generally too low in regression models for subjects with mild COPD to make a definitive conclusion. The apparent advantage of cluster analysis in mild COPD subjects should be confirmed in a larger number of subjects. Third, methods of cluster analysis on CT are not standardized. Our data cannot simply be applied to other institutions.
In conclusion, cluster analysis is a clinically feasible method to evaluate severity of COPD, especially in mild COPD. The threshold of −910 HU in cluster analysis was better than those of −950 HU and −856 HU for evaluation of COPD. 2D and 3D techniques for cluster analysis were almost even and complementary to each other, and therefore we recommend using both techniques in evaluation of COPD.
Go to :
 XML Download