

 PDF
PDF ePub
ePub Citation
 Print
Print


INTRODUCTION
Focal lung ground-glass opacity (GGO) commonly displays as a mild increase in lung density on high-resolution computed tomography (CT) scans; but, it is absent of pulmonary vessels or pulmonary parenchyma overspread (1). In recent years, with the increased application of high-resolution chest CT, the chance to discover GGO in the lungs has increased. The GGO could be the imaging manifestations of multiple diseases, including benign lesions (2), preinvasive lesions or malignant tumors such as atypical adenomatous hyperplasia (AAH), adenocarcinoma in situ (AIS), minimally invasive adenocarcinoma (MIA), and invasive adenocarcinoma (IA) (3). The precise imaging characterization of each can provide a great advantage for determining treatment plans and predicting prognoses. In CT imaging, GGO is typically divided into pure ground-glass opacity (pGGO) and mixed ground-glass opacity (mGGO) (4). The pGGO value was defined as focal increased density in the lung without solid components, and mGGO was defined as focal increased density in the lung with solid components. The solid components presented as high density shadows (except for the pulmonary vessel) in the lung window without overspread to the pulmonary vessels or pulmonary parenchyma. In mGGO, the ratio of the solid components was found to be closely related to the malignance of the lesions and the prognosis (5678). Several recent studies indicated that the diameter was the key factor to assess whether pGGO was invasive or not (7). On the other hand, Eguchi et al. (49) demonstrated that the CT number is another possible method. However, all of the studies mentioned above focused on the morphological features of GGOs. There are few reports about the quantitative assessment of the blood supply status of GGOs and its correlation with the growth and transformation of GGOs, which is essential for fully understanding the formation and clinical implications of GGO.
Focal GGO can be characterized as possessing behavioral indolence, which means that it grows slowly. According to previous literature, the doubling time of pGGO was 813 days (10). A study conducted by Chang et al. (11) demonstrated that about 90% of GGO showed no obvious changes in a long-term follow-up. Other reports found that the probability of malignant lesions of the pGGO not changing at least 2 years after operation was about 59% (12). Therefore, doubling time alone will not allow the discrimination between benign and malignant nodules. On the other hand, GGO of malignant nodules may share the similar growth characteristics as malignant tumors. Lee's study (13) showed that the growth rate was up to 5 mm/year when the pGGO transformed into mGGO or solid nodules in the process of GGO development. It is speculated that the blood supply (and altered hemodynamics) may play a critical role in the growth of GGO and its transformation from pGGO to mGGO. At present, conventional imaging methods such both PET-CT and perfusion CT are limited to study the blood supply of GGO (14151617). PET-CT had a high false negative rate of using standardized uptake value to evaluate the GGO and perfusion CT can be conducted but requires high radiation doses, which greatly limits its clinic applications.
Recently, spectral CT imaging has emerged as a promising imaging method in that CT attenuation resulting from iodine-based contrast agents can be differentiated from those attenuated by other materials including body tissues using material decomposition analysis (18). Similar to iodine/water material decomposition technology, the iodine can be distinguished from iodine imaging without water. One of the most important applications for dual-energy spectral CT is to quantitatively determine the blood flow with iodine/water material decomposition in pulmonary nodules (1920). The purpose of the present study was to investigate the clinical potential of using iodine/water material decomposition in spectral CT to quantitatively assess the blood supply status of focal GGO and, based on that, to assess the blood supply status of different GGO types. Such an approach provides a new imaging metric for the diagnosis and prognosis of lung cancers.
Go to : 
MATERIALS AND METHODS
Clinical Data
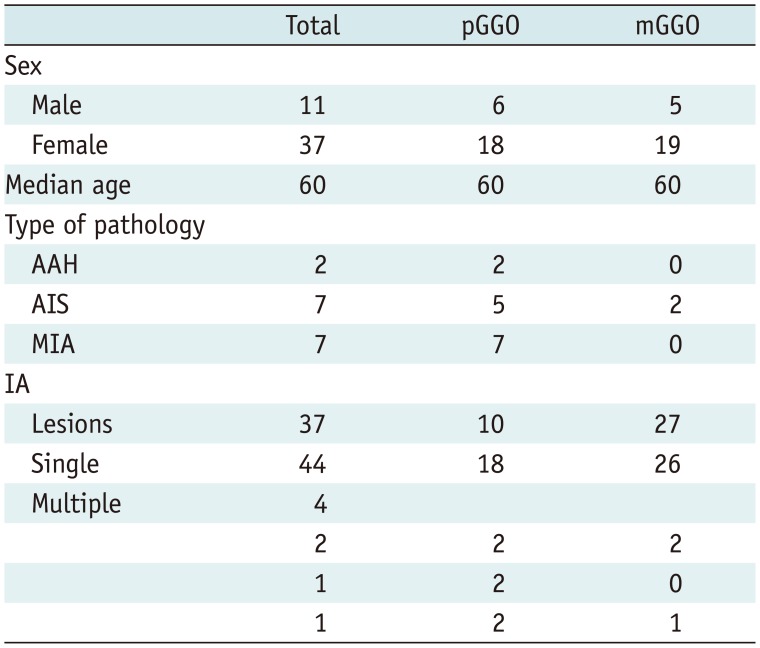
The ethics committee of the first faculty of DaLian Medical University approved the study. All participants provided their written informed consent to participate in this study. We retrospectively analyzed patients with GGO in the thoracic surgery department of the first faculty of DaLian Medical University from October 25, 2011 to June 1, 2014. All patients were absent of lung disease. We retrospectively analyzed 55 patients with GGO nodules. Five patients without pathology results and 2 patients with radiation artifacts caused by the contrast agent in the subclavian vein and hardening artifacts caused by proximity to the ribs were excluded. Ultimately, there were 48 patients with 53 GGO nodules in total (44 patients with single lesion, 3 patients with two lesions and 1 patient with three lesions). The contrast-enhanced dual-energy spectral CT scan was performed in all patients before the surgery. Of the 48 patients, 11 were male, 37 were female and the median age was 60 years (range = 41–82 years). The pathologic diagnosis was adenocarcinoma post-surgery, with 9 cases of precancerous lesions (2 cases of AAH and 7 cases of AIS), 7 cases of MIA and 37 cases of IA (Table 1).
Scan Technique
The contrast-enhanced dual-energy spectral CT scan of lungs was performed in all patients on a Discovery CT 750HD scanner (GE Healthcare, Waukesha, WI, USA). The following scanning parameters were used: 1) fast tube voltage switching between 80 kVp and 140 kVp in less than 0.5 ms during tube rotation; 2) tube current, 600 mA; 3) matrix: 512 × 512; pitch: 1.375:1; 4) tube rotation speed: 0.6 seconds or 0.8 seconds; and 5) standard algorithm for reconstruction at a slice thickness of 1.25 mm and a slice interval of 1.25 mm. A Ulrich Medical XD 200× (Ulrich Medical, Ulm, Germany) was used for the contrast injection. Iopromide (Ultravist; 300 mgI/mL, Bayer Schering Pharma, Berlin, Germany, batch number: H10970165) was injected through the median cubital vein at a dose of 70 mL, followed by an infusion of 30 mL of saline. For both injections, an infusion speed of 4.0 mL/s was used. The arterial phase (AP) scan started at 25 seconds.
Measurement Parameters and Methods
The axial CT and material decomposition images were transferred to an Advanced Workstation (AW4.5, GE Healthcare) and analyzed. Measures included the maximum diameter of GGO lesions, iodine concentration (IC) and water content (WC) of GGO lesions in the contralateral, and ipsilateral normal lung tissues. The maximum diameter of GGOs was measured on the axial CT images in the AP using the lung window (window width of 1000 Hounsfield unit [HU] and window level of −700 HU). The IC and WC levels were measured on the iodine-based and water-based material decomposition images, respectively. The IC measure for lesions was further normalized (normalized iodine concentration [NIC]) by that of the descending aorta. All measurements were repeated by the same radiologist after one month.
The pGGO was defined as focal increased density in the lung without solid components, and mGGO was defined as focal increased density in the lung with solid components. The solid components presented as a high density shadow (except for the pulmonary vessel) in the lung window without overspread to the pulmonary vessels or pulmonary parenchyma.
The principles for the measurement of GGO lesions were as follows:
1) Select the image slice with the maximum section of GGO (for mGGO, maximum area of solid components).
2) The region of interest (ROI) should cover more than 70% of the lesion area in the maximum section and avoid major vessels and bubbles.
3) For the selection of the ROI in the contralateral normal lung tissue, the same pulmonary segment, similar distance to the pleura, and similar area of ROI was applied. For the selection of the ROI in the ipsilateral normal lung tissue, the same pulmonary segment, lung tissue close to the midline area, and similar area of ROI was applied. The ROI in the normal lung tissue should include vessels smaller than the subsegmental vessels that have an equal size and number of vessels in the lesion.
4) The IC of the descending aorta was measured at the tracheal bifurcation level.
Statistical Methods
The SPSS 17.0 statistical software (SPSS Inc., Chicago, IL, USA) was used for statistical analysis. Paired student's t tests were used to compare the differences of IC and WC between the GGO lesions, contralateral, and ipsilateral normal lung tissues. Two independent samples t tests were used to compare the differences of the IC, NIC and WC between the pGGO and mGGO groups in the AP. Two independent samples rank-sum tests were conducted to compare the differences of the IC, NIC, and WC between the GGO lesions in the preinvasive lesions and MIA group and the IA group in the AP. Pearson rank correlation analyses were performed to analyze the correlation between the diameter of pGGO, mGGO and IC, and NIC in the AP. A p value of less than 0.05 was considered to be statistically significant.
Go to :
RESULTS
Group Consistency Test of the Iodine Concentration and Water Content of Lesions and Normal Lung Tissue
The intraclass correlation coefficient (ICC) values for the IC measures in the lesions, contralateral and ipsilateral normal lung tissue were 0.956, 0.881 and 0.910, respectively. The ICC values for the WC measures of the lesions, contralateral and ipsilateral normal lung tissue were 0.948, 0.781 and 0.640, respectively.
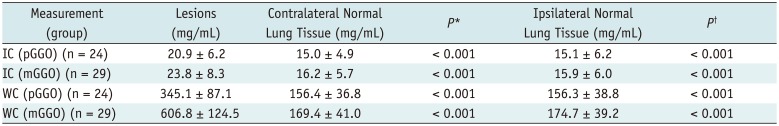
The IC of pGGO lesions (20.9 ± 6.2 mg/mL) in the AP was significantly higher than that of the contralateral (15.0 ± 4.9 mg/mL) and ipsilateral normal lung tissues (15.1 ± 6.2 mg/mL) (all p < 0.001). There was no significant difference in the IC between the contralateral and ipsilateral normal lung tissues (p = 0.958). The IC of mGGO lesions (23.8 ± 8.3 mg/mL) in the AP was significantly higher than that of the contralateral (16.2 ± 5.7 mg/mL) and ipsilateral normal lung tissues (15.9 ± 0.0 mg/mL) (all p < 0.001). There was no statistically significant difference in the IC between the contralateral and ipsilateral normal lung tissues (p = 0.837).
The WC of the pGGO lesions (345.1 ± 87.1 mg/mL) in the AP was significantly higher than that of the contralateral (156.4 ± 36.8 mg/mL) and ipsilateral normal lung tissues (156.3 ± 38.8 mg/mL) (all p < 0.001). There was no statistically significant difference in the WC between the contralateral and ipsilateral normal lung tissues (p = 0.998). The WC of the mGGO lesions (606.8 ± 124.5 mg/mL) in the AP was significantly higher than that of the contralateral (169.4 ± 41.0 mg/mL) and ipsilateral normal lung tissues (174.7 ± 39.2 mg/mL) (all p < 0.001). There was no statistically significant difference in the WC between the contralateral and ipsilateral normal lung tissues (p = 0.621) (Table 2, Fig. 1).
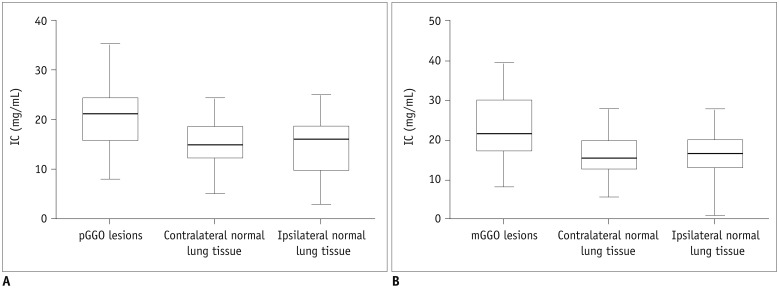 | Fig. 1Comparison of IC between GGO lesions and normal lung tissue.
A. Comparison of IC between pGGO lesions and normal lung tissue in AP. B. Comparison of IC between mGGO lesions and normal lung tissue in AP. AP = arterial phase, IC = iodine concentration, mGGO = mixed ground-glass opacity, pGGO = pure ground-glass opacity
|
Table 2
Comparison of IC and WC in Arterial Phase between Lesions and Normal Lung Tissue (unit: mg/mL)
![]()
Differences among Different Types of GGO
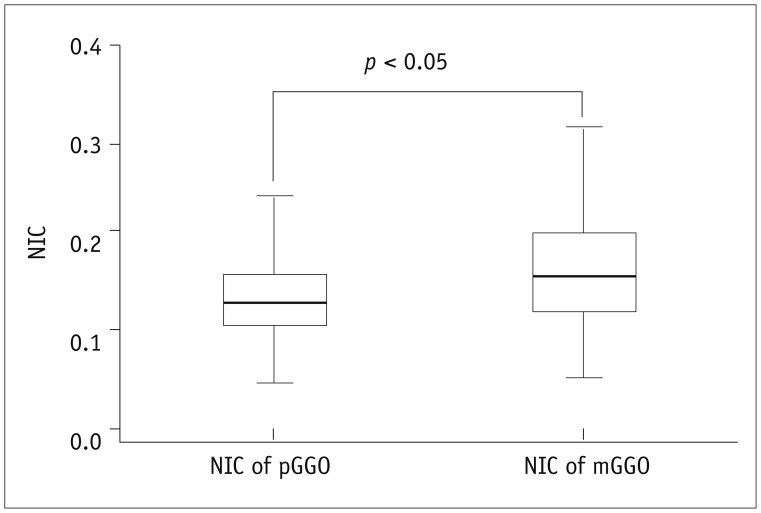
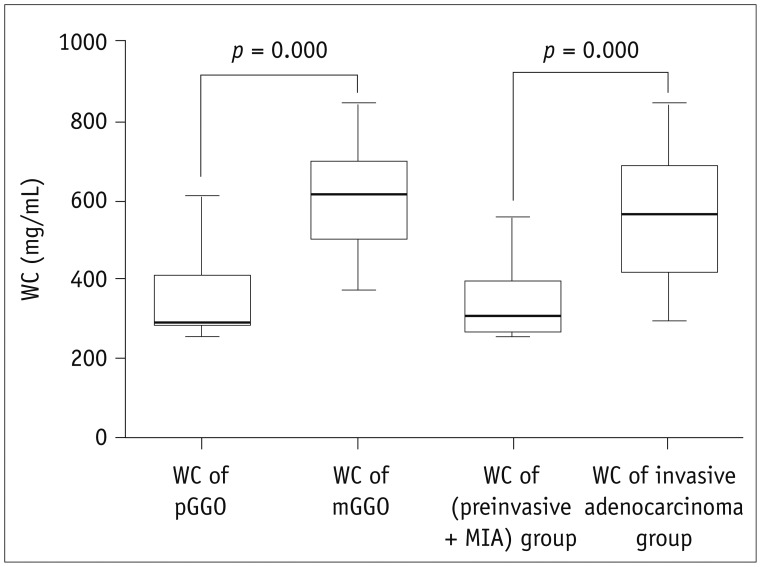
The NIC in the mGGO group (0.158) in the AP was significantly higher than that found in the pGGO group (0.132) (p = 0.049) (Table 3, Fig. 2). The WC of the mGGO group (606.8 ± 124.5 mg/mL) in the AP was significantly higher than that of the pGGO group (345.1 ± 87.1 mg/mL) (p = 0.000). There was no statistically significant difference in the levels of IC between the pGGO and mGGO groups (p = 0.161) (Table 3, Fig. 2).
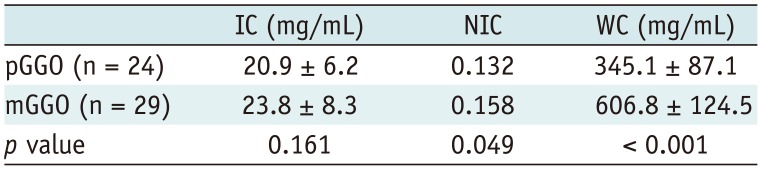
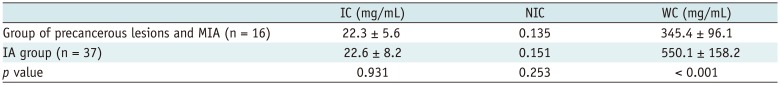
The IC and the NIC in the preinvasive lesions and MIA group (22.3 ± 5.6 mg/mL) and IA group (22.6 ± 8.2 mg/mL) in the AP showed no significant difference. The WC showed a statistically significant difference between the two groups (p < 0.001) (Table 4, Fig. 3).
The Correlation between Iodine Concentration and Diameter of GGO
In the pGGO group, the diameters were from 0.4 cm to 3.3 cm (mean 1.1 cm). There was a negative correlation between the diameter and the IC in the AP (p = 0.019, r = −0.475), but no correlation between the diameter and the NIC (p = 0.070) or WC (p = 0.553). In the mGGO group, the diameters were from 0.7 cm to 4.8 cm (mean, 1.8 cm). The diameter showed no correlation with either the IC (p = 0.496), NIC (p = 0.678), nor WC (p = 0.119).
Go to :
DISCUSSION
In this study, we investigated the clinical potential of using a material decomposition analysis in dual-energy spectral CT for assessment and the blood supply status of GGO in the lungs in order to improve the diagnosis and prognosis of different types of GGO. The material decomposition technology in dual-energy spectral CT provides a new way to quantitatively extract IC and WC without the influence of beam hardening effects as in routine CT, which greatly improves the accuracy of the CT measurement of GGO. It is particularly helpful to use dual-energy spectral CT to study the blood supply in GGO as the iodinated contrast agents are used as an indicator for blood. Because of the ability of dual-energy spectral CT to accurately determine the IC, the measurement has high sensitivity and specificity. Our study first confirmed that tumorous GGO had a blood supply, which is consistent with previous reports by Chae et al. (20) and Kawai et al. (21). Unlike those previous studies, we further performed a quantitative analysis of the IC in GGO. Our results clearly showed a marked increase in the IC in GGO with values of 20.947 mg/mL and 23.767 mg/mL (all p < 0.001) for pGGO and mGGO, respectively which is much higher than that found in normal lung tissues. These results indicate a much higher blood supply in all the types of GGO (Figs. 4, 5).
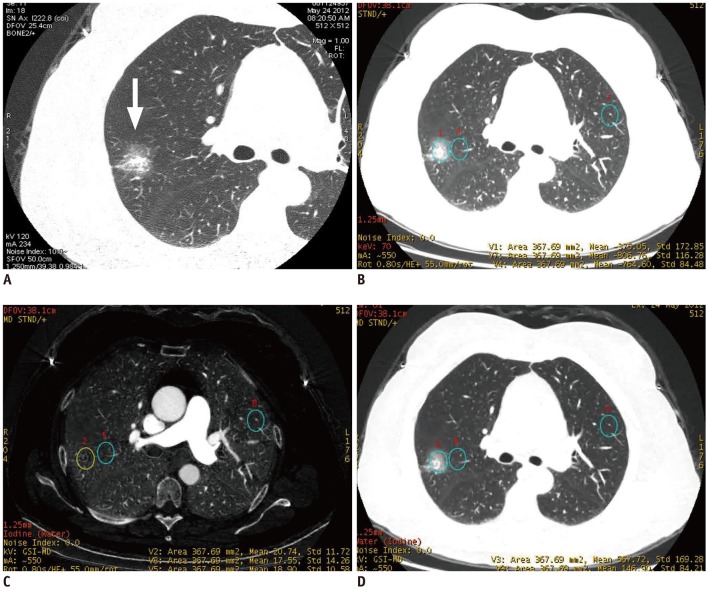
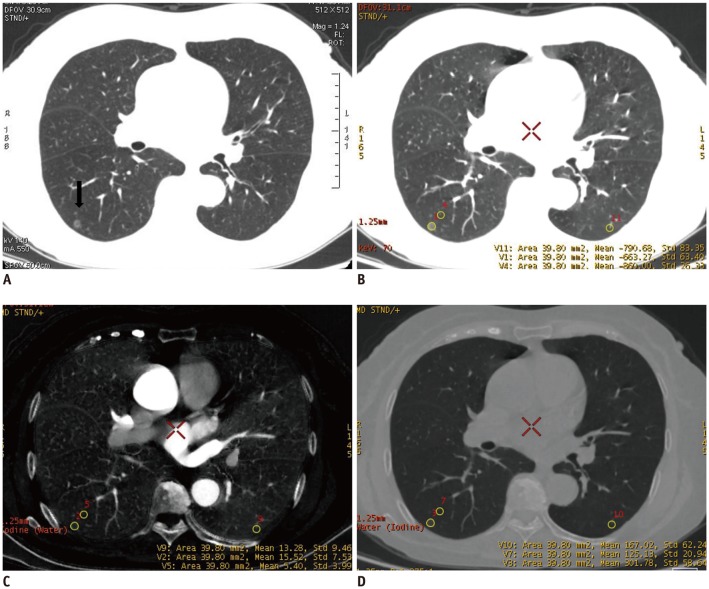 | Fig. 4Dual-energy spectral CT scan of 64-year-old female patient with pathologically verified highly differentiated adenocarcinoma.
A. HRCT image manifested as pGGO in right lower lung (arrow). B. Thin dual-energy spectral CT plain scan (lung window). C. IC image of dual-energy spectral CT in AP. IC of lesion (15.5 mg/mL) was higher than that of contralateral and ipsilateral normal lung tissuse (13.3 mg/mL, 5.40 mg/mL). D. WC image of dual-energy spectral CT in AP. WC of lesion (301.8 mg/mL) was higher than that of contralateral and ipsilateral normal lung tissues (167.0 mg/mL, 125.1 mg/mL). HRCT = high-resolution computed tomography
|
 | Fig. 5Dual-energy spectral CT study of 56-year-old female patient with pathologically verified highly differentiated adenocarcinoma.
A. HRCT image manifested as mGGO in frontal segment of right upper lobe (arrow). B. Thin dual-energy spectral CT plain scan (lung window). C. IC image of dual-energy spectral CT in AP. IC of lesion (20.7 mg/mL) was higher than that of contralateral and ipsilateral normal lung tissues (17.6 mg/mL, 18.9 mg/mL). D. WC image of dual-energy spectral CT in AP. WC of lesion (567.7 mg/mL) was higher than that of contralateral and ipsilateral normal lung tissues (146.9 mg/mL, 183.3 mg/mL).
|
Our study also demonstrated that dual-energy spectral CT could differentiate the blood supply status in different types of GGO. We performed normalization of the mean value of IC in the lesions using the value of the descending aorta at the tracheal bifurcation level. We aimed to reduce the influences of individual differences on blood flow and make IC measures that more accurately reflect the blood supply of the lesions. The NIC in mGGO group was higher than that of the pGGO group (p < 0.05). We speculate that in the mGGO group, tumor cells grow very fast along the alveolar wall or the density of tumor cells is so high that it produces solid ingredient-like image characteristics. The results of some studies showed that mGGO were more likely to grow than pGGO (22). A number of studies (456) have shown that the amount of solid components in GGO is highly correlated with malignancy and recurrence rates and thus, can be used a prognosis indicator. Our results found a relatively higher IC in mGGO, which is in alignment with previous findings of the richer blood supply in mGGO than pGGO. This finding may be used to guide the clinical evaluation and treatment planning of GGO.
Our study also showed that WC is another important imaging marker that characterizes lung GGO. Using dual-energy spectral CT, a water-based image was generated by the iodine-water paired decomposition process. Because the water-based image or virtual non-enhanced image was simultaneously generated with the iodine-based image, there is no iodine to perform on the image. Thus dual-energy spectral CT may replace the routine non-enhanced CT scan for the diagnosis of lung diseases (23). This study demonstrated that the WC of mGGO was significantly higher than that of pGGO (p < 0.001). Interestingly, the WC of GGO in the IA group was significantly higher than that found in the group of preinvasive lesions and MIA (p < 0.001). GGO commonly contains solid components and gas inside the tumor (24). When the tumor cells of the IA grow too fast, it can cause collapse of the alveolar wall and then reduce the gas content in the GGO. As a result, more residual gas exists in the noninvasive lesions than invasive lesions (25). The CT number was historically used to quantify this difference and to discriminate benign or malignant nodules. Eguchi T and others (89) proposed the use of −670 HU as the threshold value to identify benign or malignant GGO. However, the CT number is strongly dependent on the type of tube voltage and X-ray spectrum used and can be affected by the beam hardening artifacts that occur in conventional CT imaging. On the other hand, the WC in dual-energy spectral CT imaging is independent of photon energy and less affected by beam hardening artifacts, and therefore, can be used as a new imaging metric to differentiate malignant and benign GGO. Nevertheless, WC provides complimentary information to the IC in the AP in dual-energy spectral CT imaging, which enables a more accurate assessment of GGO.
It is well documented that the diameter of the solid lung nodules is an important factor to discriminate benign and malignant lesions in lungs. For example, Lee et al. (8) showed that a pGGO diameter of 10 mm could be helpful to differentiate preinvasive lesions and invasive pulmonary adenocarcinoma. Therefore, it is of interest to investigate the relationship between GGO size and blood supply using dual-energy spectral CT. Recent studies (26) have shown that the IC of malignant solid lung nodules was negatively correlated with the diameter. The authors believe that the development of hypoxia is related to the size of the tumor. However, GGO lesions often are present during the early stage of lung cancer and are not accompanied by hypoxia. So our results confirmed there is no correlation between the diameter and the NIC of GGO. We will investigate more about this interesting finding in our future study.
This study had some limitations. First, the sample size was relatively small. We expect that the accuracy of the statistical analyses would improve if the sample size was larger. In addition, we mainly focused on the comparison of the GGO characteristics between pre-invasive and IA. Therefore, we did not collect and analyze the differences of dual-energy spectral CT material decomposition among other pathological types of GGO. We plan to include more patients in our future studies. Finally, in this research, we focused on the analysis of dual-energy spectral CT measurements in the AP not the venous phase. While still unknown, the IC in the venous phase may provide complementary information for a better understanding of the GGO blood supply. We will add new venous phase measurements in our future studies.
In conclusion, the IC and WC in GGO can be quantitatively measured using dual-energy spectral CT and material decomposition analysis. This approach is indicative of the blood supply in the GGO lesion. This technique can be used to evaluate blood supply status of the GGO lesions in lungs and to provide more accurate diagnosis and prognosis for lung cancer.
Go to :
 XML Download