

 PDF
PDF ePub
ePub Citation
 Print
Print


INTRODUCTION
The recent increased use of computed tomography (CT) in medical imaging has resulted in an alarming increase in Imagingcollective patient exposure to radiation (1). To minimize the radiation risk, a couple of CT radiation dose reduction techniques have been developed and are frequently implemented in our clinical practice (2345). Among the strategies, an iterative reconstruction (IR) method is now commonly used to reduce the CT radiation dose mainly by reducing image noise and ultimately replacing filtered back projection (FBP) method (45678910111213). In this regard, it is imperative to define the lowest acceptable limit of radiation dose required to obtain appropriately and adequately-diagnostic CT images reconstructed with IR, because repeat scanning resulting from non-diagnostic quality is the worst case scenario when one considers the importance of CT radiation dose optimization (45).
Computed tomography image quality is often assessed subjectively, by radiologists who are human. Subjective interpretation tends to address a specific diagnostic task and, therefore, can simulate real clinical practice. However, the result is subjective and substantially influenced by the preference and experience of each radiologist, and inter-reader variability in a study (and particularly between studies) is non-negligible. Subjective comparisons between FBP and IR images (or between different IR images) are often not only cumbersome, but also inconsistent because they commonly show delicate nuances and subtle differences which can be difficult to discern by the naked human eye. Consequently, the recommended IR algorithms have commonly failed to be in consensus between different studies. In this respect, objective or quantitative evaluation of CT image quality by using image noise, signal-to-noise ratio (SNR) and contrast-to-noise ratio (CNR) facilitates inter-study comparisons and is better for the purpose of identifying and defining the optimal lower limit to produce CT images of diagnostic quality. However, the evaluations are usually focused on several particular regions of interest and do not encompass the entire CT image, do not address the “big picture.” The methodologic shortcoming could result in sampling errors and accordingly, would not necessarily be an accurate representation of all of the imaging attributes.
Histogram-based analysis of CT imaging has been used to provide standardized quantitative evaluation of bronchiolitis obliterans (14), vertebral metastases (15), and radiation-induced changes in pancreatic cancer (16). We hypothesized that the subtle differences between different CT reconstruction algorithms can be objectively differentiated and assessed by using a histogram-based analysis in this phantom study. As previously noted, histogram-based evaluation may overcome the drawbacks of subjective interpretation and regional quantitative evaluation because a histogram includes all pixel values of any given axial CT image. Therefore, we sought to describe quantitative image quality and histogram-based evaluation of an IR algorithm at various levels of CT radiation dose reduction up to 90% by using a chest phantom.
Go to : 
MATERIALS AND METHODS
CT Scan Protocol
A chest CT was performed on an adult-sized anthropomorphic chest phantom (RS-330; FLUKE biomedical, Cleveland, OH, USA) by using a 128-section dual-source CT system (SOMATOM Definition Flash; Siemens Healthcare, Forchheim, Germany) with non-Stellar detectors. The chest phantom extending from the neck to below the diaphragm corresponds to the body size of an average, normal adult male (175 cm in height and 73.5 kg in weight). In the animal lungs selected to match the phantom size, simulated pulmonary nodules and arteries with a blood-equivalent plastic were placed. A reference radiation dose level (volume CT Dose Index [CTDIvol], 3.4 mGy) was determined by the cross-sectional area (614.6 cm2) and mean density (−306.1 Hounsfield units [HU]) of the chest phantom on the axial image acquired approximately 2 cm above the liver dome by using a best-fit equation as we perform chest CT in patients (17). Then, CT scans were acquired at the reference (3.4 mGy), 30%- (2.4 mGy), 60%- (1.4 mGy), and 90%-reduced (0.3 mGy) radiation dose levels at all available tube voltages (70, 80, 100, 120, and 140 kVp) and, therefore, tube current for each tube voltage was adjusted to keep the CTDIvol the same, i.e., higher tube current for lower tube voltage (Table 1). Spiral CT was scanned from the first lumbar spine to the supraclavicular region in a caudo-cranial direction using a pitch of 1.0, 2 × 64 × 0.6 mm collimation with z-flying focal spot, and a gantry rotation time of 0.5 seconds. Because the required tube currents were not available for 0.5 seconds gantry rotation time, the rotation time was adjusted to 1.0 seconds for the reference dose level at 70 kVp and 0.33 seconds for the 90%-reduced radiation dose level at 120 kVp. In addition, the 90%-reduced dose level at 140 kVp could not be obtained at any gantry rotation times. The CT scan was repeated three-times at each scan setting in order to improve the reliability of CT densitometry. The CT density was measured three-times at the same location and then averaged. Therefore, a total of 57 CT scans (19 dose settings × 3) were obtained.
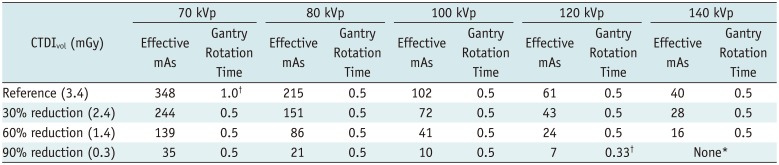
Table 1
CT Scan Protocols for Phantom Study
![]()
Image Reconstruction
Axial 5 mm-thick CT images were reconstructed with traditional FBP and the sinogram-affirmed IR (SAFIRE; Siemens Healthcare) strengths 1, 3, and 5. SAFIRE is an IR method in which raw data-based iterations to reduce image artifacts are combined with image-based iterations with a regularization step to enhance spatial resolution in high contrast regions and reduce image noise in low contrast areas (1011121318). In the SAFIRE algorithm, greater noise reduction is achieved at higher strength. Four image reconstructions were performed for each scan setting: a medium smooth kernel (B30f) was used for FBP and the corresponding IR reconstruction algorithms with strengths 1, 3, and 5 (I30f_1, I30f_3, and I30f_5) were used. Hence, a total of 228 CT images (57 CT scans × 4 reconstruction algorithms) were reconstructed for analysis.
Image Noise, Signal-to-Noise Ratio, and Contrast-to-Noise Ratio
Image evaluation was performed by using an image processing program (Image J, Wright Cell Imaging Facility, Toronto Western Research Institute, Toronto, ON, Canada). Image noise, SNR, and CNR were measured by a single observer for all image sets. Image noise was determined by measuring the standard deviation (SD) of CT numbers in a right lung nodule by placing a circular region of interest (ROI) with 1 cm2 (Fig. 1A). In addition, two circular ROIs were placed in air anterior to the chest phantom and in the right lung to measure mean attenuation (Mb) and SD (SDb) of background (Fig. 1A). SNR was calculated using the following equation: SNR = mean attenuation of nodule (Mn) / SD of nodule. CNR was calculated using the following equation: CNR = ([Mn − Mb] / SDb) (101920).
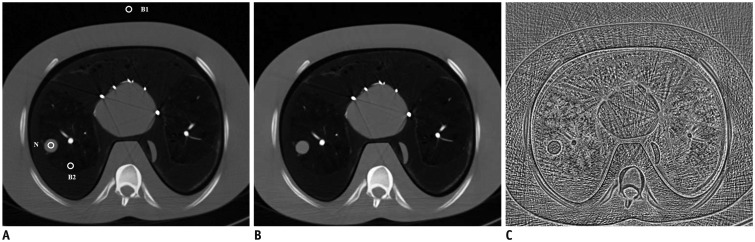 | Fig. 1Axial CT images of chest phantom obtained at reference dose level and 70 kVp.
A. Axial CT image reconstructed with FBP (B30f) demonstrates locations of three regions of interest (N, lung nodule; B1, air outside anterior chest wall; B2, right posterior lung). B. Axial CT image reconstructed with sinogram-affirmed IR with strength of 5 (I30f_5) shows decrease in image noise and increase in image blurring, compared with corresponding FBP image (A). In contrast, beam-hardening artifacts caused by simulated coronary arteries in phantom remain largely unchanged between two (A, B). C. Subtraction image between two CT images (B30f-I30f_5) clearly reveals subtle differences caused by application of IR algorithm that can be difficult to recognize by visual comparison. In addition to noise pattern, distinct outlines of chest phantom are seen on subtraction image, which can explain image blurring caused by IR technique. FBP = filtered back projection, IR = iterative reconstruction
|
Histogram-Based Analysis
The appearance of the images produced by two different CT reconstruction algorithms, either FBP vs. IR or IR vs. IR, is often sufficiently similar to allow them to be visually overlooked (Fig. 1A, B), while the subtle differences can be accentuated on the subtraction image between the two algorithms (Fig. 1C). Histogram of the subtraction images can objectively demonstrate even a minute difference in pixel distributions. Therefore, we generated six subtraction images between four different reconstruction algorithms for each scan setting as follows: B30f-I30f_1, B30f-I30f_3, B30f-I30f_5 (Fig. 1C), I30f_1-I30f_3, I30f_1-I30f_5, and I30f_3-I30f_5. Then, subtraction images were converted to histograms to assess their shapes visually (Fig. 2). As a result, a total of 114 subtraction images and histograms (19 dose settings × 6) were produced. Because the histograms were different in width and height, they were standardized to identify minute differences between them as follows. The mean attenuation (Mh) and SD (SDh) of each histogram were measured to standardize the x-axis values. Original x-axis values were converted to new standardized values by using the following formula: New x-axis value = (Original x-axis value - Mh) / SDh. On the other hand, the original y-axis values (y-axis value = the pixel number of each x-axis value) were adjusted to have maximum value 1000. Peak positions and curve shapes of the standardized histograms were compared for each scan setting.
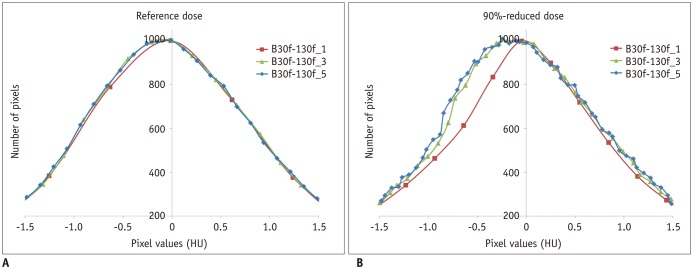
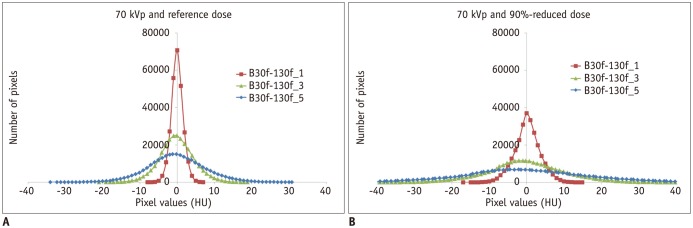 | Fig. 2Histograms of subtraction images between FBP and sinogram-affirmed IR images.Histograms of three subtraction images (B30f-I30f_1, B30f-I30f_3, and B30f-I30f_5) acquired at 70 kVp and reference radiation dose (A) and acquired at 70 kVp and 90%-reduced radiation dose (B) show gradually increased horizontal stretching with increased strength of IR algorithm. Of note, degree of their horizontal stretching is more pronounced at 90%-reduced radiation dose than at reference radiation dose for corresponding subtraction pairs. HU = Hounsfield units
|
Statistical Analysis
A statistical analysis was conducted by using a commercially available statistical program (SPSS, release 18; SPSS Inc., Chicago, IL, USA). Due to the small number of the variables, non-parametric tests were used for the statistical analysis. Image noise, SNR, and CNR among different radiation dose levels and reconstruction algorithms were compared by using Friedman tests with pair-wise post-hoc Wilcoxon signed rank. In addition, image noise differences among different tube voltages were compared by using Kruskal-Wallis tests with pair-wise post-hoc Mann-Whitney U-tests. A p value < 0.05 was considered statistically significant, and the Bonferroni correction was used to avoid an inflation of alpha error due to multiple comparisons.
Go to :
RESULTS
Image Noise, Signal-to-Noise Ratio, and Contrast-to-Noise Ratio
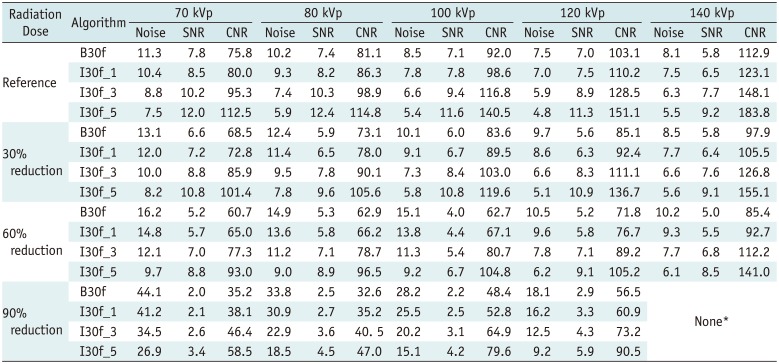
In all the reconstruction algorithms including B30f, I30f_1, I30f_3, and I30f_5, image noise was increased with increased radiation dose reduction for the same tube voltage (p < 0.0001) and increased at lower tube voltage for the same radiation dose (p = 0.001), as expected (Table 2, Fig. 3A). At the same radiation dose levels, the image noise of I30f_1, I30f_3, and I30f_5 images were gradually decreased up to 49.1% (Fig. 3B, C); the SNR and CNR values of I30f_1, I30f_3, and I30f_5 images were gradually and significantly increased up to 100.7% and 67.3%, respectively (p < 0.0001) (Fig. 4), compared with B30f images. The SNR and CNR were significantly decreased with increased radiation dose reduction at all the tube voltages (p ≤ 0.02) (Table 2). Significant image quality degradations on IR images, including 184.9% increase in image noise, 63.0% decrease in SNR, and 51.3% decrease in CNR, were appreciated between 60% and 90% reduced levels of radiation dose (p < 0.0001). A increase in image noise and a decrease in SNR were most significant between 60%- and 90%-reduced radiation dose levels at all tube voltages (Figs. 3B, C, 4A, B), while the greatest decrease in CNR between 60%- and 90%-reduced radiation dose levels was observed at 70 kVp (Fig. 4C) and 80 kVp but not at 100 kVp and 120 kVp (Fig. 4D).
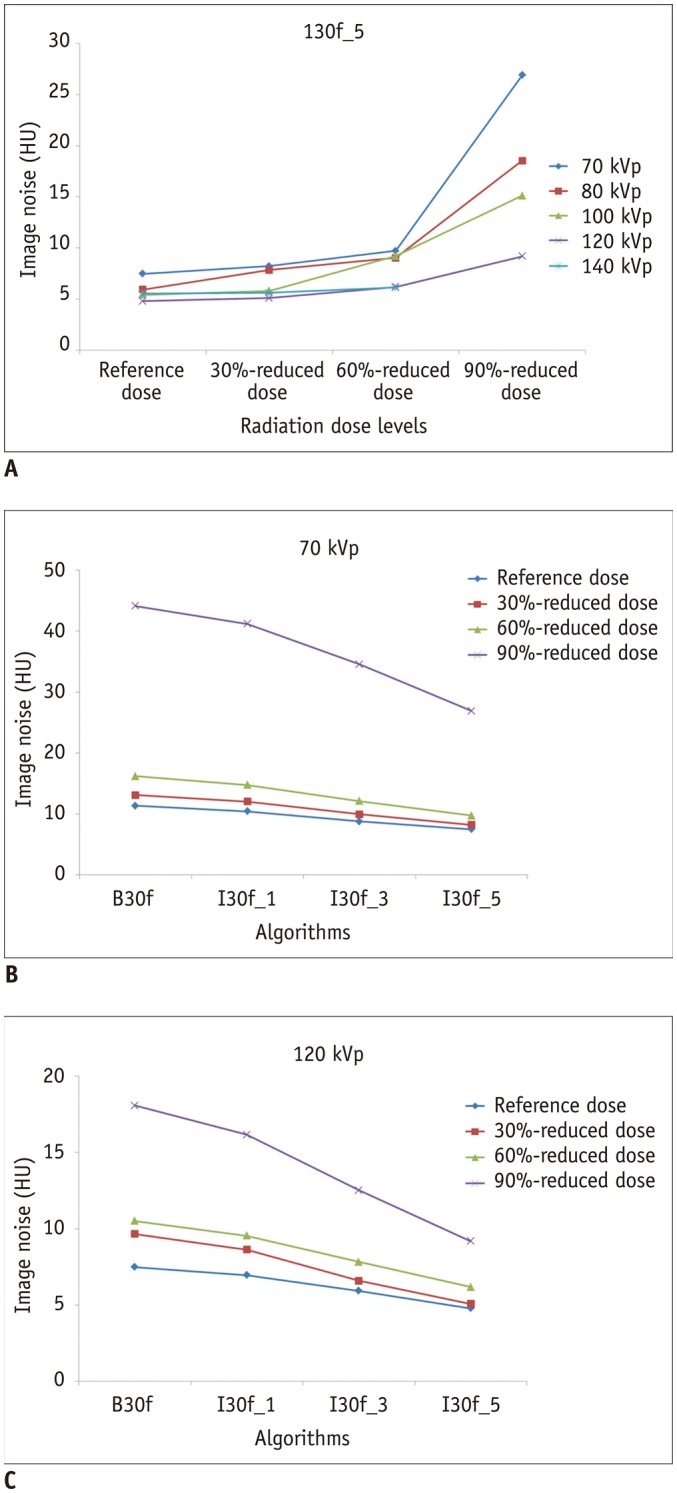 | Fig. 3Graphs demonstrating effects of radiation dose, tube voltage, and image reconstruction algorithm on image noise.
A. Graph shows markedly increased image noise of CT image reconstructed with sinogram-affirmed IR with strength of 5 (I30f_5) between 60%- and 90%-reduced radiation dose levels. B, C. Graphs demonstrate greater image noise reduction with higher strength of IR algorithm at 70 kVp (B) and 120 kVp (C). Greatest image noise change is also noted between 60%- and 90%-reduced radiation dose levels at both 70 kVp (B) and 120 kVp (C).
|
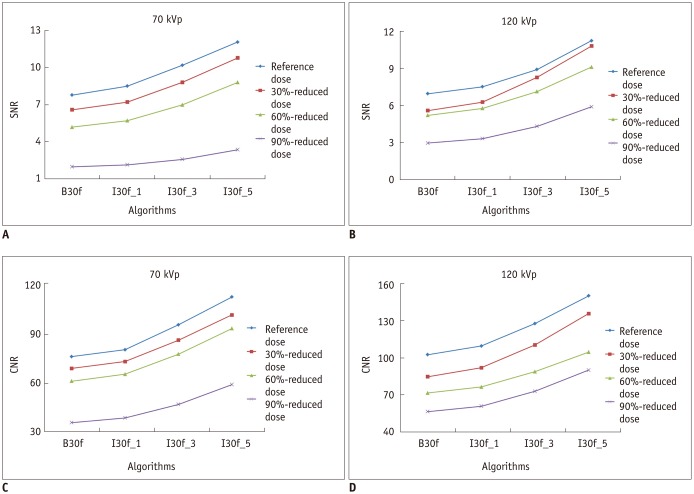 | Fig. 4Graphs demonstrating effects of radiation dose, tube voltage, and image reconstruction algorithm on SNR and CNR.
A, B. Graphs show greater SNR increase with higher strength of IR algorithm at 70 kVp (A) and 120 kVp (B). Greatest SNR change is noted between 60%- and 90%-reduced radiation dose levels at both 70 kVp (A) and 120 kVp (B). C, D. Graphs show greater CNR increase with higher strength of IR algorithm at 70 kVp (C) and 120 kVp (D). In contrast to SNR, greatest SNR change is noted between 60%- and 90%-reduced radiation dose levels at 70 kVp (C) but not at 120 kVp (D). CNR = contrast-to-noise ratio, SNR = signal-to-noise ratio
|
Table 2
Image Noise, SNR, CNR at Various Tube Voltages and Radiation Dose Levels
![]()
Histogram-Based Analysis
The histogram peaks were slightly off-center and leaned towards the left (range, −0.006 to −0.5), a feature which was more pronounced for the pairs with greater image noise differences, such as B30f-I30f_5 (range, −0.01 to −0.4) and I30f_1-I30f_5 (range, −0.05 to −0.5), and least pronounced for the pair with smaller image noise difference (B30-I30f_1) (range, −0.006 to −0.2) (Table 3). In addition, the histograms were stretched horizontally, and their peaks were decreased for the pairs with greater image noise differences (Fig. 2). The degree of the horizontal stretching was comparable at standard dose (Fig. 2A) and 30%-reduced dose but became more evident at 60%-reduced dose, and even more pronounced at 90%-reduced dose (Fig. 2B). For example, the peak of the histogram obtained from the subtraction image between B30f and I30f_1 at 70 kVp was approximately 70000 pixels at the reference dose and decreased to approximately 38000 pixels at the 90%-reduced dose (Fig. 2). On the other hand, the horizontal width of the histogram was increased from approximated ± 8 HU at the reference dose to approximately ± 15 HU at the 90%-reduced dose (Fig. 2).
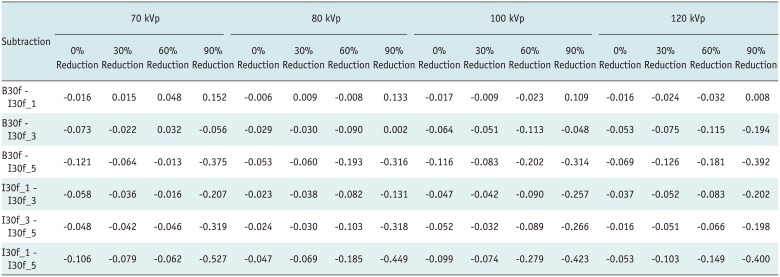
Table 3
Off-Centering of Histogram Peaks of Subtraction Images between CT Reconstruction Algorithms at Various Tube Voltages and Radiation Dose Reduction Levels
![]()
The standardized histograms appeared left-deviated, e.g., by approximately −0.3 HU in B30f-I30f_5 compared with B30f-I30f_1 at 70 kVp and the 90%-reduced dose, rather than symmetric as well as irregular rather than smooth between FBP images and IR images with strength 3 or 5 at lower radiation dose, but almost normally-distributed between FBP images and IR images with strength 1 (Fig. 5). The alterations of the curves were more pronounced at lower tube voltage. In contrast, the standardized histograms between the two different IR images remained almost normally-distributed curve patterns less affected by low radiation dose and tube voltage (Fig. 6).
 | Fig. 5Magnified standardized histograms of subtraction images between FBP and IR algorithm at 70 kVp.
A. At reference radiation dose, all three histograms are almost normally distributed and slightly skewed to right. B. At 90%-reduced radiation dose, histogram shows almost normal distribution for strength 1, but histograms show deviated and ragged appearance for strengths 3 and 5.
|
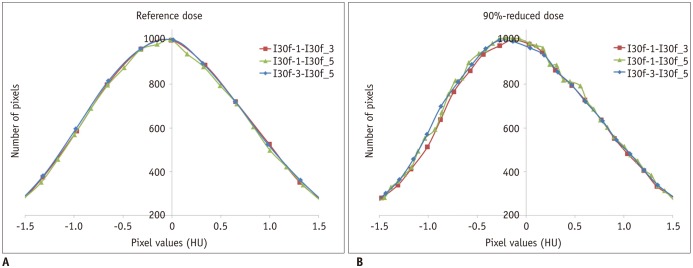 | Fig. 6Magnified standardized histograms of subtraction images between IR algorithms at 70 kVp.
A. At reference radiation dose, all three histograms are almost normally distributed. B. At 90%-reduced radiation dose, all three histograms appear minimally deviated and ragged as well as slightly skewed to right for all strengths.
|
Go to :
DISCUSSION
In our phantom study, image noise was increased and SNR was decreased with greater radiation dose reduction, up to 90% (0.3 mGy) of the reference level (3.4 mGy) regardless of the selected tube voltage and image reconstruction algorithm, as expected. These universal changes in image noise and SNR were more remarkable at lower tube voltages and between 60%- and 90%-reduced radiation dose levels. Image noise and SNR on I30f_5 images remained better (up to 70–75%-reduced radiation dose) than those on B30f images at reference radiation dose due to the maximum image noise reduction of the IR algorithm strength 5. CNR on I30f_5 images was maintained comparable to or higher than CNR on B30f images at reference radiation dose up to 60%-reduced radiation dose. Consequently, we should remain vigilant with regard to the high risk of non-diagnostic image quality, particularly when radiation dose reduction from our reference chest CT protocol goes beyond 60% (1.4 mGy) for the specific chest phantom used in this study.
Many studies have reported that IR may preserve or improve the image quality of chest CT images obtained with a reduced radiation dose (212223242526272829). Our results are comparable to those demonstrated by previous clinical studies (212223). Kalra et al. (21) reported 65% dose reduction in chest CT by using SAFIRE without losing diagnostic information based on subjective image quality, objective image noise, and noise power spectrum in 24 patients. Pourjabbar et al. (22) reported that low-dose chest CT (1.8 mGy) using IR techniques showed subjective image quality and objective image noise comparable to those in standard-dose chest CT (6.4 mGy) in 22 patients. Baumueller et al. (23) reported that, as compared with FBP, use of SAFIRE in low dose chest CT (1.4–1.5 mGy) could provide higher subjective image quality and lower objective image noise in 60 patients. In this study, subjective inter-reader variability and preference common in these clinical studies were avoided by relying on objective image quality parameters and histogram-based evaluation. Moreover, we could suggest a CTDIvol of 1.4 mGy as a lower radiation dose limit offering diagnostic image quality of chest CT in a standard-sized adult by performing quantitative image analysis at detailed radiation dose settings, a merit of a phantom study.
To evaluate the effectiveness of IR, image noise has been commonly used as one of objective image quality parameters (2021222324252627282930). However, image noise has only a gross predictive value for object detectability but does not provide information about noise spatial characteristics (31). Thus, the so-called noise power spectrum, characterized by the noise variance as a function of spatial frequency, has been recently utilized for the objective image noise evaluation (212224). However, the noise power spectrum should be obtained by designating multiple particular regions of interest, usually in a homogeneous phantom. Therefore, it seems that implementation of the noise power spectrum in an anthropomorphic chest phantom (as was utilized in this study) is both difficult and complicated.
Therefore, we used histogram-based analysis of subtraction images between corresponding FBP and IR algorithms as a quantitative parameter reflecting image texture by demonstrating pixel distribution. The histogram-based evaluation utilizes whole pixel values without a sampling error, as opposed to the method using a ROI and readily applicable to clinical images (141516). We hypothesized that the ideal histograms should show a normal or Gaussian distribution, reflecting only statistical image noise having a probability density function. Hence, any deviations from the normal distribution may indicate imperfect noise-reducing function of an IR algorithm. In our study, the histograms shifted slightly to the left, probably secondary to slight increase of CT numbers in objects, such as a nodule, on IR images, which was more pronounced between the FBP and IR algorithm pairs showing greater image noise differences. More importantly, a greater degree of horizontal stretching of the histograms seemed to be a result of not only a greater image noise difference between the image pairs, but also noisier image pairs obtained at lower radiation doses. Therefore, the degree of noise reduction may be quantified by the degree of the horizontal stretching of the histograms.
In this study, the distorted and ragged shapes of the standardized histograms, slightly skewed to the right, were observed at lower radiation doses, lower tube voltages, and higher strengths (3 and 5) of IR algorithms. These changes are thought to represent possible uncompensated image quality of IR images. Because direct visual assessment of the subtle differences and delicate nuances in image quality between corresponding FBP and IR CT images is quite challenging and subjective and sometimes impossible with the naked human eye, the standardized histogram-based analysis may provide an objective measure of subtle image degradation caused by uncompensated IR algorithm. The methodology may be directly transferable for the purpose of evaluation of clinical CT images.
However, further study is warranted to validate our findings because the histogram-based analysis has not been used for the image quality evaluation of an IR algorithm. In addition, we need to develop user-friendly software for easier clinical application of the histogram-based analysis. Then, the software may be useful to test IR algorithms for a large-scale low-dose chest CT program, such as lung cancer screening (32). Performance evaluation of an IR algorithm at low radiation dose would also be critically important in the clinical setting requiring high cumulative CT radiation dose (33).
Recently, several studies (343536) also reported degradation of image quality of CT with an IR algorithm at low radiation dose. When image quality of CT images with IR was evaluated by using an American College of Radiology CT accreditation phantom, SNR improvement was decreased below a CTDIvol of 1.42 mGy (34) almost equivalent to the 60%-reduced radiation dose (1.4 mGy) that began to demonstrate image quality degradation in our study, high-contrast resolution was decreased between 6 line pairs/cm and 7 line pairs/cm under 120 kVp and 10 mA (35), and low-contrast resolution was sacrificed at dose reduction of 25% or more (36). Of interest, Infante et al. (34) showed that the adverse effect of low dose on SNR of SAFIRE images was most pronounced for strengths of 3 and 5 and least pronounced with a strength of 1, which was exactly consistent with the findings demonstrated by our study. However, the American College of Radiology CT accreditation phantom is not an adequate or realistic human substitute for patient studies and it is, therefore, uncertain as to whether the results of these studies could be generalized to clinical images. In contrast, the results of our study seem more practical (in the clinical sense) because we used the anthropomorphic chest phantom, which reasonably represents the material anatomy of a normal, average adult male.
There are several limitations in this study. Firstly, we did not perform subjective image quality assessment by human readers. However, a couple of readers are necessary to obtain relevant results of the subjective assessment, particularly for a task discriminating subtle differences between image pairs. Instead, the histogram-based evaluation of the subtracted images not only could objectively represent the minute differences between image pairs, but also could be free from readers' subjective prejudice. Secondly, we used a specific chest phantom and our standard chest CT scan protocol. Therefore, the different results could be obtained if a different phantom and a different scan protocol are implemented. Thirdly, we tested a specific IR reconstruction algorithm in a specific CT model. Therefore, different results may be drawn in a different IR reconstruction algorithm and a different CT model. However, we demonstrated a consistent image quality loss objectively and quantitatively when we reduced CT radiation dose by more than 60% from our reference dose, especially for strengths 3 and 5 of the tested IR algorithm. Moreover, we demonstrated that the histogram-based analysis can be used to reveal the subtle differences in image quality among different CT reconstruction algorithms objectively and to help determine appropriate CT radiation dose level as a quality assurance tool crucial for large-scale, low-dose CT studies using an IR algorithm in advance. However, an analysis tool should be developed to quantitate the changes in the histogram-based evaluation to enhance and expand not only its clinical use, but also its scientific value in the near future.
In conclusion, the IR algorithm may be used to reduce radiation dose without substantial image quality degradation of chest CT in the adult anthropomorphic phantom down to approximately 1.4 mGy in CTDIvol (60%-reduced radiation dose), based on quantitative image quality parameters.
Go to :
 XML Download