

 PDF
PDF ePub
ePub Citation
 Print
Print


INTRODUCTION
Left main coronary artery disease (LMCD) is defined as luminal stenosis ≥ 50%, being detected in 4–8% of patients undergoing coronary angiography (12345). LMCD, having the largest amount of jeopardized myocardium of all coronary arteries, is often fatal if unrecognized and untreated. Fortunately, the survival of patients with LMCD is significantly improved by timely revascularization (235). Therefore, rapid and accurate diagnosis of LMCD is critical.
Single-photon emission computed tomography (SPECT) is a conventional tool for the detection of coronary artery disease (CAD) with high diagnostic accuracy, and is widely used in clinical practice (6). Importantly, SPECT has been shown to have powerful predictive value for future cardiovascular events in patients with known or suspected ischemic heart disease (78). Although several features observed in stress tests have been suggested as indicators of the presence of LMCD, such as lung uptake of radiotracers during SPECT (9) and ST-segment elevation in aVR lead during treadmill exercise tests (10), diagnosis of significant LMCD using noninvasive techniques is still challenging (511).
In previous studies assessing the value of SPECT in patients with LMCD, the severity of coronary artery stenosis was usually determined by visual assessment (11011121314). However, visual estimations of stenosis severity by individuals are highly variable and poorly correlated with necropsy findings (1516). Quantitative coronary angiography (QCA) has been shown to improve our ability to more accurately estimate the percent stenosis of a lesion and its length, which contribute to resistance to blood flow (1718). Therefore, this study was performed to investigate characteristic SPECT findings and their relation to QCA results in patients with LMCD, and sought to evaluate the usefulness of SPECT for identifying LMCD in real-world practice.
MATERIALS AND METHODS
Study Patients
This single-center and retrospective study was performed at Boramae Medical Center (Seoul, Korea). The Institutional Review Board of Boramae Medical Center approved this study protocol (IRB No. 16-2014-161). Informed consent was waived due to its retrospective study design. LMCD was defined as ≥ 50% narrowing of the internal diameter of the left main (LM) coronary artery on visual estimation by an interventional cardiologist performing invasive coronary angiography (ICA). Between September 2009 and March 2014, a total of 3480 patients underwent ICA, and 275 (7.9%) were identified to have LMCD in a cardiac catheterization database. From this LM cohort, SPECT was performed on 81 patients within 30 days of ICA, and they were selected for further review. Both ICA and SPECT were performed for the evaluation of CAD. Among these 81 patients, 26 with the following criteria were excluded: 1) those without stress perfusion images (only resting perfusion images were acquired in cases where pharmacological stress was considered a risk to some unstable patients), 2) those with left bundle branch block, 3) those who had undergone coronary bypass graft surgery, 4) those whose images were of insufficient quality to perform QCA, and 5) those with documented ischemic events, including acute myocardial infarction and angina requiring revascularization between SPECT and ICA.
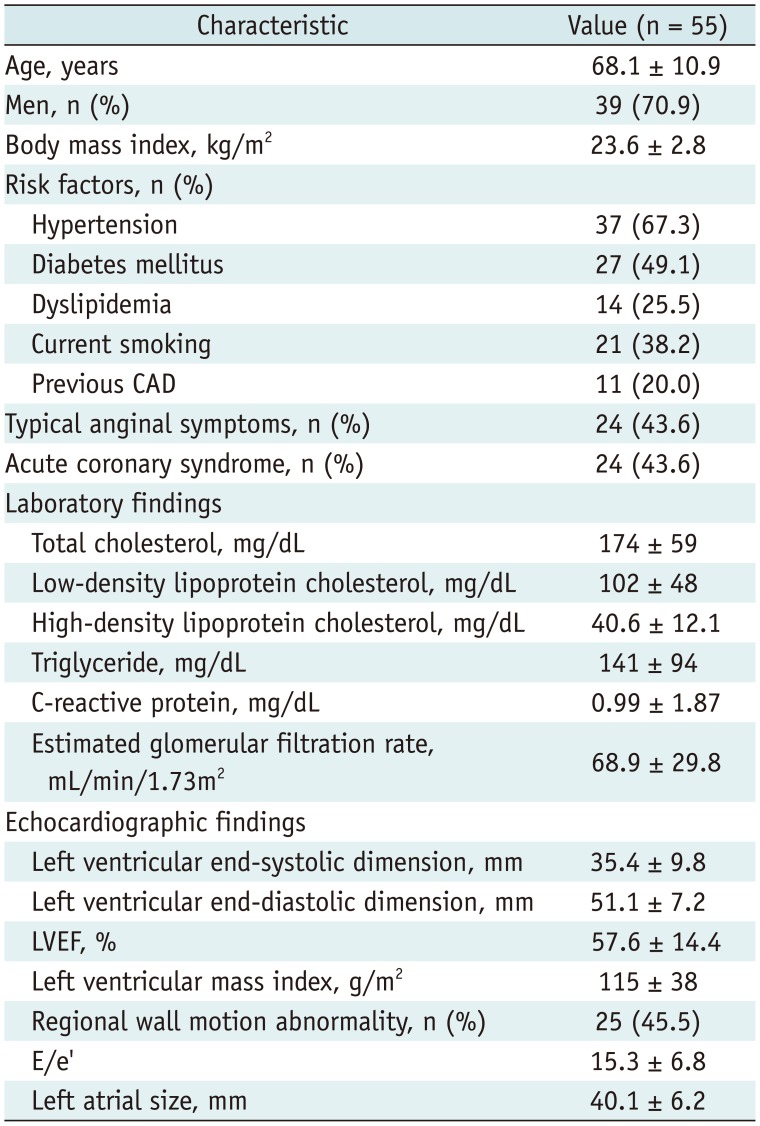
After exclusion, 55 patients fulfilled the criteria and were finally analyzed in this study. We obtained information on demographic characteristics, including age and body mass index (kg/m2), as well as traditional risk factors including histories of hypertension, diabetes mellitus and dyslipidemia. Current smokers were defined as persons who continued to smoke within 12 months of ICA. Previous CAD was defined as previous myocardial infarction or percutaneous coronary intervention (PCI). Typical chest pain was defined as substernal chest discomfort with characteristic quality and duration that is provoked by exertion or emotional stress and is relieved by rest or nitroglycerin (19). The blood levels of total cholesterol, low-density lipoprotein cholesterol, high-density lipoprotein cholesterol and C-reactive protein were measured after overnight fasting for more than 8 hours. The estimated glomerular filtration rate (eGFR) was calculated using the following formula: 175 × serum creatinine-1.154 × age-0.203 (× 0.742, if women) (20). Information on the treatment of LMCD and one-year mortality was obtained by reviewing medical records.
Echocardiography
Transthoracic echocardiography was performed using a 2.5-MHz probe with a commercially available ultrasound system (iE33, Philips Ultrasound, Bothell, WA, USA or Vivid E9, GE Vingmed Ultrasound AS, Horten, Norway) according to the standardized protocol (21). An average of three measurements of consecutive cardiac cycles was taken for analysis. M-mode images from the parasternal short-axis view were obtained to measure left ventricular internal dimensions during systole (LVIDs) and left ventricular internal dimensions during diastole (LVIDd), left ventricular (LV) septal wall thickness during diastole (SWTd), and LV posterior wall thickness during diastole (PWTd). LV mass was calculated using the following formula: LV mass = 0.8 × {1.04 ([LVIDd + PWTd + SWTd]3 - [LVIDd]3)} + 0.6 g, indexed for body surface area (= LV mass index [LVMI]). Simpson's biplane method was employed for the calculation of LV ejection fraction (LVEF). LV diastolic filling was assessed through pulsed-wave Doppler interpretation of mitral inflow velocities. Early peak transmitral filling velocities during early diastole (E) were imaged at the tip of the mitral leaflets from the apical 4-chamber view. With the same view, color-coded tissue Doppler imaging was applied to determine peak early (e') velocity at the septal mitral annuli. E/e' was calculated as an index of LV filling pressure. From the parasternal short-axis view, left atrial dimensions were calculated using M-mode echocardiography.
Myocardial Perfusion SPECT Protocol
Myocardial perfusion SPECT was performed with a 1-day protocol using dual isotopes of 201TI and 99mTc-sestamibi. First, rest SPECT images were acquired 5 minutes after intravenous administration of 201Tl chloride (111 MBq). For the pharmacological stress test, adenosine was continuously injected at a rate of 0.14 mg/kg/min for 6 minutes. After 3 minutes of adenosine infusion, 99mTc-sestamibi (555 MBq) was injected without interruption of continued adenosine infusion, and then stress SPECT images were obtained 2 hours after the 99mTc-sestamibi injection (22). SPECT images were acquired using a dual-headed camera (Infinia Hawkeye 4, General Electric Co., Milwaukee, WI, USA), employing 64 projections over 180° (from right anterior oblique 45° to left posterior oblique 45°), low-energy high-resolution collimator, and step-and-shoot acquisition at 3° intervals and for 25 seconds per step. For dual isotopes, images were obtained with a 20% window centered over both 70 and 167 keV photopeaks for 201Tl chloride, and a 20% window centered over 140 keV photopeak for 99mTc-sestamibi. SPECT images were reconstructed by the filtered back-projection method using a Butterworth filter (cut-off frequency 0.49, order 5) and iterative reconstruction. The reconstructed images were transferred to a designated workstation (Xeleris, General Electric Co.) for interpretation. A SPECT study was repeated when the image quality was suboptimal after scrutiny of the reconstructed images. SPECT images were interpreted by well trained nuclear medicine physicians who were blinded to clinical information in accordance with the recommendation of the American Society of Nuclear Cardiology (22).
Myocardial Perfusion SPECT Analyses
Single-photon emission computed tomography images were automated and processed using Quantitative Perfusion SPECT (QPS)/Quantitative Gated SPECT (QGS) from Cedars-Sinai Cardiac Suite that is included in the designated workstation. Perfusion images were semi-quantitatively analyzed using a 17-segment model (23). In this model, each segment was assigned to vascular region as follows: apex, anterior and anteroseptal segments to the left anterior descending artery (LAD); lateral segments to the left circumflex artery (LCX); inferior and inferoseptal segments to the right coronary artery (RCA) (1124). Each score was rated on a 5-point scale: 0 = normal; 1 = mildly reduced; 2 = moderately reduced; 3 = severely reduced; and 4 = absent uptake. By applying this scoring system to each segment, the cardiac software automatically generated summed stress scores (SSS), summed rest scores (SRS), and summed difference scores (SDS). QPS software computed quantitative perfusion scores of myocardium by integrating the hypoperfusion severities below normal limits in polar map coordinates. Tracers of each segment were displayed in the percentage of perfusion, ranging from 0 to 100 percent. Stress perfusion percent, rest perfusion percent, and the percentage difference (Δ) of the segment of the heart wall have been used to assess myocardial perfusion status.
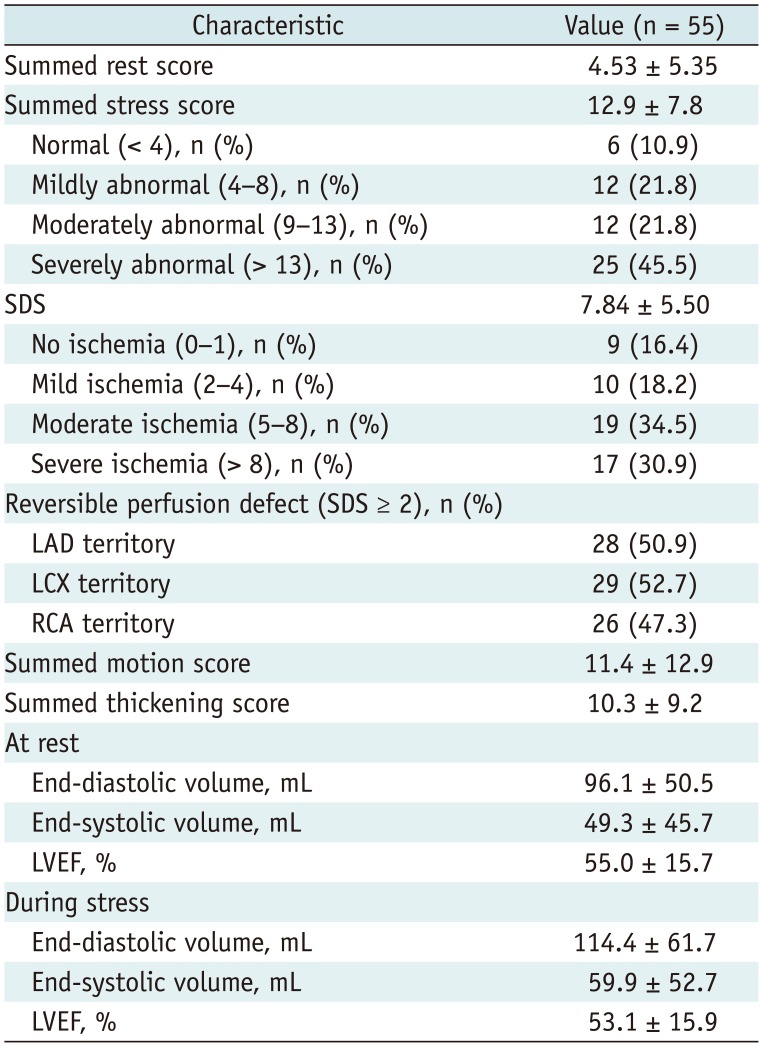
The automatically generated global perfusion scores in numerical form (SRS, SSS, SDS) and perfusion percentage were used for further evaluations. The SRS represents already infarcted myocardium, while the SSS means decreased perfusion of either reversible (ischemic) or irreversible (already infarcted) myocardium. The SDS is thus a measure of reversible (ischemic) hypoperfusion. In this regard, an ischemic perfusion decrease was defined as SDS ≥ 2. The typical LMCD pattern was considered when perfusion abnormality was localized in both LAD and LCX regions on perfusion SPECT (11). Summed motion scores and summed thickening scores were also automatically generated.
QCA Analysis
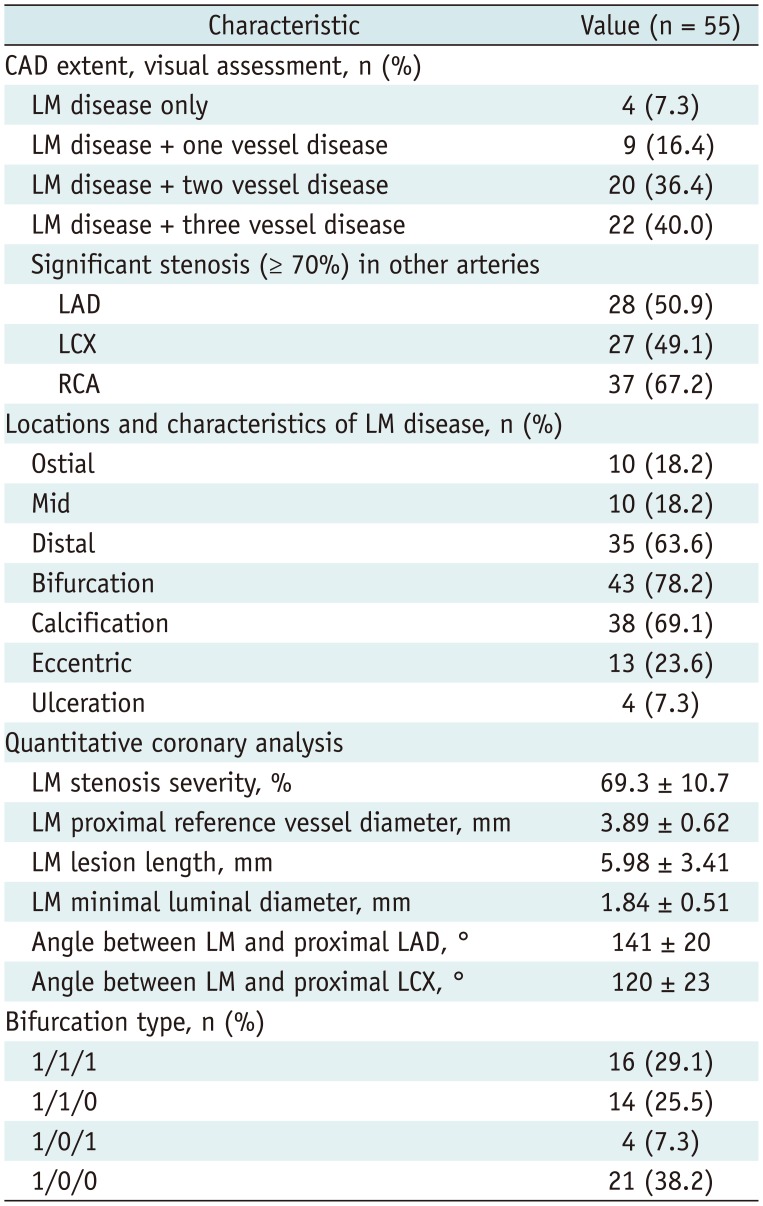
Quantitative coronary angiography analysis was performed by a single experienced observer who was unaware of SPECT findings. During the analysis, diagonal branches were included to the LAD, obtuse marginal braches to the LCX, and the posterior descending and posterior longitudinal arteries to the RCA. Using a guide catheter for calibration and an edge detection system (CAAS 5.9 QCA system, Pie Medical, Maastricht, Netherlands), percent diameter stenosis, reference vessel diameter, lesion length, and minimum luminal diameter were measured. Angles between the LM and the proximal part of the LAD and LCX were also measured. Coronary bifurcation lesions of the LM were classified based on Medina's classification (25). Obstructive CAD (≥ 70% luminal narrowing) distal to the LM and RCA were stratified as 1-, 2- and 3-vessel disease according to the number of coronary arteries involved (12). CAD severity and extent was determined based on this number of obstructed coronary arteries.
Statistical Analysis
Continuous variables were expressed as mean ± standard deviation, whereas categorical variables were presented as absolute values and their proportions. Comparisons between two categorical variables were made using the chi-square test. Pearson's bivariate correlation analysis was used to investigate the linear association between two continuous variables. Scatter plots were used to show the linear association between luminal stenosis and stress perfusion in LAD and LCX territories. A p value of < 0.05 was considered significant. All analyses were performed using SPSS 18.0 statistical package (SPSS Inc., Chicago, IL, USA).
RESULTS
Clinical and Echocardiographic Findings
The median interval between SPECT and ICA was 4 days (interquartile range, 2–9 days). SPECT was performed on 41 patients (74.5%) before ICA. The mean age of the patients was 68.1 ± 10.9 years (range, 37–86 years) and males were predominant (70.9%). About half of the patients (49.1%) had diabetes mellitus, and acute coronary syndrome was diagnosed in 24 patients (43.6%) at the time of initial ICA. Major laboratory parameters were within normal range in study patients. In echocardiographic findings, mean LVEF was within normal range, but LVMI and E/e' were increased. Regional wall motion abnormalities were observed in 25 patients (45.5%) (Table 1).
Angiographic Findings
Only four patients (7.3%) had isolated LMCD, and the others had combined significant stenosis (≥ 70%) of one or more epicardial coronary arteries (Table 2).
Myocardial Perfusion Scores in SPECT
Stress myocardial hypoperfusion was graded by SSS values (26). Normal perfusion with SSS < 4 was observed in 6 (10.9%), mildly abnormal perfusion with SSS of 4–8 in 12 (21.8%), moderately abnormal perfusion with SSS of 9–13 in 12 (21.8%), and severely abnormal perfusion with SSS > 13 in 25 patients (45.5%). Patients with moderate or severe ischemia on SPECT (SSS ≥ 9) had lower renal function (eGFR), lower LVEF and higher LV diastolic filling pressure (E/e') than those with no or mild ischemia on SPECT (SSS < 9) (p < 0.05 for each) (Table 3). In angiographic findings, the presence of significant stenosis (≥ 70%) in LAD and RCA was associated with high ischemic burden (SSS ≥ 9) (p < 0.05 for each) (Supplementary Table 1 in the online-only Data Supplement).
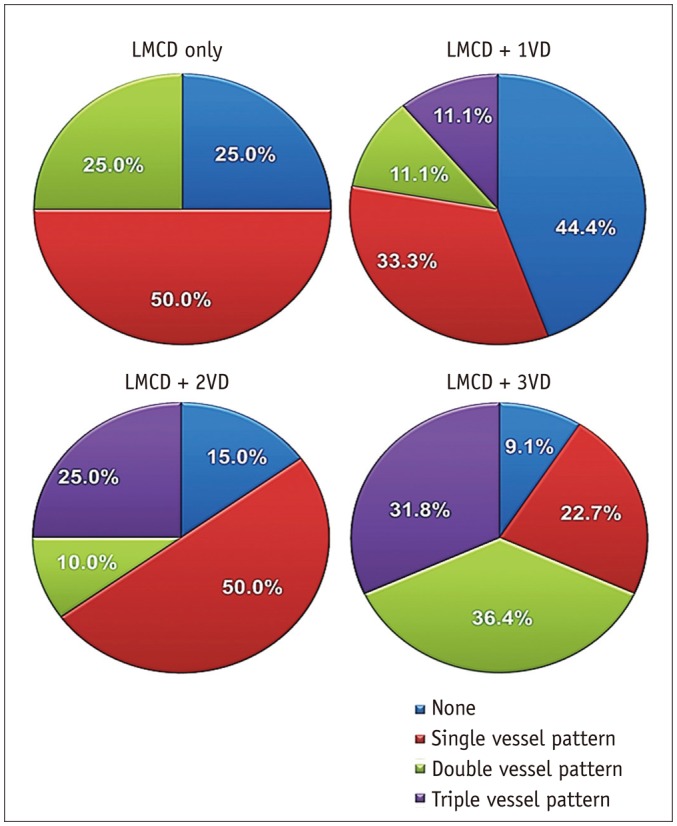
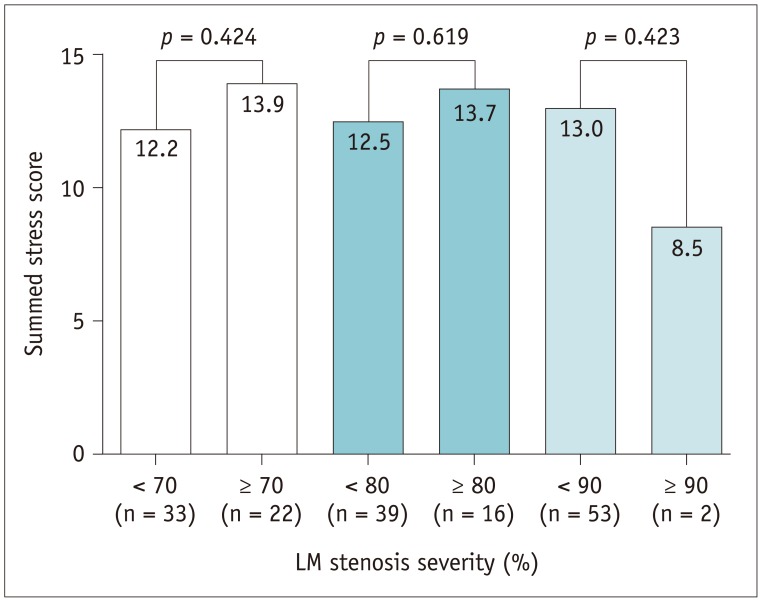
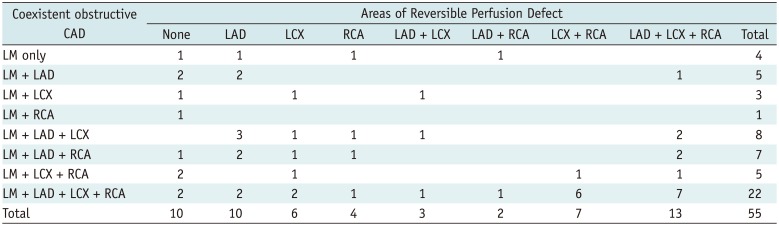
Myocardial ischemia was graded by SDS values. Mild ischemia with SDS of 2–4 was seen in 11 (20.0%), moderate ischemia with SDS of 5–8 in 21 (38.2%), and severe ischemia with SDS > 8 in 18 patients (32.7%). The typical LM pattern that was co-localized in LAD and LCX was found in only 3 patients (5.4%). The distributions of reversible perfusion defect (PD) according to coexistence of obstructive CAD (Table 4, Fig. 1) show that patients with more severe CAD tended to have more severe myocardial ischemia in a greater number of regions, but the specific pattern was not clearly defined. Patients were divided into three groups based on LM stenosis of 70, 80, and 90%, and SSS values were compared: SSS values were not significantly different between these 2 groups (p > 0.05 for each) (Fig. 2).
Myocardial Perfusion Percent in SPECT
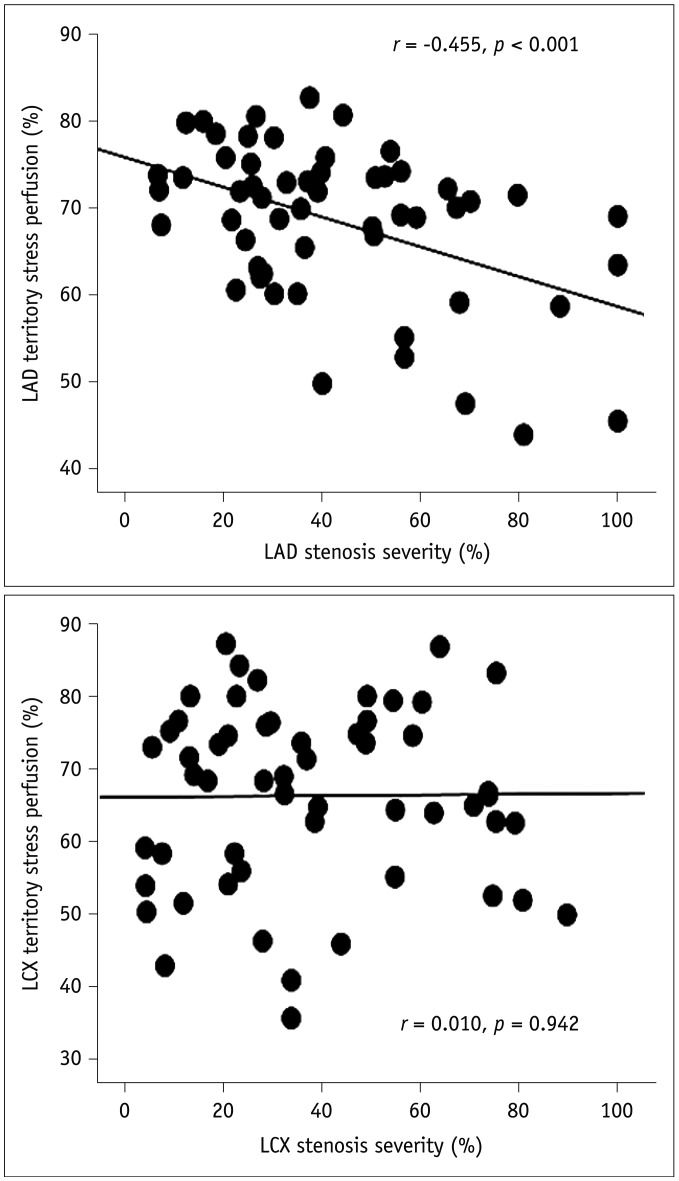
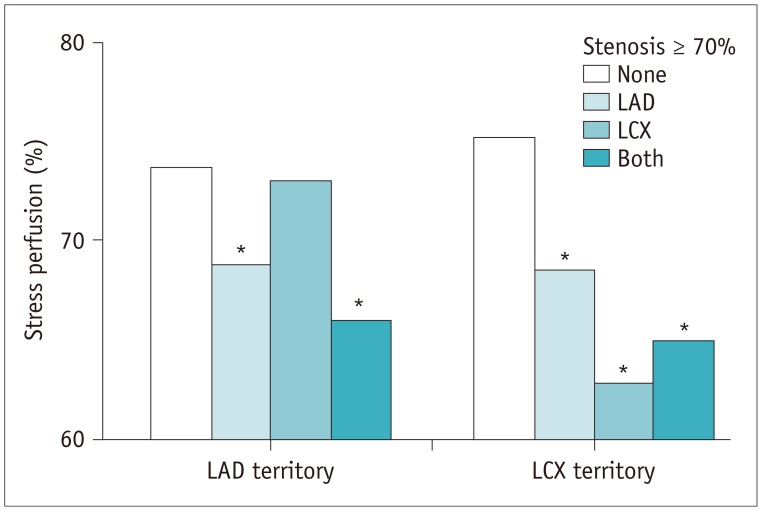
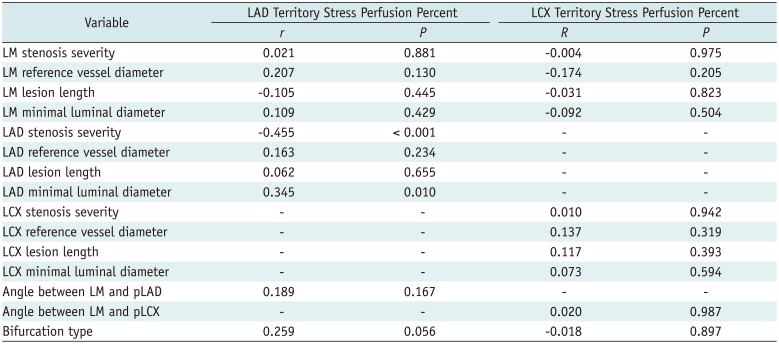
A significant negative linear correlation between stenosis severity and stress perfusion percent was found in the LAD region (r = −0.455, p < 0.001) but not in the LCX region (Fig. 3). Minimal luminal diameter of LAD (r = 0.345, p = 0.010) was also significantly associated with the stress perfusion percent of the LAD region but not in the LCX region. Neither LAD nor LCX of the stress perfusion percent was affected by the bifurcation type or angles between coronary arteries that were assessed by ICA (Table 5). Stress perfusion percent of LAD significantly decreased either in patients with LAD stenosis alone or in patients with LAD and LCX stenoses, but not decreased in patients with LCX stenosis alone. However, stress perfusion percent of LCX decreased, regardless of co-existence of coronary artery stenoses of LCX and LAD (Fig. 4). These results indicate that LAD stress perfusion percent was not affected by LCX stenosis, whereas LCX stress perfusion percent was affected by LAD stenosis.
Clinical Events
Following angiography, 20 patients (36.3%) were treated with PCI, 26 patients (47.2%) were treated with coronary artery bypass graft (CABG), and two patients (3.6%) received both PCI and CABG. Nine patients (16.3%) were treated medically. There were three death cases within one year, two of which were in the medical treatment group, and one was in the CABG group. Patients with events including revascularization and death within one year (n = 45) had significantly higher SSS on SPECT than those without events (n = 10) (14.0 ± 7.9 vs. 7.9 ± 4.6, p = 0.024). Two death cases had severe ischemia on SPECT (SSS values of 32 and 21), and the other death had no ischemia on SPECT (SSS value was 1).
DISCUSSION
The main findings of our study are: 1) isolated LMCD was rare, and the most patients with LMCD had significant stenosis of other coronary arteries; 2) although there was a tendency for more severe CAD with increasing ischemia, SPECT findings were heterogeneous and not specific in LMCD; and 3) LAD stress perfusion percent was correlated with LAD stenosis severity, whereas LCX stress perfusion percent was not correlated with LCX stenosis severity in patients with LMCD.
SPECT Findings in Patients with LMCD
Multiple studies on SPECT findings in patients with LMCD have consistently shown that SPECT imaging has low diagnostic value for the detection of LMCD, and that there are no specific indications of SPECT for LMCD. An earlier study of 43 patients with LMCD by Nygaard et al. (27) showed that typical SPECT findings for LMCD were observed only in 14% of patients. Wakasugi and colleagues analyzed 23 patients with LMCD, and showed that only six patients (26%) had perfusion abnormalities of “LM pattern” (14). A similar finding was reported by Rehn et al. (28), who analyzed SPECT perfusion images of 24 patients with LMCD, and found that only three patients (13%) had a typical LM defect pattern. More recently, Berman et al. (11) studied 101 patients with LMCD, and demonstrated that high-risk disease with moderate to severe defects (> 10% myocardium at stress) was identified in only 56% of patients visually and 59% quantitatively. Afonso and Mahajan (12) investigated 74 patients with LMCD who underwent both ICA and SPECT within six months, and showed that about 20% of patients with LMCD had no reversible PD on SPECT, and that the most frequent SPECT abnormality was one-vessel distribution PD. Similar to the findings cited above, our results showed various patterns of PD on SPECT in patients with LMCD, and a discrepancy between stenosis severity and PD in the LCX region, suggesting limitations to the diagnosis of LMCD using SPECT. As compared to prior studies, we think that our study may deserve greater clinical attention because detailed QCA data were used during study analysis.
In order to improve the diagnostic accuracy of SPECT in LMCD, non-perfusion abnormalities such as transient ischemic dilatation or segmental wall motion abnormalities (1129) and new techniques, such as attenuation-corrected SPECT (13) have been applied for the detection of LMCD. However, their usefulness in clinical practice is still questionable. Indeed, the diagnostic value of non-perfusion abnormalities was limited in our study (data not shown).
Potential Mechanisms
Mechanistic analysis of SPECT findings in LMCD has been difficult due to the small number of study patients with isolated LMCD. Therefore, the exact explanation for various SPECT findings in patients with LMCD unclear. However, discrepancies are often observed between findings of perfusion SPECT and ICA. It has been frequently observed that functional severity is often discordant with anatomical severity (30). A balanced blood flow reduction in all vascular beds without any normal scintigraphic reference segment, called “balanced ischemia,” may also causes false-negative findings on SPECT (111331). Plateauing of tracer uptake at high flow rates also leads to masking of disparities in coronary flow reserve, particularly if vasodilator stress is employed (32). The inferior wall, being subjected to a great degree of soft-tissue attenuation, may affect SPECT findings (32). Although not considered in our study, the presence of collateral circulation may contribute to some discrepancy between angiography and SPECT findings (29). In addition, it is possible that typical perfusion patterns can appear in patients with more severe luminal narrowing of the LM (14). However, there were no reliable patterns of SPECT even in patients with more severe stenosis of LM (≥ 70%) in our study (data not shown).
Obstructive lesions other than LM stenosis might impact myocardial blood flow and perfusion. Rehn et al. (28) pointed out that one difficulty in identifying LMCD by myocardial scintigraphy is because the location and severity of stenosis down-stream, rather than LMCD, determines the perfusion pattern. It has also been reported that PDs in the RCA region may obliterate the presence of defects in the area of the LAD or LCX regions (1). However, RCA stenosis did not impact ischemia or defects in LAD and LCX regions in our study (data not shown). Further investigations are needed to confirm our results and elucidate their mechanism.
Clinical Implication
The diagnosis of LMCD mainly depends on coronary angiography. However, invasiveness and high cost of ICA limit its use in clinical practice. Therefore, many attempts have been made to find a non-invasive method for the identification of LMCD. Although coronary computed tomography angiography (CCTA), an emerging modality, shows high diagnostic accuracy in the detection of CAD, the lack of information on the hemodynamic significance of intermediate stenosis is a main shortcoming of CCTA (33). Several findings of non-invasive functional tests suggest the presence of LMCD or extensive 3-vessel disease exist (19); however, their diagnostic values are still low, and sometimes less practical. In regard to SPECT, its ability to localize coronary regions in patients with LMCD is very poor (1614), and thus, characterization of SPECT findings in patients with LMCD has been problematic. Our study results also support this, and suggest that revascularization should not be determined based entirely on SPECT findings in patients with LMCD. Therefore, further invasive evaluations with other modalities during ICA, such as fractional flow reserve or intravascular ultrasound are needed in clinical practice (734). As a promising noninvasive test, N-13 ammonia PET can be another option aiding the diagnosis of hemodynamic significance of LMCD (35). More accurate and effective diagnostic tools or techniques for the detection of LMCD are warranted.
In our study, only 7.3% of patients had isolated LMCD, and the remaining patients had combined multi-vessel disease. In addition, most of the LMCD patients showed high risk features such as bifurcation and calcification. These results are in agreement with previous findings (311142836), and provide insights into an important clinical issue that we should not focus solely on LM coronary artery stenosis but embrace all these aspects of lesion complexity and co-existing diseases in other coronary arteries in patients with LMCD to adequately manage them.
Study Limitations
In addition to its retrospective design, our study has several limitations. First, there was a possibility that more severe ischemia cases on SPECT underwent ICA, which may have caused referral bias. Second, the number of the study patients is relatively small. Third, the heterogeneous study patients could have led to various patterns of SPECT findings. Further studies with a larger sample size are needed to confirm our results.
 XML Download