

 PDF
PDF ePub
ePub Citation
 Print
Print


INTRODUCTION
Magnetic resonance imaging (MRI) plays a crucial role in the detection of infectious meningitis, especially in situations where a lumbar puncture is contraindicated. Abnormal meningeal enhancement is an important imaging feature that can reliably indicate meningitis. Modifications of T1-based sequences, incorporating fat suppression (FS), and magnetization transfer (MT) led to an improved detection of enhancing meninges compared to the conventional T1-weighted spin-echo (SE) sequence but presented limitations related to the suboptimal differentiation of vascular from meningeal enhancement (12). The nullification of the cerebrospinal fluid (CSF) signal, inconspicuous vascular enhancement as compared to T1-weighted imaging, and some degree of the T1 relaxivity effect, makes meningeal enhancement easily discernible on contrast-enhanced fluid-attenuated inversion recovery (CE-FLAIR) images, but the sequence has still to find a place in routine MRI protocol. The existing literature has compared the CE-FLAIR sequence with either of the two T1-based sequences and has yielded variable results (345678910).
Given that the previous literature comparing the CE-FLAIR sequence with CE T1-weighted (CE-T1W) sequences showed mixed results, the purpose of the present study was to delineate the most optimal MRI sequence for the early detection of infectious meningitis by simultaneous comparison of all three sequences in the same patient using more objective measures. We also tried to explore whether the use of an imaging based grading and scoring system could add incremental value, in suggesting the possible etiology and severity in cases of infectious meningitis.
MATERIALS AND METHODS
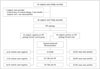
The Institutional Research and Ethical Committee approved this prospective study planned between 2013 and 2015. The study implemented a case-control design. Written informed consent was obtained from all of the subjects. A total of 65 subjects were initially recruited, of which 50 were diagnosed with infectious meningitis, according to the existing guidelines (1). Ten subjects, who were negative for meningitis according to CSF cytology, formed the control group for the study. In addition to the patients with impaired renal function, claustrophobia, and a history of contrast allergy, we also excluded patients who suffered from subarachnoid haemorrhage, stroke and those who had received supplemental oxygen, intravenous gadolinium or iodinated contrast in the previous week. Five subjects were thus excluded for reasons of history of contrast allergy and presence of metallic implants. A flow-diagram following STARD guidelines, that depicts the recruitment of the subjects and the study design is shown in Figure 1. The MR examination was performed on a 1.5 tesla MR System (Magnetom, Siemens, Erlangen, Germany). The MRI protocol included the T1W SE sequence (500/10/58/230 × 256 [repetition time/echo time/echo-train length/matrix]), the T2W SE sequence (3500/87/22/230 × 256), the T1W sequence with MT (1000/13/18/187 × 256), the T1W sequence with FS (556/10/58/230 × 256), the FLAIR sequence (9000/120/7/154 × 256, Turbo factor, 16; TI, 2500 ms; phase resolution, 80; phase oversampling, 30; averages, 1; and signal to noise ratio, 1), susceptibility weighted imaging (54/40/slice thickness 2.5 mm/average 1/flip angle 15/iPAT factor 2/matrix 70 × 256), and diffusion weighted imaging (2500/86/averages 2/b-value 1000 s/mm2/100 × 128). The pulse sequence used for MT consisted of an off-resonance saturation pulse immediately before the 90 degree excitation pulse. The bandwidth of the saturation pulse was 250 Hz, and a frequency offset of 1.5 kHz. All images were acquired in the axial plane with 5-mm slice thickness, 0.5-mm intersection gap and 230 mm field of view. In addition, T2-weighted images were also acquired in sagittal and coronal planes. The CE-FLAIR, T1W sequences with MT and FS were obtained after administration of intravenous gadodiamide (Omniscan, GE Healthcare, Cork, Ireland) in a dose of 0.1 mmol/kg body weight. We randomised the order of administration of the three post contrast sequences to avoid any bias in the quantitative analysis.
Two radiologists, who were blinded to the clinical history and cytological results of subjects, evaluated the images qualitatively and quantitatively. Qualitative assessment included suggesting the grade of meningeal enhancement from 0 to 3 and assigning a score to possibly suggest the etiology on the basis of a newly developed grading and scoring system (Table 1). This newly developed system incorporated grades of meningeal enhancement on the CE-FLAIR sequence and certain imaging features peculiar to various etiologies. The scores obtained by the use of this scoring system, were then analysed for statistical correlation with the patient's Glasgow Coma Score (GCS) at the time of admission.
Quantitative assessment was done using the single pixel signal intensities (SPSI) software. SPSI were obtained from the regions of interest (ROI), of size 1 mm2, in the areas of meningeal and vascular enhancements, by placing a cursor at the same table position, and using customised co-registration software in both the pre and post contrast sequences. The difference of the SPSI in meninges, at basal cisterns and cortical sulci between pre- and post-contrast sequences, was used to calculate the basal and leptomeningeal enhancements. An average of two measurements was taken. To estimate vascular enhancement, the ROI was located at the choroid plexus vessels and the average vascular enhancement was similarly calculated. The above two values were subtracted to obtain the net leptomeningeal enhancement. Statistical correlations were determined between the net meningeal enhancement on all three post-contrast sequences and the laboratory values of the total leukocyte counts (TLC), protein, glucose and adenosine deaminase (ADA) in the CSF.
Statistical Methods
The analysis included profiling patients on a basis of different demographic and etiologic parameters. The qualitative variables were expressed in terms of percentages. We investigated the differences in qualitative assessment on three contrast-enhanced sequences using a one way analysis of variance (ANOVA, single way). Fisher's exact test was performed to test for significance taking two groups at a time. The p value was corrected for multiple comparisons, using the Bonferroni post hoc test. Mean and standard deviation (SD) were calculated for quantitative variables and data were analysed using the Student's t test. The Pearson's correlation was calculated between the net meningeal enhancement and the CSF parameters, to demonstrate the optimal sequence for the evaluation of meningeal inflammation. Inter-observer agreeability for qualitative and quantitative data was determined using Cohen's Kappa and the intra-class correlation coefficient (ICC). Statistical Package for Social Sciences (SPSS) version 20.0 (SPSS Inc., Chicago, IL, USA) was used for analysis. A p value of < 0.05 (with the Bonferroni correction < 0.016) was considered significant.
RESULTS
Sixty patients (32 females and 28 males) participated in this study. The mean age was 27.3 ± 19 (SD) years, ranging from 2 to 91 years. After the MRI examination, each patient underwent a lumbar puncture for CSF analysis. Of the 60 patients, 50 patients had CSF positive meningitis (24 tubercular, 14 viral, and 12 pyogenic). Ten patients, who were negative for meningitis according to CSF cytology, formed the control group.
Qualitative assessment revealed reliable differentiation of meningeal and vascular enhancement on the contrast enhanced FLAIR sequence in all 50 patients. The comparison of statistical parameters of the three post contrast sequences is presented in Table 2. Compared to the T1-based sequences, the CE-FLAIR sequence was found superior in all parameters except for specificity, which was found to be higher for the CE-T1W sequence with FS. The one way ANOVA revealed significant differences between the qualitative assessment of meningeal enhancement on the three contrast-enhanced sequences (p < 0.001). Fisher's exact test revealed significant differences between the detection of meningeal enhancement on the CE-FLAIR sequence compared to the CE-T1W sequences with MT and FS (2 tailed p value < 0.001).
The comparison of the SPSI values of meningeal, vascular and net meningeal enhancement on all the three contrast-enhanced sequences is tabulated in Table 3. The inter-rater agreement for the quantitative assessment was moderate for meningeal (ICC = 0.64) and vascular (ICC = 0.67) signal intensity. A significant difference was found between the net meningeal enhancement on the contrast enhanced FLAIR sequence compared to the magnetization transfer spin echo and the T1 weighted fat saturation sequences (p < 0.001). The Pearson's correlation between the CSF parameters (TLC, Protein, ADA, glucose) and the net meningeal enhancement was found to be stronger for the CE-FLAIR sequence, moderate for the CE-T1W sequence with MT and weak for the CE-T1W sequence with FS (Table 4).
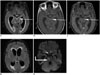
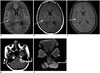
In relation to the CE-FLAIR sequence, the majority of the cases of tubercular meningitis (17/24) showed grade 3 enhancement with median and mean values of 3 and 2.7, respectively. Grade 2 enhancement was seen in 11 patients (n = 12) with pyogenic meningitis with median and mean values of 2 and 1.9, respectively. All of the patients with viral meningitis (14/14) showed grade 1 enhancement (median, 1; mean, 1). Compared to the CE-FLAIR sequence, lower grades of enhancement were seen on the CE-T1W sequences with MT and FS showing statistically significant differences (p < 0.001) (Table 5). Moderate inter-observer agreement was found for all three sequences. The Cohen's Kappa coefficients were 0.56, 0.53, and 0.51 for the CE-FLAIR and the CE-T1W sequences with MT and FS, respectively.
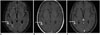
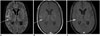
When the scoring system (Table 1) was applied, the average scores in patients of tubercular, pyogenic and viral meningitis were found to be 5.75, 3.3, and 1.0, respectively. A cut-off score of > 5 had a sensitivity of 91.6% and a negative predictive value of 92.8% for tubercular meningitis. The specificity and positive predictive value were 100% as none of the patients other than those with tubercular meningitis had a score of > 5. A score of 1 had 100% sensitivity and 100% negative predictive value for viral meningitis, but the specificity and positive predictive value were 63.6% and 77.8%, respectively. All of the cases of pyogenic meningitis had a score between 2 and 5 (Figs. 2, 3, 4). We could correctly determine the etiology of meningitis in all patients, except for 2 cases of tubercular meningitis, because they had overlapping scores and were falsely diagnosed as pyogenic meningitis (Fig. 5).
The etiopathological indications for infectious meningitis, which were made solely on the basis of the new grading system, revealed an overall diagnostic accuracy of 81.6% and a sensitivity of 84%. Further application of the scoring system enhanced the overall diagnostic accuracy (91.6%) and sensitivity (96%) for the characterization of infectious meningitis. In addition, the assigned scores showed strong inverse Pearson's correlation with patient's GCS at the time of admission (r = -0.95).
DISCUSSION
The importance of the early identification of infectious meningitis cannot be over-emphasized. A properly tailored MRI protocol is vital in demonstrating unequivocal meningeal enhancement, which is by far the most reliable imaging sign for diagnosing meningitis. Since its first use in 1996, the use of the CE-FLAIR sequence in the detection of meningeal enhancement has been a subject of debate and constant criticism, as the FLAIR sequence is limited by artefactual hyperintensity in the posterior fossa due to CSF pulsations and to a lower relaxivity (1356101112131415).
The T1-weighted sequences are routinely used after intravenous gadolinium contrast injection, to evaluate various intracranial pathologies including leptomeningitis. Sequences based on T1-weighting have various limitations, such as excessive vascular enhancement, flat images, and inflow effects (1). The use of an inversion recovery pulse in the FLAIR sequence with an inversion time, considerably reduces the signal from the CSF but at the same time allows the recovery of most of the brain magnetization. This makes it possible to greatly reduce CSF artefact and obtain very heavy T2-weighting through use of long echo times. The FLAIR sequence displays high sensitivity to a wide range of brain diseases, resulting from its capacity to detect subtle changes at the periphery of the cerebral hemispheres, around the basal cisterns, in the brain stem, at grey-white matter interfaces, and in the periventricular region (16). The signal from slow flowing vessels is suppressed by the FLAIR sequence, due to the lack of inflow enhancement phenomenon. Thus, any appreciable linear enhancement in the cortical sulci of the CE-FLAIR sequence, is likely due to enhanced meninges rather than the adjacent enhanced vessels (1).
In the present study, we were able to detect meningeal enhancement in all of the CSF positive cases of the CE-FLAIR sequence (sensitivity 100%), while the sensitivity of contrast enhanced T1-based sequences with MT (72%), and FS (54%), was found to be much lower. The sensitivity, to an extent, also depends upon the criteria used for interpretation. The established criteria of contiguous involvement of 3 or more sulcal spaces for reporting abnormal meningeal enhancement, need not be necessarily applied while using the CE-FLAIR sequence (1). After the CSF correlation analysis, it was found that there were a few cases in which the hyperintense signal was not extending to the contiguous 3 sections, but nonetheless, CSF cytology was suggestive of meningitis. Expectedly, the improved sensitivity led to reduced specificity of the CE-FLAIR sequence (70%), but not to a large extent compared to the 75 to 85 % range reported in the literature (1517). Obviously, the clinical benefits of improved sensitivity, far out-weigh the implications of lower specificity, as it is important to start early treatment in CSF indeterminate cases. The inter-rater agreement between the two readers was found moderate for all three sequences, however it was better for the CE-FLAIR sequence (r = 0.56), compared to the CE-T1W sequence with MT (r = 0.53), and the CE-T1W sequence with FS (r = 0.51). Previous studies using quantitative ROC analysis also had better agreement between observers with the use of the CE-FLAIR sequence (15).
Use of qualitative assessment is subject to intra-observer and inter-observer biases and may have variable interpretations. The assessment of net meningeal enhancement using SPSI is a more quantitative method. Although, SPSI also has some inherent limitations related to the proper application to the ROI, we found it suitable for substantiating qualitative findings in our study. With moderate inter-rater agreement (ICC > 0.60), the net meningeal enhancement of the CE-FLAIR sequence was found to be significantly greater compared than the other T1-based sequences (p < 0.001). Thus, the consistency of the CE-FLAIR sequence in eliminating the vascular enhancement, due to the T2 prolongation effect and the subsequent unequivocal detection of enhancing meninges was re-confirmed (1).
The degree of contrast enhancement in cases of infectious meningitis is related to the disruption of the blood-brain barrier in the inflamed meninges, leading to a leak of gadolinium and inflammatory cells into the CSF space. To assess, the effect of the degree of infiltration of inflammatory cells on the intensity of meningeal enhancement, we thought it prudent to determine the correlation of the net meningeal enhancement (calculated through SPSI) with the CSF parameters: TLC, protein, ADA and glucose. In this regard, the CE-FLAIR sequence correlated strongly and had a more linear relationship with the alterations of the CSF parameters. The elevation in the CSF TLC, ADA and protein led to a quantitative increase in the net meningeal enhancement of the CE-FLAIR sequence, while the CSF glucose concentration had a reverse effect. Compared to the T1-based sequences, the CE-FLAIR sequence is more sensitive to the T1-shortening effect at lower concentrations of leaked gadolinium into the subarachnoid space, and subsequent alteration of the CSF parameters. In addition to shortened relaxivity, the signal intensity on the CE-FLAIR sequence is also improved by the prolongation in T2-relaxation caused by the leakage of inflammatory cells into the subarachnoid space. The effect of leaked inflammatory cells into the CSF space is difficult to detect with other sequences. This makes the CE-FLAIR sequence more suitable for depiction of meningeal inflammation and clinical severity compared to the CE-T1W sequences with MT and FS. Melhem et al. (18), in their study on phantoms which emulated CSF and human volunteers, also suggested better visualization of meninges with the FLAIR sequence compared to the conventional T1W sequence, in pathological conditions that show laboratory evidence of elevated CSF protein concentration. Taoka et al. (19), described the alteration of the CSF parameters as a ‘dirty CSF sign’ and attributed the hyperintensity along the sulcal spaces on unenhanced and post-contrast sequences, to the T1-shortening effect of elevated CSF protein concentration and infiltration of inflammatory cells into the CSF (2021).
The role of imaging has traditionally been limited to the detection of meningitis and its complications (1522). The confirmation of etiology largely relies on the results of the CSF examination. Given the invasiveness of the lumbar puncture, it would be of profound clinical significance if indications of the etiology can be made based on imaging features. The role of the MT MRI in distinguishing tubercular and non-tubercular etiologies based on the mathematical calculation of MT ratios has been discussed previously (412). A visual grading is a much simpler method than the mathematical calculation of MT ratios. Splendiani et al. (23) attempted to distinguish bacterial from viral meningitis based upon different grades of meningeal enhancement, and observed more intense enhancement in cases of bacterial meningitis compared to viral meningitis. In the present study, the grades of meningeal enhancement were more consistent and had better correlation with the etiology. Higher median and mean grades favoured a tubercular etiology (median, 3; mean, 2.7), compared to lower grades in pyogenic (median, 2; mean, 1.9), and viral (median, 1; mean, 1) meningitis. We also tried to use the visual grading method for indications of etiology, but with a limited diagnostic accuracy of 81.6% and a sensitivity of 84%.
A careful review of the literature revealed that certain imaging signs have a propensity to be associated with different etiologies of infectious meningitis (122223242526272829). Certain imaging signs like obstructive hydrocephalus, subdural empyema and basal enhancement, have a propensity to be associated with specific etiologies (11215). This prompted us to formulate a scoring system that consolidated both visual grades of meningeal enhancement and certain imaging features. Compared to the T1-based sequences, the CE-FLAIR sequence was more suited to be used as a baseline sequence for the scoring system as grades of enhancement had better correlation with CSF parameters. The subsequent application of the scoring system for etiopathological indication enhanced the overall diagnostic accuracy (91.6%), and sensitivity (96%). We could correctly determine etiology in all except two patients, in whom a diagnosis of pyogenic meningitis was made instead of tubercular meningitis. The proposed cut-off score of > 5 was diagnostic for tubercular meningitis, while a score of 1 was highly suggestive of viral meningitis. A score between 2 and 5 was equivocal, and was indicative of either tubercular or pyogenic meningitis, with higher scores favouring a tubercular etiology, and lower scores pointing towards pyogenic meningitis. The scoring system had a moderate inter-observer agreement (Cohen's Kappa = 0.56). We could not find any imaging based scoring system in the literature for possible etiopathological indication in infectious meningitis, however a laboratory based scoring system for the triage of suspected cases of meningitis has been tried recently (29).
In the appropriate settings, the GCS is widely used as a standard assessment tool for predicting the outcomes in neurological disorders, including infectious meningitis (30). A strong inverse Pearson's correlation (r = -0.95) between the assigned score and the patient's GCS at the time of admission, suggests the possible role of the FLAIR based scoring system in predicting severity and prognosis in cases of infectious meningitis.
The limitations of the present study were related to the persistence of the CSF pulsation artefacts in a few patients, despite the use of longer TE values. The SPSI analysis is not automated, and exhibits intra and inter-observer variability in the accurate placement of the ROI. Experience in working with software can minimize the effect of these variabilities. The grading and scoring system had only moderate inter-observer agreement, and thus the antecedent role of the scoring system in etiopathological indication and prognostication in cases of infectious meningitis, needs to be validated in different clinical settings with a larger sample and other etiologies, which are not common in our population.
In conclusion, the CE-FLAIR sequence, owing to its higher diagnostic accuracy and stronger correlation with CSF parameters compared to the T1-based sequences, could be included in routine MRI protocol for the early detection of infectious meningitis. The initial results using the FLAIR based scoring system in this study have been encouraging and it may be seen as a viable alternative for determining the etiology and predicting severity in cases with indeterminate CSF results.


 XML Download