

 PDF
PDF ePub
ePub Citation
 Print
Print


INTRODUCTION
Progression of liver fibrosis commonly occurs in almost all cases of chronic liver disease. During the healing process, an excessive amount of protein is deposited in the extracellular matrix, resulting in scarring, that bridges the adjacent portal triads and central veins together, ultimately leading to cirrhosis (12). With long-term, regular and effective therapy, liver fibrosis and cirrhosis may be reversed (3). The clinical practice guidelines on the management of hepatitis advocates that patients with obvious fibrosis should be treated immediately (4). As such, the accurate assessment of liver fibrosis is critical for therapeutic decisions and in determining the prognosis.
Biopsy is the current gold standard for fibrosis, but has the disadvantages of high invasiveness and poor inter- and intra-observer consistency (56). In addition, liver disease is usually non-uniformly distributed, and a biopsy may be limited in sampling errors and determining the disease extent. To date, serum markers and many imaging techniques have been developed for evaluating liver fibrosis noninvasively (789101112131415161718192021). However, serum markers are influenced by numerous factors, and have a low specificity (7). Transient elastography could be widely used for screening fibrosis in clinical practice, but is limited to steatitis, inflammation, and patients who are obese or who have narrow intercostal spaces and ascites (8910). Perfusion CT could be used to detect microcirculatory changes in cirrhosis and help to differentiate low grade fibrosis (1112), but radiation exposure, the use of contrast agents and limited scan coverage range make it impossible to be widely used (13). Liver specific contrast-enhanced magnetic resonance imaging (MRI) could be used to measure hepatocyte function. The enhancement degree and heterogeneity of liver parenchyma on the hepatocyte phase is correlated with the degree of liver fibrosis, but limited to the use of contrast agents and long examination time (141516). Magnetic resonance elastography is an established accurate method for the detection and stratification of liver fibrosis, with accuracy more than 0.9 (1011); however, its use is limited due to high iron overload, portal hypertension, inflammatory activity, and the need for dedicated installation equipment (171819).
T1rho reflects the interactions between motion-restricted water molecules and their local macromolecular environment. Because of its high sensitivity to low frequency motional processes, it can be used to investigate the macromolecular composition of, and proton exchange within, the tissue (222324). Liver fibrosis is the result of the biological deposition of macromolecules. Hence, T1rho MRI may be sufficiently sensitive for evaluating liver fibrosis. Experimental studies in rats concluded that degree of fibrosis correlated with T1rho measurements, and that T1rho MRI can be used to monitor liver injury and fibrosis degrees (252627). Clinical studies with cirrhotic patients achieved similar results, and suggested the potential value of T1rho for assessing cirrhosis without being influenced by necroinflammatory activity, steatosis, and iron load (2829). However, clinical studies with fibrosis patients showed inconsistent results. Singh et al. (30) demonstrated a significant correlation between fibrosis stage and T1rho values. But Takayama et al. (31) found no correlation between liver fibrosis scores and T1rho values. Accordingly, further studies are required to validate the value of T1rho in patients with fibrosis. Additionally, fatty liver, which is becoming a substantial public health burden, can progress to liver fibrosis (32). In all previous studies, only that of Allkemper et al. (29) excluded the potential impact of steatosis on T1rho measurements, although further studies are necessary to minimize bias due to the small number of patients.
Therefore, the purposes of our study were to investigate the potential value of T1rho to detect liver fibrosis, and evaluate whether the presence of fatty liver affects liver T1rho measurements.
Go to : 
MATERIALS AND METHODS
Subjects
This prospective study was approved by our Institutional Review Board. Written informed consent was obtained from all subjects. From July 2015 to March 2016, 58 subjects were scheduled to undergo MRI of the liver. The imaging indications derived from ultrasonic elastography and modified Dixon (mDIXON), assisted the selection of patients in fibrosis and fatty liver group, respectively (3334).
The inclusion criteria for all patients with fibrosis were: 1) serologic evidence of hepatitis B or C virus infection; 2) liver stiffness measurement (LSM) derived from ultrasonic elastography > 6.1 (F ≥ 1) kPa (35); 3) absence of clinical or imaging evidence of liver cirrhosis such as varices, splenomegaly, ascites, or hepatic encephalopathy; 4) no MRI signs of fatty liver (proton density fat fraction [PDFF] derived from mDIXON lower than 5% (34)); and 5) no evidence of other causes of chronic liver disease, like drug abuse and autoimmune disease. All healthy control subjects, and patients with nonalcoholic fatty liver, were recruited from the physical examination department. The inclusion criteria for the normal control subjects were: 1) good health status according to medical history; 2) negative hepatitis B virus or hepatitis C virus findings for chronic viral infection; 3) liver function related laboratory data in normal range; and 4) no MRI signs of chronic liver disease or fatty liver (PDFF derived from mDIXON lower than 5% (34)). Fatty liver group was based on an exclusionary diagnosis, as per the following criteria: 1) evidence of fatty liver diagnosed with ultrasonography within 1 year (diagnostic criteria: a higher echogenicity than those of right kidney's cortex and the spleen's parenchyma (36)); 2) normal aminotransferase during the course of the disease (confirmed once every 3 months); 3) alcohol consumption < 20 g/day in men (< 10 g/day in women); 4) no evidence of other causes of the chronic liver disease, such as hepatitis virus infection, drug abuse and autoimmune disease; and 5) PDFF derived from mDIXON higher than 5% (34). Exclusion criteria for all recruited subjects were: 1) contraindications to MRI and 2) poor image quality.
Finally, 4 subjects were excluded due to the poor image quality. The remaining 54 subjects, including 18 healthy control subjects (13 men, 5 women; age range, 35–74 years; mean age, 51.8 ± 10.3 years), 18 patients (10 men, 8 women; age range, 26–64 years; mean age, 46.7 ± 10.8 years) with clinically diagnosed fatty liver, and 18 patients (13 men, 5 women; age range, 21–63 years; mean age, 41.7 ± 13.4 years) with clinically diagnosed liver fibrosis, were recruited in this study. Demographic data are shown in Table 1.
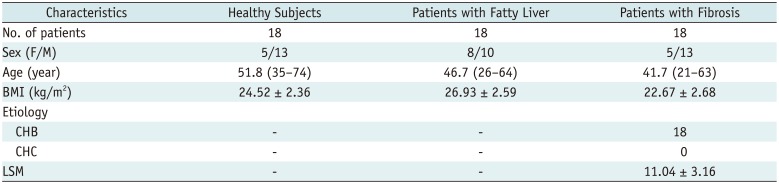
Table 1
Demographic Data of Healthy Control Subjects and Patients with Fatty Liver or Fibrosis
![]()
Imaging Techniques
All 54 subjects underwent examinations on a 3T scanner (Ingenia; Philips Healthcare, Best, the Netherlands), using a multi-transmit radio frequency system. A 16-channel phased-array coil was used as the signal receiver to cover the entire liver, and the in-built body coil was used as the signal transmitter. Subjects were examined head first in the supine position.
For T1rho MRI, eight axial slices were selected to cut through the middle third of the liver. Volume shimming was employed to minimize the B0 inhomogeneity. A rotary echo spin-lock pulse was implemented in a 3D balanced turbo field echo (TFE) sequence (repetition tme [TR]/echo time [TE] = 3.8/1.82 ms, field of view [FOV] = 300 × 360 mm, resolution = 2.5 × 2.81 × 6.00 mm, slice thickness = 6 mm, slice number = 8, number of signal averaging [NSA] = 2, B1max = 11.5 µT, TFE factor = 64). Spin lock frequency was set to 500 Hz, and the times of the spin lock pulse (TSLs) were 1, 10, 20, 30, 40, and 50 ms (37). Spectral pre-saturation inversion recovery was used for fat saturation. A T1rho map was generated on a pixel-by-pixel basis on Philips Research Integrated Development Environment software written in Interactive Data Language, using a mono-exponential decay model: M (TSL) = M0 × exp (-TSL /T1rho), where TSL is time of spin-lock pulse.
For all groups, a six-echo variant of the mDIXON sequence with single breath-hold (TR/TE1 = 4.2/0.95 ms, six echoes with delta TE 0.8 ms, FA = 3°, FOV = 300 × 360 mm, resolution = 2.5 × 2.5 × 3.0 mm, slice thickness = 6 mm, slice number = 40, scan time = 10.2, NSA = 2, and sensitivity encoding [SENSE] factor = 2) were also acquired for the whole liver, to calculate the PDFF and T2* values.
For the fibrosis group, fibroscan examination (FibroScan®; Echosens, Paris, France) was performed to quantify LSM. According to previously described methods, vibration of mild amplitude (1 mm) and low frequency (50 Hz) were transmitted by the transducer, a volume of 1-cm wide and 4-cm long, 25–65 mm below the skin surface were used for LSM measuring (3839). Ten valid measurements were performed on each patient, and greater than 70% success rates were achieved for all recruited patients in this study.
Image Analysis
The data were analyzed by two radiologists independently (having 4 and 2 years of experience in abdominal radiology), blinded to the remaining imaging findings and clinical history. Three representative slices in the upper, middle, and lower liver were selected to quantify liver T1rho, PDFF and T1rho values. Four regions of interest (ROIs; two each on the left and right lobes) were manually placed on the liver parenchyma of the upper and middle slices, and two ROIs (on the right lobe) were manually placed on the liver parenchyma of the lower slice, leading to a total of 10 ROIs from each liver examination. In patients with fatty liver, the ROIs were all placed on the liver parenchyma with fatty change based on the PDFF images. All 10 ROIs were circle-like, approximately 100–200 mm2, excluding artifacts and blood vessels. In all subjects, the ROI size and location in the T1rho, PDFF or T2* images were as similar as possible. The mean value of all ROIs from the measurement of both readers was considered as the liver T1rho, PDFF and T2* value for the subject.
Statistical Analysis
Statistical analysis was performed using SPSS 17.0 (SPSS Inc., Chicago, IL, USA). The mean value of all ROIs from the measurement of both readers was considered for the liver T1rho or PDFF value for the subject. Differences of mean liver T1rho, PDFF and T2* values among healthy control subjects, patients with fatty liver and patients with liver fibrosis were compared by using one-way analysis of variance, followed by Tukey's honestly significant difference post-hoc test. A receiver operating characteristic (ROC) curve analysis was performed to assess the diagnostic performance of mean liver T1rho for predicting liver fibrosis, and its ability to differentiate between subjects with and without liver fibrosis. Pearson's or Spearman's correlation was used to evaluate the relationship between mean liver T1rho values and LSM in fibrosis group, and the possible influence of PDFF, T2* values, subject age, and body mass index (BMI) on mean liver T1rho values in all subjects. Interobserver agreements on mean T1rho, PDFF and T2* measurements were assessed using intraclass correlation coefficient (ICC) as poor (< 0.4), fair to moderate (0.4–0.75) and good (> 0.75). Differences were deemed significant at values of p < 0.05.
Go to :
RESULTS
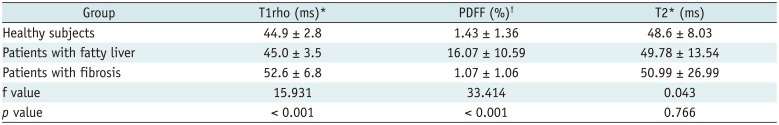
The interobserver agreement for the T1rho, PDFF, and T2* measurements were good (ICC = 0.975, 0.984, 0.954). Mean T1rho and PDFF values were significantly different among the three groups (p < 0.001). Mean T2* values were similar among the three groups (p = 0.766). Mean T1rho values in fibrosis group were significantly higher than those of healthy control subjects and fatty liver group (p < 0.001), and T1rho values of healthy control subjects were similar to those of the fatty liver group (p = 0.999). PDFF values in fatty liver group were significantly higher than those of healthy control subjects and fibrosis group (p < 0.001), and PDFF values were similar between healthy control subjects and fibrosis group (p = 0.984). The results are summarized in Table 2 and Figure 1. T1rho-weighted images and colorcoded T1rho maps that depict typical cases of fibrosis and normal liver are shown in Figures 2 and 3.
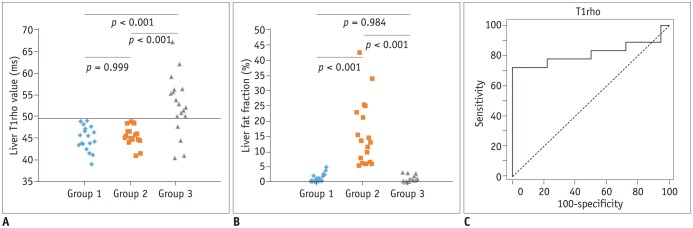 | Fig. 1Liver T1rho value, liver fat fraction comparison among three groups and ROC curve of T1rho for predicting liver fibrosis.
A. T1rho values of group 1 (healthy control subjects) were similar to those of group 2 (patients with simple fatty liver, p = 0.999). T1rho values in group 3 (patients with liver fibrosis) were significantly higher than those of group 1 (p < 0.001) and group 2 (p < 0.001). In group 3, T1rho measurements of 4 patients overlapped with those of group 1 or 2. B. Liver fat fraction of group 1 were similar to those of group 3 (p = 0.984). Liver fat fraction in group 2 were significantly higher than those of group 1 (p < 0.001) and group 3 (p < 0.001). C. According to ROC analysis at threshold of 49.5 ms, sensitivity and specificity of T1rho in predicting liver fibrosis were 77.8% and 100%, respectively. Area under ROC curve was 0.855. ROC = receiver operating characteristic
|
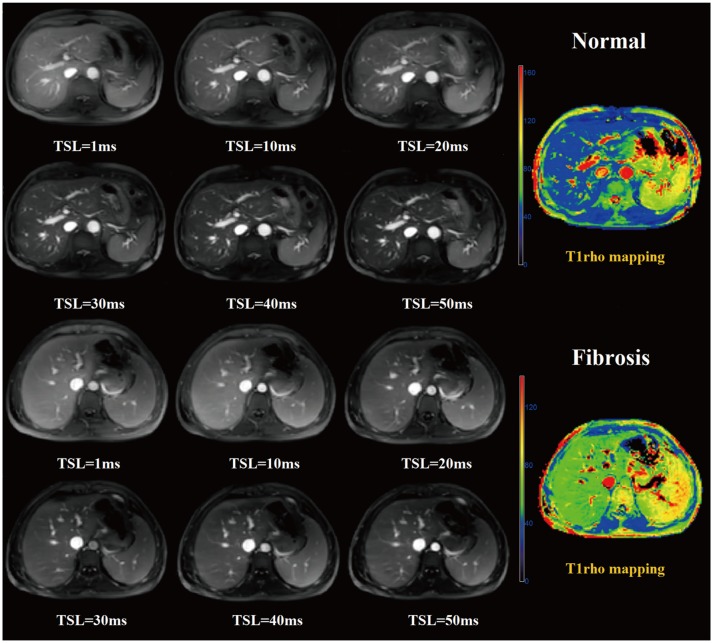 | Fig. 2Examples of healthy subject and fibrosis patient T1rho-weighted images and T1rho map.Upper (row 1 and 2) and lower (row 3 and 4) two rows show liver T1rho-weighted images acquired with times of spin lock pulse (TSL) of 1–50 ms, and T1rho map in 61-year-old normal control subject and 21-year-old patient with fibrosis. Fibrosis liver tissue demonstrates higher signal intensity in T1rho-weighted images and T1rho values in T1rho map, than normal liver tissue.
|
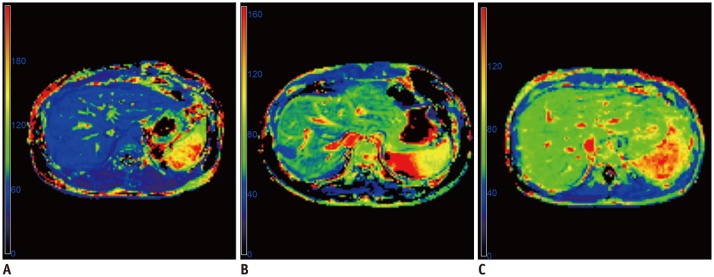 | Fig. 3Example of T1rho map in fibrosis patients with different liver stiffness measurement (LSM).
A. T1rho map in 35-year-old male: mean T1rho value is 50.6 ms, LSM is 7.2 kPa. B. T1rho map in 33-year-old male: mean T1rho value is 54.1 ms, LSM is 10.6 kPa. C. T1rho map in 28-year-old female: mean T1rho value is 62.7 ms, LSM is 17.3 kPa.
|
Table 2
T1rho, PDFF and T2* Comparison among Healthy Control Subjects and Patients with Fatty Liver or Fibrosis
*Mean liver T1rho values in healthy subjects and patients with fatty liver were similar (p = 0.999), and significantly lower than that in patients with liver fibrosis (p < 0.001), †PDFF in normal subjects and patients with liver fibrosis were similar (p = 0.984), and significantly lower than that in patients with fatty liver (p < 0.001). PDFF = proton density fat fraction
![]()
According to the ROC analysis at a threshold of 49.5 ms, the sensitivity and specificity of mean liver T1rho values in predicting liver fibrosis were 77.8% and 100%, respectively. The area under the ROC curve was 0.855. Mean liver T1rho values showed significant positive correlations with LSM in the fibrosis group (r = 0.671, p = 0.012), and no significant correlation with PDFF values (r = −0.259, p = 0.061) and T2* values (r = 0.127, p = 0.241) within all subjects. In addition, there was no significant correlation between subject age (r = −0.339, p = 0.054), BMI (r = 0.066, p = 0.715), and mean liver T1rho values within the healthy control group.
Go to :
DISCUSSION
Our study shows that liver T1rho values were significantly higher in the fibrosis group than those of healthy control subjects, and correlated with LSM derived from fibroscan. These findings highlight the potential value of T1rho for detecting fibrosis, as has been indicated in previous studies (252630). In addition, four individual data points of patients with fibrosis overlapped with those of normal control subjects. A possible explanation may be the absence of pathological results in our study; those patients may indicate no or a slight fibrotic change. Further studies are required to investigate the potential value of T1rho for detecting patients with mild fibrosis. In addition, the signal of blood vessels in T1rho weighted images was high in our study. However, previous studies indicate that the presence of rich blood signals in the liver made T1rho quantification susceptible to motion, black-blood T1rho MRI could mitigate the risk of quantification errors (40) and might diagnose early stage liver fibrosis (41). Hence, the other possible explanation may be the high signal of hepatic blood vessels in T1rho weighted images in our study, which increases the quantification errors. Further studies are needed to compare the diagnostic efficiency of T1rho MRI with and without black-blood techniques for detecting liver fibrosis.
Previous studies showed mean liver T1rho values of healthy subjects ranged from 40.9 ms to 51 ms on 1.5T and 43 ms on 3T (2830374243). In our study, we used 6 TSLs that have been used in most studies, to achieve T1rho images on a 3T MR scanner (3743). Mean T1rho values of healthy subjects (44.9 ± 2.8 ms) was similar to results of a previous study (43.0 ± 2.2 ms) (37), in which the scanner vendor, magnetic field strength and TSL points used for scanning were same as our study. However, mean T1rho values of healthy subjects and of subjects in the fibrosis group in our study (52.6 ± 6.8 ms) were obviously lower than that reported in a study which used a different scanner vendor, magnetic field strength (1.5T) and TSL points (51.0 ± 3.0 ms in healthy subjects, 59.2–69.9 ms in different fibrotic stages) (28). These results indicate that the differences of mean liver T1rho values for the same patient group may be attributed to scanning parameters and scanners. In addition, the characteristics of study subjects in different studies to date have also varied. We cannot determine whether they are confounding factors. In our study, we analyzed the correlation between age and BMI with T1rho values in healthy subjects. Our result did not show a significant correlation with subject age, as indicated in a previous study (28), nor was there a correlation with BMI.
Fatty liver can progress to fibrosis, and patients with fibrosis derived from other factors may also have fatty liver. In our study, we combined mDIXON, which effectively quantifies PDFF with T1rho, to investigate the potential impact of fatty liver on T1rho measurements (34). Liver PDFF in fatty liver group was significantly higher than that of healthy subjects, but the mean liver T1rho values were similar between the two groups. Liver PDFF in fatty liver group was significantly higher than that of fibrosis group, but the mean liver T1rho values in fatty liver group was significantly lower than that of fibrosis group, which is similar to the healthy subjects. In addition, no correlation was observed between PDFF and T1rho values. This result is consistent with that of Allkemper et al. (29), and suggests that the T1rho measurements were not influenced by fatty liver, enabling it to be used in more patients. In our study, T2* values were within the normal range (44), and similar among all three groups, so the possible impact of iron deposition on T1rho measurement was not evaluated.
There were several limitations in the present study. Firstly, no histological evidence of fibrosis and fatty liver was obtained. Thus, in future studies, we will recruit patients with pathological results as much as possible, to evaluate the correlation between pathological results and T1rho measurements. Secondly, although T2* values were measured, the values were in the normal range for all subjects, and the effect of iron overload on T1rho measurement was not evaluated. Thus, in future studies, the potential effects of iron load on T1rho measurements should be investigated. Thirdly, no patients inflicted with both fibrosis and fatty liver, were recruited. Thus, in future, we will recruit such patients as much as possible, to investigate the possible effect of fatty liver on T1rho measurements more accurately. Lastly, our sample size was relatively small. Thus, further studies with a larger sample are needed to identify cut-off values.
In conclusion, our preliminary study showed that T1rho MRI is useful for noninvasive detection of liver fibrosis, and may not be affected with the presence of fatty liver.
Go to :
 XML Download