

 PDF
PDF ePub
ePub Citation
 Print
Print


INTRODUCTION
Acute ischemic stroke (AIS) is a devastating condition with a high rate of neurologic disability and death (1). Intravenous thrombolysis with recombinant tissue-type plasminogen activator has always been viewed as the standardized treatment for AIS within 4.5 hours in the past decade (2). Besides that, several randomized trials have recently reported inspiring results regarding endovascular thrombectomy for treating AIS patients with proximal arterial occlusion (13456). Although recanalization rate has been improved markedly by these methods, one quarter of AIS patients cannot benefit from existing therapeutic approaches (7). Incomplete reperfusion secondary to downstream microvascular thrombosis has been pointed out as the potential culprit (8).
Previous studies have found that leukocytes and platelets can adhere to endothelial cells in post-capillary micro-vessels immediately after arterial recanalization using intravital imaging techniques, thus contributing to microvascular obstruction (910). Thrombogenesis in micro-vessels downstream of the initial occlusion site might be responsible for incomplete reperfusion despite successful proximal recanalization (8). Meanwhile, one previous study has found that CD40/CD40 ligand (CD40L) signaling axis plays an important role in thrombogenesis in micro-vessels (9). It has been suggested that serum soluble CD40L (sCD40L) level could be used as an effective indicator of microvascular thrombosis after AIS onset (9). Considering the association of sCD40L level with downstream microvascular thrombosis, sCD40L might be a potential prognostic biomarker of AIS stroke patients after effective treatment. It might serve a crucial role in the establishment of individual treatment plan and doctor-patient communication. However, examining sCD40L level is complicated. It is not available in the emergency section of most hospitals at the setting of AIS. Therefore, finding a simple and effective alternative method is urgently needed.
Intravoxel incoherent motion (IVIM) magnetic resonance (MR) imaging initially introduced by Le Bihan et al. has be proven to be useful for assessing diffusion and perfusion change of acute and sub-acute stroke patients (111213141516). Different from the traditional dynamic susceptibility contrast-enhanced (DSC) perfusion MR imaging technique, IVIM imaging is intrinsically local. It is independent of precerebral effects such as cervical artery stenosis and cardiac output (1516). Due to its unique theoretical mechanism, IVIM imaging may characterize tissue perfusion at microvascular level (16). Considering the tight connection between IVIM imaging and hemodynamic changes in micro-vessels, we hypothesized that IVIM imaging derived quantitative metrics could serve as an imaging marker of serum sCD40L and subsequent emergence of microvascular thrombosis.
Therefore, the aim of our study was to determine the relationship between IVIM imaging derived quantitative metrics and serum sCD40L level in an embolic canine middle cerebral artery occlusion (MCAO) model.
Go to : 
MATERIALS AND METHODS
Middle Cerebral Artery Occlusion Model Establishment
Experimental protocols were reviewed and approved by our Institutional Animal Care and Use Committee (Nanjing Medical University, Nanjing, China). A total of 24 adult healthy beagle dogs of either sex weighting 14.6 ± 0.8 kg were anesthetized by intravenous injection of 3 mg/kg of pentobarbital (pentobarbital sodium salt, Chemical Reagent Company, Shanghai, China). MCAO models were established using method described previously (1718). Briefly, a 5 Fr vertebral catheter (Terumo Medical Corporation, Somerset, NJ, USA) was firstly inserted into the left internal carotid artery (ICA) about two centimeters in the ascending part. A prepared white autologous clot (about 1.7 mm in diameter and 5 mm in length) was then injected into the left proximal MCA. After successful embolization was confirmed by angiography, the 5 Fr vertebral catheter was retained in the ascending part of left ICA to block blood flow for 2 hours. These animals were then transported to the MR center for imaging studies.
MR Imaging Acquisition
Magnetic resonance imaging scan was performed at 4.5 hours after model establishment in dogs at supine position with a 3T MR (Magnetom Trio, Siemens Healthcare, Erlangen, Germany) using an 8-channel transmit-receive extremity coil. Our imaging protocol included T2-weighted fluid attenuated inversion recovery imaging (repetition time/echo time [TR/TE], 8000/97 ms; inversion time, 2300 ms; slice thickness, 2.0 mm without gap; field of view, 22 × 18 cm; matrix, 320 × 320), three-dimensional time-of-flight MR angiography (TR/TE, 20/3.4 ms; field of view, 20 × 15 cm; flip angle, 15 degrees; matrix, 384 × 384; 118 transverse images with section thickness of 0.52 mm, in-plane resolution, 0.52 × 0.52 × 0.52 mm), and IVIM imaging.
Intravoxel incoherent motion imaging was performed in coronal plane using a single-shot, spin-echo, echo-planar imaging sequence in three orthogonal directions with 10 different b values (0, 50, 100, 150, 200, 250, 300, 500, 700, 900 s/mm2). Other parameters were set as follows: TR/TE, 5500/97 ms; slice thickness, 2 mm without gap; field of view, 20 × 15 cm; and matrix, 192 × 192. Total scan time of IVIM imaging was 9 minutes and 13 seconds. After MR examination, all animals were recovered and kept in the animal facility for other studies.
Image Processing
Intravoxel incoherent motion imaging data were transferred from a picture archiving and communication system workstation to an independent personal computer. They were processed with a dedicated software package (FireVoxel; CAI2R, New York University, New York, NY, USA) (19). A bi-exponential model was implemented for IVIM fitting. The relationship between signal variation and b value in an IVIM-type sequence was expressed with the following equation (19):
Sb / S0 = (1 − f) × e−bD + f × e−bD*
Where Sb was the mean signal intensity with a gradient sensitivity factor b and S0 was the signal intensity without diffusion. D was the diffusion coefficient representing true molecular diffusion. D* was pseudodiffusion coefficient describing water molecule motion in the capillary network and f was perfusion fraction representing the fraction of incoherent signal from the vascular compartment in each voxel over the total incoherent signal.
Two-step approach proposed by Kim et al. (20) was used to generate IVIM metrics. In the first step, D was extracted using high b values and a monoexponential model because D* contribution could be neglected at high b value (> 200 s/mm2). In the second step, D* and f were extracted using a nonlinear regression for all b values while keeping D as a fixed parameter.
Image Analysis
Whole-lesion regions of interest (ROIs) were manually identified in the ischemic core with conspicuous hyperintensity on diffusion-weighted images (b900 map). Areas with slightly increased signal intensity around the periphery of ischemic core, cerebrospinal fluid area, and large vessels were excluded. Apparent diffusion coefficient (ADC) maps were used as references to avoid T2 shine-through effect. After ROIs were placed, corresponding parametric maps (D, D*, f) were automatically generated. To calculate normalized IVIM metrics, mirror ROIs were placed in the contralateral hemisphere followed by manually correction when necessary. Normalized metrics of stroke lesions were calculated using the following formula: Normalized D = Dstroke / Dcontralateral. Approximately eight minutes were needed to process IVIM imaging data for one experimental animal.
Two neuroradiologists (both with 5 years of experience) performed ROI placements to evaluate inter-reader reproducibility. In addition, all measurements were repeated again by the initial neuro-radiologist at an interval of at least one month to evaluate intra-reader reproducibility. Average value of the two measurements of the initial neuroradiologist was used for subsequent statistical analysis.
Measurements of Serum sCD40L Level
All measurements of serum sCD40L levels were performed using enzyme-linked immune-sorbent assay kit (catalogue number MBS742245, MyBioSource, San Diego, CA, USA) by a laboratory personnel blinded to the study status. Each sample was repeatedly tested three times. Results of three measurements were averaged for further analyses.
Statistical Analysis
All continuous variables were presented as mean ± standard deviation. Normality was tested using Kolmogorov-Smirnov test. Differences in IVIM metrics between ischemic and contralateral hemisphere were compared using paired t test. According to the median of serum sCD40L level, experimental animals were divided into low- and high-sCD40L groups. Differences of IVIM metrics between the low- and high-sCD40L groups were compared using independent sample t test. Receiver operating characteristic (ROC) curves were used to determine the cut-off value of significant IVIM metrics in identifying high-sCD40L level. Pearson's correlation analyses were performed to evaluate the relationship between IVIM metrics and serum sCD40L level. Inter- and intra-reader variability of measurements of IVIM metrics were analyzed using intra-class correlation coefficient (ICC) of two-way random model with 95% confidence intervals (21). The ICC ranged between 0 and 1.00, with values closer to 1.00 representing better reproducibility. The ICC was interpreted as follows: r < 0.20, poor; r = 0.21–0.40, fair; r = 0.41–0.60, moderate; r = 0.61–0.80, good; and r ≥ 0.81, excellent. Statistical analyses were performed using a statistical package (SPSS version 20.0, IBM Corp., Armonk, NY, USA). Two-sided p value of less than 0.05 indicated statistical significance.
Go to :
RESULTS
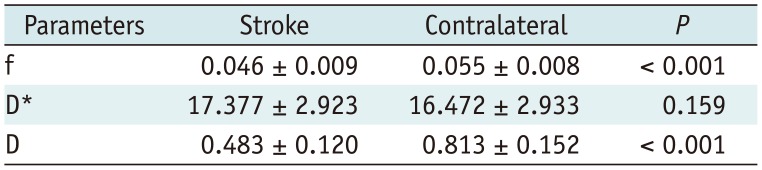
Middle cerebral artery occlusion models were established successfully in all 24 beagle dogs. The average of serum sCD40L level at 4.5 hours after model establishment was 80.43 ± 15.03 ng/mL (Table 1). At 4.5 hours after model establishment, the f and D values of ischemic lesions were significantly lower than those of contralateral normal regions (f, p < 0.001; D, p < 0.001) (Table 1). However, there was no significant (p = 0.159) difference in D* value between ischemic lesions and contralateral normal regions (Fig. 1). Colored parametric maps derived from conventional diffusion-weighted image and IVIM of a representative animal are showed in Figure 2.
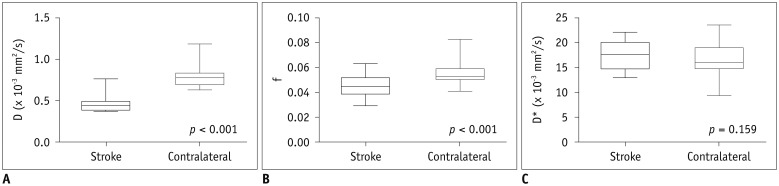 | Fig. 1Box-and-whisker plots of IVIM metrics of stroke lesion and contralateral hemisphere at 4.5 hours after model establishment.Values of D (A) and f (B) of ischemic lesions were significantly lower than those of contralateral hemisphere at 4.5 hours after model establishment, while D*
(C) values was not significantly different between ischemic lesions and contralateral hemisphere. D = diffusion coefficient, D* = pseudodiffusion coefficient, f = perfusion fraction, IVIM = intravoxel incoherent motion
|
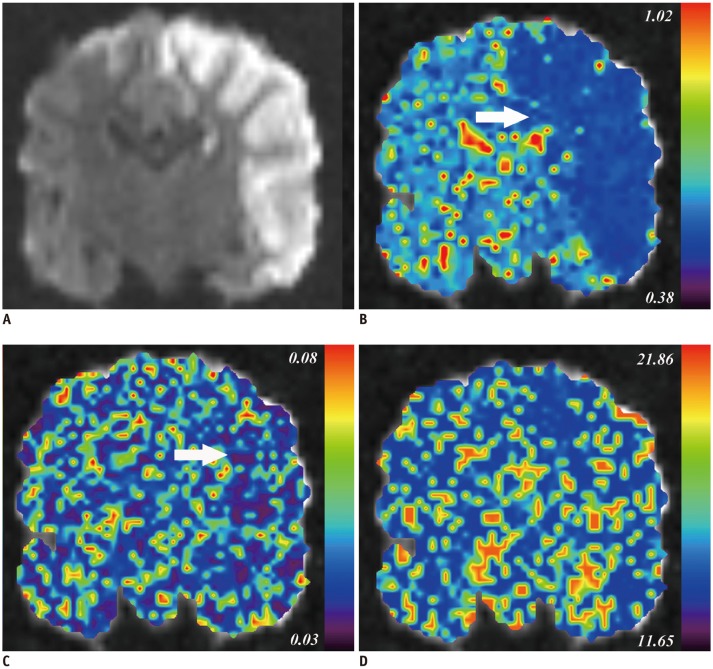 | Fig. 2IVIM imaging derived parametric maps of representative beagle dog at 4.5 hours after model establishment.
A. Hyperintensity stroke lesion can be recognized on coronal diffusion weighted image (b900 map). B, C. IVIM imaging derived D (B) and f map (C) show visual diffusion and perfusion changes (arrows) in stroke areas compared to those in contralateral hemisphere. D. There was no change in D* map. Corresponding f, D*, and D values of stroke lesions and contralateral normal hemisphere are: f, 0.047 and 0.047; D*, 17.890 × 10⁻³ and 15.022 × 10⁻³ mm2/s; D, 0.394 × 10⁻³ and 0.692 × 10⁻³ mm2/s. Serum sCD40L of this animal was at 68.59 ng/mL. sCD40L = soluble CD40 ligand
|
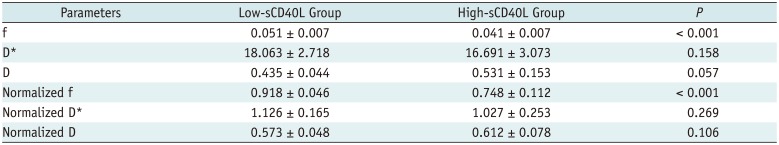
Based on the median of serum sCD40L level, experimental animals were divided into low- and high-sCD40L groups. Results of absolute and normalized IVIM metrics of the low- and high-sCD40L groups are summarized in Table 2. The highs-CD40L group showed significantly lower f and normalized f values than the low-sCD40L group (f, p < 0.001; normalized f, p < 0.001). However, there was no significant difference in D*, normalized D*, D, or normalized D value between the two groups (D*, p = 0.158; normalized D*, p = 0.269; D, p = 0.057; normalized D, p = 0.106) (Fig. 3).
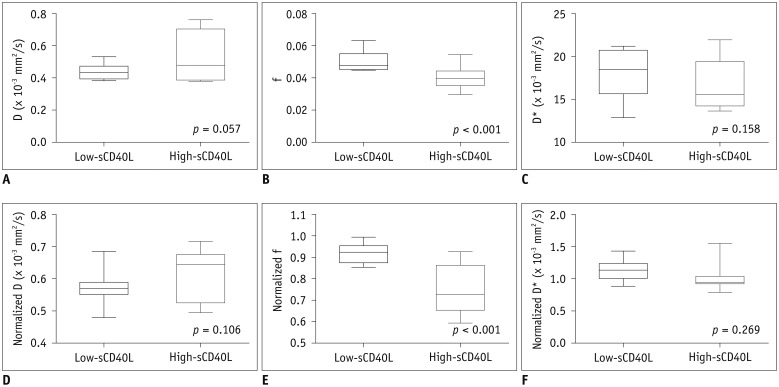 | Fig. 3Box-and-whisker plots of absolute (A-C) and normalized (D-F) IVIM metrics between low- and high-sCD40L groups at 4.5 hours after model establishment.High-sCD40L group showed significantly lower f (B) and normalized f (E) values than low-sCD40L group. However, there was no significant difference in D*
(C), normalized D*
(F), D (A), or normalized D (D) value between two groups.
|
Table 2
Comparison of IVIM Metrics between Low- and High-sCD40L Groups
![]()
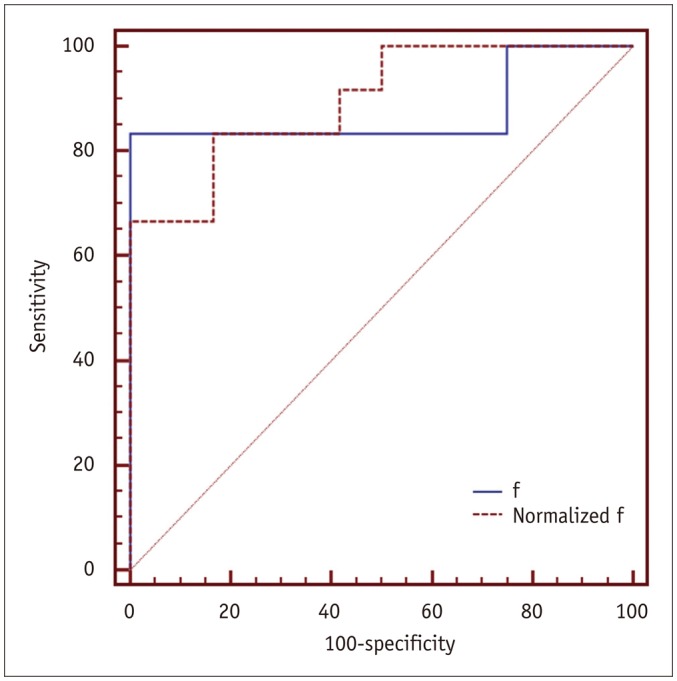
Results of ROC analyses indicated that cut-off value of f ≤ 0.044 had optimal performance in identifying the high-sCD40L group (sensitivity, 83.3%; specificity, 100%; area under the curve, 0.875). Cut-off value of normalized f ≤ 0.746 had optimal performance in identifying the high-sCD40L group (sensitivity, 66.7%; specificity, 100%; area under the curve, 0.896) (Fig. 4).
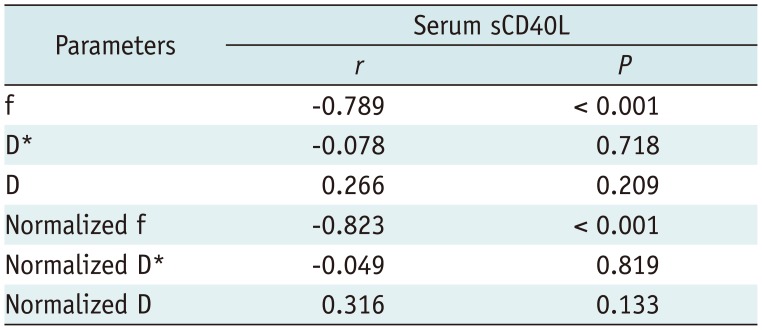
Results of Pearson correlation analyses were summarized in Table 3. Both f and normalized f values had significant correlation with serum sCD40L level (f, r = −0.789, p < 0.001; normalized f, r = −0.823, p < 0.001). However, serum sCD40L level had no significant correlation with D*, normalized D*, D, or normalized D (D*, r = −0.078, p = 0.718; normalized D*, r = −0.049, p = 0.819; D, r = 0.266, p = 0.209; normalized D, r = 0.316, p = 0.133) (Fig. 5).
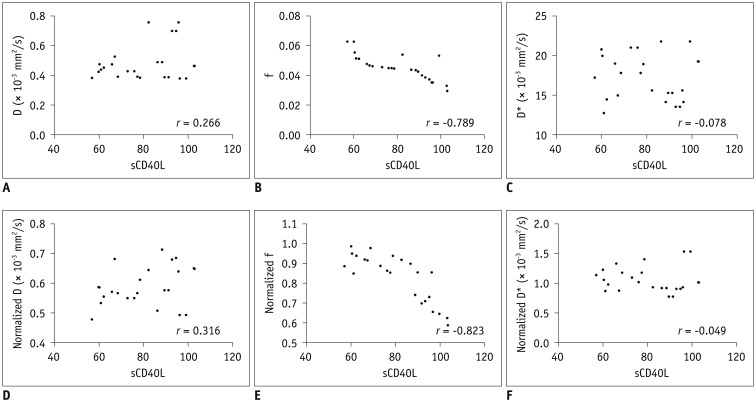 | Fig. 5Scatter plots showing correlation between IVIM metrics and serum sCD40L level at 4.5 hours after model establishment.f (B) and normalized f (E) values were negatively correlated with serum sCD40L level, whereas D (A), normalized D (D), D*
(C), and normalized D*
(F) values did not have any significant correlation with serum sCD40L level.
|
Excellent inter- and intra-reader agreements were obtained for quantitative measurements of IVIM metrics (ICCs: 0.911 and 0.952 for D, 0.819 and 0.907 for D*, 0.856 and 0.931 for f, 0.909 and 0.948 for normalized D, 0.806 and 0.899 for normalized D*, and 0.849 and 0.925 for normalized f) (Table 4).
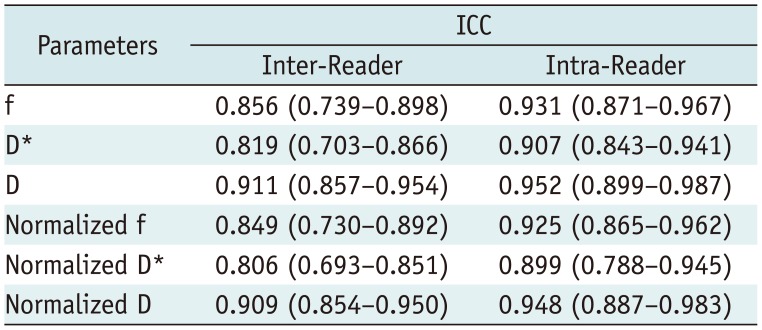
Table 4
Inter- and Intra-Reader Agreements of Measurements of IVIM Metrics
![]()
Go to :
DISCUSSION
Intravoxel incoherent motion MR imaging was first introduced by Le Bihan et al. as a method to simultaneously measure perfusion and diffusion. With IVIM theory, three quantitative parameters could be obtained: D (diffusion coefficient representing true molecular diffusion), D* (pseudo-diffusion coefficient representing macroscopic incoherent motion of blood in the microvasculature compartment), and f (perfusion fraction representing the fraction of incoherent signal from the vascular compartment in each voxel over the total incoherent signal) (21). Previously, DSC perfusion imaging was most commonly used to evaluate tissue perfusion. However, its usage was limited for particular patients because contrast media was needed. Since IVIM MR imaging could also measure tissue perfusion without using contrast media, several studies have tried to evaluate the relationship between IVIM and DSC perfusion imaging (1322). However, study results remain controversial. Federau et al. (13) have proposed that f is significantly correlated with cerebral blood volume while D* is inversely correlated with mean transit time. By contrast, Bisdas et al. (22) have insisted that there is no clear or evident link between the two imaging modalities (IVIM and DSC perfusion imaging). Our results were in agreement with those of Suh et al. (23). Although some studies have revealed significant correlations between IVIM and DSC perfusion imaging, the two imaging techniques might characterize tissue perfusion at different scales and reflect different histological meanings due to their distinct theoretical mechanisms (16). DSC perfusion imaging mainly characterizes tissue macro-vascular perfusion and reflects vascular density whereas IVIM MR imaging principally describes micro-vascular perfusion and reflects blood flow in small vessels.
Several previous studies have evaluated the feasibility of using IVIM imaging to characterize brain perfusion and diffusion properties for clinical stroke patients (1213141516). After analyzing IVIM imaging data of 101 acute and subacute stroke patients, Suo et al. (16) have found that both D and f values of stroke lesions are significantly lower than those of contralateral hemisphere. In this study, we forwarded the study period to the hyperacute phase and acquired similar results. Our study further confirmed that the noninvasive IVIM imaging could be used to assess perfusion and diffusion changes of stroke patients within each stroke period.
As mentioned above, IVIM MR imaging mainly measures microscopic translational motion associated with microcirculation of the blood (24), making it difficult to understand our findings. The more serum sCD40L is generated, the more microvascular thrombosis will form. Subsequently, incoherent flow signal arising from micro-vessels will decrease, leading to decreased f value inevitably. Therefore, it was not surprising that serum sCD40L level was negatively correlated with f value in our study.
D* value also describes the incoherent movement of blood macroscopically in the microvasculature compartment (20). Theoretically, the high-sCD40L group should have lower D* values than the low-sCD40L group and D* value should be inversely correlated with serum sCD40L level. However, neither significant difference in D* value between the high-sCD40L and low-sCD40L groups nor correlation between D* and serum sCD40L level was found. This might be due to the lower reproducibility of D* value. Andreou et al. (25) have found that the measurement reproducibility for D* value was worse than that for f value in colorectal liver metastases. In a study with healthy volunteers, Federau et al. (26) have found that D* value is dependent on the cardiac cycle and that D* value is significantly larger during systole than that during diastole. Similarly, Wu et al. (27) have reported that D* value could be overestimated by 300%. Therefore, D* value should be interpreted with caution. All these above-mentioned studies could likely explain the no significant difference in D* value between the high-sCD40L and low-sCD40L groups and the no significant correlation between D* and serum sCD40L level found in this study.
This study has some limitations. First, the sample size of our animal study was limited. Second, we only investigated the correlation between IVIM MR imaging derived metrics and serum sCD40L levels for the hyperacute period. Although our results revealed that the metrics in the hyperacute period were crucial for timely and individual treatment, we should admit that expanding our experiment to acute, subacute, and chronic period would be more meaningful. Third, imaging and clinical follow up were lacking in this study. Such follow up could help confirm the significance between IVIM and sCD40L. Further clinical studies are needed to clarify the relationship between IVIM parameters, serum sCD40L level, and clinical outcome of stroke patients after effective treatment. Fourth, the number of b value used for IVIM imaging was limited, especially for b values less than 200 s/mm2. For ischemic lesion characterized by low perfusion, IVIM imaging with limited number of b value might be prone to small error.
In conclusion, we demonstrated the feasibility of using IVIM MR imaging to assess serum sCD40L levels under the setting of hyper-AIS. Our study results indicated that f value derived from IVIM MR imaging was well correlated with serum sCD40L level, suggesting that f value might serve as a potential imaging biomarker for the formation of microvascular thrombosis after stroke onset.
Go to :
 XML Download