

 PDF
PDF ePub
ePub Citation
 Print
Print


INTRODUCTION
In the adult population, the prevalence of gallbladder (GB) polyps is approximately 5%. These lesions are often detected incidentally on computed tomography (CT) scans or ultrasonography (US) imaging (1). Along with the increasing routine medical check-ups and technical improvements in diagnostic imaging, the detection of GB polyps is becoming more frequent (2). GB polyps are classified into neoplastic polyps (adenomas and adenocarcinomas) and non-neoplastic polyps (cholesterol polyps and inflammatory polyps) (3). Although most GB polyps are benign cholesterol polyps, current guidelines recommend the surgical removal of GB polyps larger than 1 cm, based on their higher probability of malignancy (45). However, this approach not only imposes unnecessary anxiety on patients, but also places significant socioeconomic burden on the community (5). Unfortunately, none of the conventional imaging modalities, including US, CT, magnetic resonance imaging, and endoscopic US (EUS), can accurately differentiate neoplastic from non-neoplastic polyps in the GB (2).
Photoacoustic (PA) imaging is a novel imaging technique having clinical potential in real-time functional imaging. In PA imaging, a pulsed laser illuminates a biologic sample, and the light energy is deposited in the tissue leading to a transient temperature increase and thermoelastic expansion, inducing ultrasound waves (i.e., PA signals) (67). Although very weak in intensity, the PA signals can be collected using commercial US transducers (6). In contrast to conventional optical imaging, PA imaging is not limited by the light diffusion; instead, it is determined by spatial resolution and tissue penetration by ultrasound (68). Additionally, unlike US in which the contrast depends on the acoustic impedance mismatch between different tissues, PA imaging determines tissue contrast by the optical absorption, and not by the mechanical and elastic properties of the tissue, thereby providing greater tissue differentiation and specificity than US (9). Along with this unique advantage, PA imaging technology has been applied to various medical fields, including the detection of breast microcalcifications (1011), differentiation between benign and malignant lesions of the thyroid glands (1213), and sentinel lymph node imaging (14). Because PA imaging is a real-time imaging modality with high spatial and contrast resolutions, it may also play an alternative role in the diagnosis of GB polyps.
Thus, the purpose of this study was to investigate the feasibility of ex vivo multispectral PA imaging in differentiating cholesterol versus neoplastic polyps, and benign versus malignant polyps in the GB.
MATERIALS AND METHODS
Study Population
Our Institutional Review Board approved this prospective study, and written informed consent was obtained from all patients. Initially, a total of 50 patients who underwent cholecystectomy at our institution from April 2014 to May 2015, were admitted to the study. Two patients with adenomyomatous hyperplasia and intraductal papillary mucinous neoplasm were excluded. An additional group of 10 patients whose specimens were inadequate to obtain PA signal, were excluded during specimen preparation. Finally, 38 patients (mean age, 55.7 ± 16.6; range, 29–89 years) constituted our study population, including 17 men (mean age, 56.4 ± 18.6; range, 29–89 years) and 21 women (mean age, 55.1 ± 15.2; range, 30–84 years). All patients were clinically scheduled for surgery due to GB polyps detected on US or EUS. Among the 38 patients, 30 patients underwent laparoscopic cholecystectomy, 2 patients underwent open cholecystectomy, 5 patients underwent extended cholecystectomy, and 1 patient underwent pancreaticoduodenectomy. A portion of each polyp was spared for the measurement of PA signal, and pathological examination of the remaining surgical specimen confirmed the resected polyps as cholesterol polyps (n = 24), adenomas (n = 4), and adenocarcinomas (n = 10).
Measurement of the Photoacoustic Signal
The experimental arrangement of the PA and US imaging data acquisition system was assembled similar to our previous experiments (1011). The specimens were fixed on a scatter-free gel pad (Aquaflex, Parker Lab, Inc., Fairfield, NJ, USA), which was then immersed in a 0.9% saline-filled container. The temperature of the container was maintained at 24℃. To obtain PA signals from the specimens, radiofrequency echo data were acquired using a US transducer equipped with a SonixTouch research package (Ultrasonix Corp., Vancouver, Canada) and a 7-MHz linear array (L14-5/38) connected to a SonixDAQ parallel system (Ultrasonix Corp.). The Q-switch trigger of a Nd:YAG laser excitation system (Surelite III-10 and Surelite OPO Plus, Continuum Inc., Santa Clara, CA, USA) was then sent to a SonixTouch research package at a pulse repetition of 10 Hz. Laser was delivered by a custom bifurcated optic fiber bundle, and optical fluency was focused at 30 mm depth from the array transducer (Fiberoptic Systems, Inc., Simi Valley, CA, USA). The energy density of the laser was fixed at approximately 19 mJ/cm2 during the experiment, to satisfy the regulation of the ANSI Z136 radiation safety limit of 20 mJ/cm2. By referring the Q-switch trigger, scanline data were stored in the dedicated acquisition system. The laser pulse length was 7 ns, and its wavelength was controlled by a software program on a personal computer. The distance between the US transducer and the specimen was 30 mm, which was longer than the transducer's elevational focal depth of 16 mm. The researchers performing all experimental procedures were blinded to the clinical information and pathologic results of the specimens.
Data Analysis
The PA intensities of the polyps were measured for two separate wavelength intervals: 421–647 and 692–917 nm. The PA spectrum acquired at each wavelength interval was normalized separately, by dividing the PA intensity at each wavelength by the peak PA intensity in the interval. The normalized PA intensities were compared between cholesterol polyps and neoplastic polyps (including adenomas and adenocarcinomas), benign polyps (including cholesterol polyps and adenomas) and malignant polyps (adenocarcinomas), and cholesterol polyps, adenomas, and adenocarcinomas. The wavelengths showing the peak PA intensity and maximum intensity difference were also identified in each group.
The Kruskal-Wallis test assessed the differences in the mean normalized PA intensities among the three groups, followed by the Dunn-Bonferroni test for pairwise comparisons. The Mann-Whitney U test was performed to compare the normalized PA intensities between two groups (cholesterol vs. neoplastic polyps, and benign vs. malignant polyps). Statistical analyses were performed using SPSS version 19.0 (SPSS Inc., Chicago, IL, USA). A p value of < 0.05 was considered to indicate a significant difference.
RESULTS
Study Population Characteristics
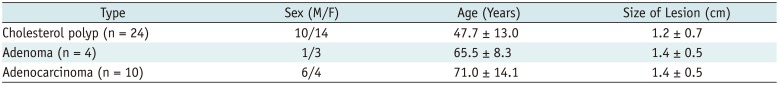
The patients with cholesterol polyps (median age, 50 years; range, 29–81 years) were younger than those with adenocarcinomas (median age, 74 years; range, 45–89 years). In addition, the median size of the cholesterol polyps (median size, 1.0 cm; range, 0.3–2.8 cm) was smaller than that of the adenocarcinomas (median size, 2.2 cm; range, 2.0–2.7 cm). Table 1 summarizes the comparison of the study population characteristics between cholesterol polyps, adenomas, and adenocarcinomas.
Comparison of the PA Intensities of the Cholesterol Polyps and the Neoplastic Polyps
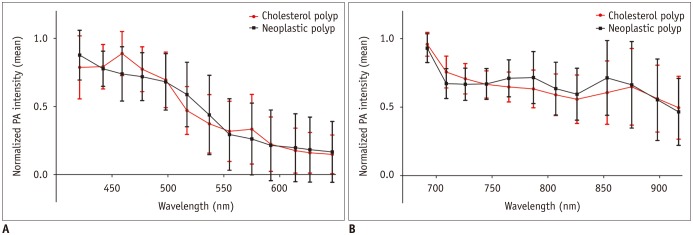
At shorter wavelengths between 421 and 647 nm, the normalized PA intensity of the cholesterol polyps peaked at 459 nm, with a mean value of 0.89 ± 0.16. The peak intensity of the neoplastic polyps was measured at 421 nm, with a mean value of 0.88 ± 0.18 (Fig. 1A). At longer wavelength intervals between 692 and 917 nm, both the cholesterol polyps and the neoplastic polyps showed peak intensities at 692 nm, with a mean normalized PA intensity of 0.96 ± 0.87 in the cholesterol polyps and 0.93 ± 0.10 in the neoplastic polyps (Fig. 1B). The maximum difference was 0.15 at 459 nm, where a significant difference was observed in the normalized PA intensities between the cholesterol and neoplastic polyps (median, 1.00 vs. 0.73; p = 0.032).
Comparison of the PA Intensities of Benign Polyps and Malignant Polyps
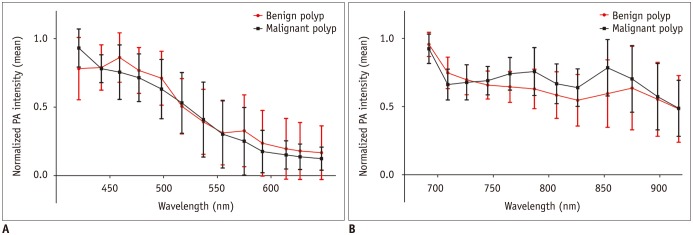
When normalized PA intensities of the benign and malignant polyps were compared, the peak intensity of the benign polyps was measured at 459 nm with a mean value of 0.86 ± 0.18 at the shorter wavelength interval. The normalized PA intensity of the malignant polyps peaked at 421 nm with a mean value of 0.93 ± 0.14 (Fig. 2A). At the longer wavelength interval, the peak intensity of both polyps was measured at 692 nm, with a mean normalized PA intensity for benign polyps being 0.96 ± 0.09, and for malignant polyps being 0.92 ± 0.11 (Fig. 2B).
The Mann-Whitney U test revealed significant differences in the normalized PA intensities between the benign and malignant polyps at 765 nm (median, 0.67 vs. 0.78; p = 0.013), 787 nm (median, 0.65 vs. 0.77; p = 0.034), and 853 nm (median, 0.59 vs. 0.85; p = 0.028) at the longer wavelength intervals. However, there was no significant difference in the normalized PA intensities in the shorter wavelength intervals between the two groups, with maximum difference being 0.18 at 853 nm (Fig. 2).
Comparison of the PA Intensities of the Cholesterol Polyps, Adenomas, and Adenocarcinomas
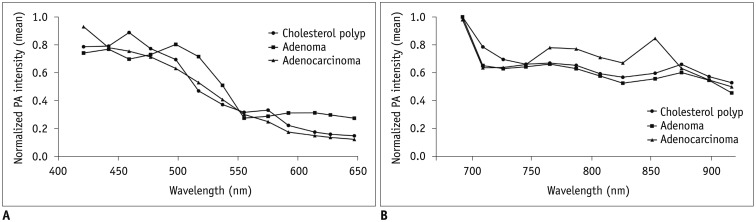
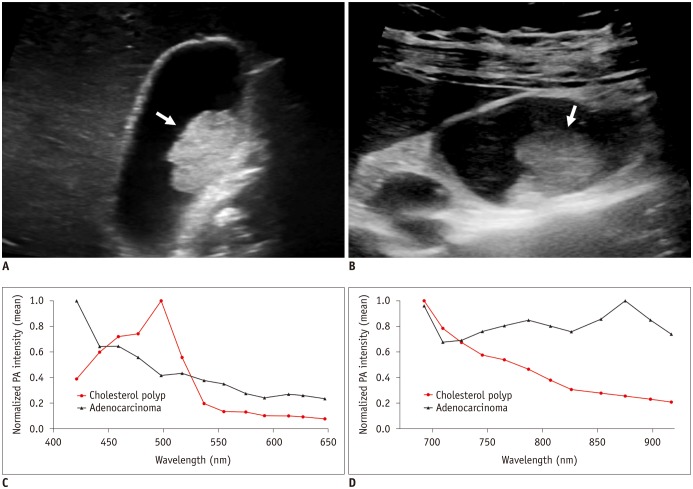
The comparison of the normalized PA intensities among the cholesterol polyps, adenomas, and adenocarcinomas using the Kruskal-Wallis test demonstrated that there was marginal significance in their differences at 765 nm (median, 0.67 vs. 0.66 vs. 0.78; p = 0.049). The results of a post hoc test using the Dunn-Bonferroni method showed that the normalized PA intensities of the adenocarcinomas were higher than those of the cholesterol polyps at 765 nm, but the statistical significance was marginal (median, 0.78 vs. 0.67; p = 0.049) (Fig. 3). Representative cases are shown in Figure 4.
DISCUSSION
The differential diagnosis between non-neoplastic and neoplastic polyps is important for the clinical management of patients with GB polyps. The majority of GB polyps are non-neoplastic, such as cholesterol polyps, and these lesions do not require resection (1). Rarely, however, these lesions may be neoplastic, and the primary concern is their ability to transform into malignant lesions (4). Because of the extremely poor prognosis of GB cancer, accurate differentiation between benign and malignant polyps is essential (15). According to current guidelines based on size criteria, surgical removal is recommended for polyps greater than 10 mm, and US follow-up is recommended for polyps smaller than 10 mm (416). Consequently, cholesterol polyps larger than 10 mm and neoplastic polyps smaller than 10 mm could be misdiagnosed (1).
Advances in diagnostic imaging have steadily increased the sensitivity of the detection of GB polyps. However, until now, there have been no available imaging modalities that reliably distinguish polypoid GB lesions or predict the presence of malignancy. US is the most common method for diagnosis of GB polyps (17), but there are limitations in using US for differentiation of neoplastic polyps from non-neoplastic polyps due to their similar echogenicity and morphology (181920). Other imaging modalities such as CT have also been used to examine GB polyps; however, CT has its limitations since it cannot be used to clearly depict the shape and internal features of small lesions, and the differential diagnosis remains difficult in many cases (212223).
Several studies on novel US techniques have been conducted to overcome the shortcomings of conventional US imaging. Teber et al. (24) evaluated the feasibility of using real-time US elastography for GB polyps, and found that benign GB polyps had a high-strain elastographic pattern. In the studies using real-time contrast-enhanced (CE) EUS, GB adenomas showed homogeneous enhancement patterns, in contrast to cholesterol polyps which show heterogeneous enhancement patterns (1). Malignant lesions showed rapid washout features after contrast agent administration on CE US (25).
To the best of our knowledge, this is the first study utilizing PA imaging for the evaluation of GB polyps. In the present study, benign and malignant polyps exhibited different PA characteristics. Malignant polyps had significantly higher PA intensities at the wavelengths of 765, 787, and 853 nm, compared to benign polyps. The maximum intensity difference between the two groups was obtained at 853 nm. Based on the known absorption spectra of biologic tissues, the wavelengths of 760 and 850 nm represent deoxyhemoglobin (Hb) and oxyhemoglobin (HbO2), respectively (1326). According to a previous study, intratumoral vessels are more frequently observed in malignant GB polyps than in benign polyps on CE US. Additionally, the pathologic examination of GB carcinoma demonstrates more abundant vascularity compared with benign polyps (27). Based on the results, it is possible that the higher tissue Hb and HbO2 levels associated with high vascularity in malignant lesions may affect the optical absorption properties of tissues at this interval.
Cholesterol polyps result from abnormal deposits of triglycerides, cholesterol precursors, and cholesterol esters in macrophages in the GB wall (28). In contrast, GB adenomas and adenocarcinomas are epithelial tumors composed of cells resembling biliary epithelium. We hypothesized that these histopathological differences of the two lesions produce different PA spectral patterns. However, in this study, there were no significant differences in the normalized PA intensities between the two groups. Because of the abundance of C-H bonds and low water content compared with other soft tissue, lipid absorbs strongly at the near infrared wavelength range (approximately 1720 nm) (2930). Further investigations at this infrared spectral region are required, to precisely determine the optical absorption of lipid-rich tissues.
Our study has several limitations. First, our sample size is relatively small, as it is a preliminary study on the use of PA imaging of GB polyps. Therefore, further studies with larger sample sizes are necessary. Second, because this is an ex vivo study with surgical specimens, the practical application might still be limited, especially due to the relatively thick abdominal wall that PA waves need to pass through. However, PA imaging has a major advantage over existing optical modalities in optically scattering tissue, even when the imaging depth is beyond the optical mean free path (631). As an example, PA imaging of the human breast has recently been achieved with satisfactory spatial resolution at a depth of up to 5 cm from the skin surface (32). Further studies with a sophisticated PA transducer using an endoscopic probe might further facilitate its in vivo use.
In conclusion, malignant and benign GB polyps show distinguishable PA spectral patterns. The preliminary results of this ex vivo study indicate that multispectral PA imaging can be used for differentiating malignant from benign GB polyps.
 XML Download