

 PDF
PDF ePub
ePub Citation
 Print
Print


INTRODUCTION
Despite a significant decrease in its incidence over the last several decades, stomach cancer remains a major health issue worldwide (12). Most patients present with locally advanced or metastatic disease, requiring palliative treatment such as combination chemotherapy. However, despite the well-known benefits of combination chemotherapy, the prognosis of metastatic gastric cancer still remains dismal, with a reported 5-year survival of approximately 5% (23). Hence, new treatments showing acceptable toxicity profiles are strongly required.
Trastuzumab (Herceptin®, F Hoffmann-La Roche Ltd., Basel, Switzerland), a monoclonal antibody to human epidermal growth factor receptor 2 (HER2; also known as ERBB2), specifically blocks the HER2 protein on the surface of some cancer cells, inhibiting the HER2-mediated intracellular signaling (4). Studies in breast cancers have shown that trastuzumab provides a survival benefit in patients with early as well as metastatic HER2-positive breast cancer, and has therefore become the standard of treatment (567). In patients with metastatic breast cancer, high levels of HER2-protein expression or gene amplification have been demonstrated to predict better outcomes with trastuzumab (6). Similar to breast cancer, HER2 may also be an important biomarker and key driver of tumorigenesis in gastric cancer (8910). Several studies indicate that there is HER2-protein overexpression or gene amplification in 7–34% of gastric cancers (8910). Furthermore, trastuzumab has recently been shown to improve the prognosis of HER2-positive advanced gastric cancer (AGC) (11). Moreover, in AGC patients, trastuzumab in combination with 5-fluorouracil or capecitabine plus cisplatin has demonstrated a significantly higher response rate, resulting in longer survival than chemotherapy alone (11). Therefore, HER2 expression is prognostic for treatment with trastuzumab in AGC as well as in breast carcinoma (11).
Although gastroscopic or liver biopsy are regarded as the gold standards for identification of HER2 expression status in unresectable gastric cancer, limitations arising due to sampling error, small sample size, long waiting time for immunohistochemistry (IHC) results, as well as biopsyrelated complications, exist (12). Therefore, efforts are ongoing to overcome these limitations through alternative methods. Since multidetector computed tomography (MDCT) with gastric distention has been a choice of modality in the evaluation of primary gastric tumor extent and distant metastasis (13), MDCT may be the most appropriate complementary tool to endoscopy. Even though there has been a study regarding MRI prediction of HER2 status in gastric cancers (14), to our knowledge, no studies have attempted to correlate CT features with molecular findings in gastric cancers. Identification of phenotype-genotype associations has great potential for the development of an imaging-based therapeutic strategy in gastric cancer patients. Therefore, the purpose of this study was to retrospectively analyze qualitative CT features that correlate with the HER2 expression status in pathologically proven unresectable gastric cancers.
MATERIALS AND METHODS
This retrospective study was approved by the Institutional Review Board of our institute, and the requirement for informed consent was waived.
Patients
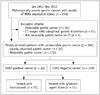
Between January 2011 and December 2012, a total of 276 patients with pathologically proven gastric cancers and results of HER2 expression status, were selected from our pathology database. Among them, we included patients who fulfilled the following criteria: 1) patients who had locally advanced (T4b) or metastatic gastric cancer (M1) on histopathology or imaging studies, 2) patients who had CT images with optimal gastric distension, 3) patients whose primary gastric lesions were detectable on axial scans of CT images, and 4) patients whose results of HER2 expression were not questionable. We only included patients with locally advanced or metastatic gastric cancer (unresectable gastric cancer) because the HER2 status is critically important in these patients, and since chemotherapy, including targeted therapy, can be used in patients with unresectable gastric cancer. We excluded 95 patients as they had resectable gastric cancers (n = 83), CT images with suboptimal gastric distention (primary cancer cannot be clearly differentiated from adjacent gastric wall [n = 11]), and had primary gastric lesions that were not detectable (n = 1). There were no patients in whom the results of HER2 status were questionable. Thus, finally 181 patients with locally advanced (n = 37) and/or metastatic (n = 172) gastric cancers were included in our study population (Fig. 1). There were 138 men and 43 women, and their mean age was 60.6 ± 13.3 years (age range, 22–95 years). Patients were divided into two groups according to their HER2 expression status: HER2-positive and negative groups. For determining the HER2 positivity, IHC for HER2 overexpression and fluorescence in-situ hybridization (FISH) for gene amplification were used (15). In IHC for HER2 overexpression, anti-HER2 antibody (A0485, DAKO, Carpinteria, CA, USA) was applied for 10 minutes, and antibody binding was detected using an avidin-biotinperoxidase complex (Universal Elite ABC Kit, Vectastain, Burlingame, CA, USA). HER2 immunostaining was scored using the instructions in the DAKO HercepTest kit, as follows: score 0, no membrane staining or membrane staining in < 10% of tumor cells; score 1+, faint/barely perceptible partial membrane staining in ≥ 10% of tumor cells; score 2+, weak to moderate staining of the entire membrane in ≥ 10% of tumor cells; and score 3+, strong staining of the entire membrane in ≥ 10% of tumor cells. Scores of 0 and 1+ were considered negative for HER2 overexpression, and a score of 3+ was considered positive. For patients with score 2+, FISH test using dual-color Vysis kits (Vysis, Downers Grove, IL, USA) were used to clarify the HER2-status (15). A HER2:CEP17 (centromeric probe 17) ratio of ≥ 2 was defined as positive for HER2 amplification (11).
Clinical and Histologic Features
The clinical and histologic features were reviewed by one author (having 5 years of experience) using electronic medical records (EMR) of our hospital. For each patient, the type of treatment for both primary and metastatic tumors, and palliative anti-cancer treatment regimen including cytotoxic chemotherapeutic agents and HER2-directed therapy, were collected. Any surgery undergone was also analyzed. Clinical outcomes included the current status of the patient (dead or alive) and survival days after the initial diagnosis of metastatic gastric cancers. Overall followup survival data was completed by reviewing our hospital EMR, as well as contacting the Resident Service Division of the Ministry of Public Administration and Security. The endpoints of this study were either demise of the patient, or status on October 6, 2015. For histologic analysis, location of the tumor and results of HER2 expression were recorded.
CT Techniques
This retrospective study used various CT scanners. All patients with locally advanced or metastatic gastric cancers underwent MDCT with one of 4, 8, 16, 64, 128, or 320 detector-rows, either at our institution (n = 123) or at an outside hospital (n = 58). The parameters used for these MDCTs were as follows: detector collimation, 0.63–1 mm; tube voltage, 120 kVp; tube current, 150–250 mAs; pitch, 0.89–1.35; rotation time, 0.5–0.75 seconds; slice thickness, 2.5–5 mm; and reconstruction interval, 2–5 mm. Among the 181 patients, 108 patients (59.7%) underwent stomach protocol CT with gastric distension, with ingestion of either one pack of an effervescent agent (n = 103) or > 1 liter of water (n = 5). The remaining 73 patients underwent dynamic-enhanced CT after ingestion of 500 mL of water (12). In most patients (n = 138, 76.2%), 3D coronal and/or sagittal multiplanar reconstruction images as well as transverse images were reconstructed, and were used for CT image analysis.
For the contrast-enhanced CT study, 1.5–1.6 mL/kg of a 350 or 370 mgI/mL iodinated contrast agent was injected at a rate of 3–5 mL/sec, using an automatic power injector. CT images were obtained as follows: single portal venous phase (36 patients), dual phases that included the arterial and portal phase (37 patients), and triple phases that included arterial, portal, and delayed phases (104 patients). Dynamic-enhanced images were obtained by scanning the images at 13–17, 60–75 secconds, and 2–3 minutes after attenuation of the descending thoracic aorta reached 100 Hounsfield units, using the bolus tracking technique for arterial, portal, and delayed phases, respectively (12). The other dynamic CT protocol used in 3 patients was the pancreatobiliary protocol including early arterial, late arterial, and portal phases. CT scan with portal and delayed phases was performed for 1 patient.
CT Image Analysis
Morphologic CT features of the primary gastric neoplasms, as well as their enhancement patterns, were assessed by two radiologists (with 5 and 19 years of experience, respectively) in a consensus manner, on a picture archiving and communication system workstation monitor. Both radiologists were aware that the study population had locally advanced or metastatic gastric cancers, but were blinded to their histologic subtype, the degree of differentiation, and IHC results including HER2 expression status.
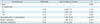
The analyzed CT findings for the primary gastric lesion were as follows: multiplicity, Bormann type, maximum tumor thickness, tumor margin, clinical tumor node metastasis (cTNM) staging, homogeneity, degree of enhancement on each phase, and dynamic pattern of enhancement (12). Multiplicity was assessed into three categories: single, multiple, or diffuse. Bormann type was classified as: polypoid, type I; ulcerofungating with a sharp raised margin, type II; ulcerated with a poorly defined infiltrative margin, type III; and infiltrative, type IV. The maximum tumor thickness was measured on the axial CT scan using an electronic caliper. Tumor margin was defined as either a well-defined or an ill-defined margin. cTNM staging was assessed similar to prior studies (1617). The CT criteria for T staging are summarized in Table 1. The degree of enhancement was evaluated as high, iso-, or low attenuation on arterial, portal, and delay phases, referencing the enhancement of the normal gastric mucosa. Thereafter, the dynamic pattern of enhancement was assessed as follows: persistently low attenuation (low/low), progressive enhancement pattern (low/iso, low/high, or iso/high), wash-in/wash-out pattern (iso/low, high/iso, or high/low), and persistently high attenuation (high/high) (12). The presence of vascular invasion was also recorded, when the tubular vascular thrombi were noted around the primary gastric lesion.
For evaluating the lymph nodes (LNs), the location and number of metastatic LNs were recorded. We defined the location of nodal stations according to the Japanese classification of gastric cancer (18). LN metastasis was considered to be present if there were any LNs ≥ 8 mm in the short-axis diameter, if a cluster of ≥ 3 peri-lesional nodes was identified regardless of their size, or if the LNs contained necrotic foci (1617). The presence of necrosis was also evaluated in cases of metastatic LNs. The shortest diameter of the biggest metastatic LN was also measured. Finally, the degree of enhancement of the biggest metastatic LN was assessed in comparison with the enhancement of the back muscle.
The location of distant metastasis was classified into distant LN, liver, peritoneum, lung, bone, adrenal gland, tumor thrombi, and others. We also assessed the presence of infrarenal metastatic LNs, and periureteral or peribiliary metastasis. Distant metastasis was considered to be present in 171 patients, was pathologically confirmed in 64 patients, and proven based on images including follow-up studies in 107 patients. The presence or absence of peritoneal seeding was also assessed. Peritoneal seeding was confirmed by histology (n = 44), or based on a combination of CT findings and follow-up studies (n = 46), determined by the consensus of both radiologists.
Hepatic metastasis was analyzed in greater detail by the same two radiologists. The two reviewers assessed the metastatic lesions either as hyper- or hypo-attenuated, in comparison to the adjacent normal parenchyma, and the highest enhancing peripheral portion was considered for qualitative interpretation. In addition, the dynamic enhancement pattern of hepatic metastasis was also assessed in the same manner as the primary lesion. Margin, presence or absence of necrosis, and capsular retraction of hepatic metastasis, were also evaluated.
Statistical Analysis
All statistical analyses were performed using SPSS 21.0 for Windows (SPSS Inc., Chicago, IL, USA). The prevalence of each CT finding between HER2-positive and negative groups were compared using univariate statistical tests such as Fisher's exact test or the Student t test. After identifying significant CT features using univariate analysis, binary logistic regression analyses with the backward projection method were performed to determine the most significant differential CT features. Survival curves were calculated using the Kaplan-Meier method, and the difference was analyzed with the log-rank test. For all statistical analyses, a p value < 0.05 was considered to be statistically significant.
RESULTS
Clinical and Histologic Findings
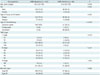
Table 2 summarizes the clinical and histological findings in 181 patients. There were no significant differences in age and sex between the HER2-positive and negative groups. Histopathologically, 37 patients with HER2-negative (24.8%) and 6 patients with HER2-positive (18.8%) were diagnosed after surgery, such as palliative operation. In the remaining 138 patients, endoscopic biopsy was performed to prove gastric cancers. Of the 43 patients who underwent surgery, pathologic TNM staging was used for analysis, while cTNM staging was utilized for patients who did not undergo surgery. Among the 43 patients, gastrectomy with/without LN dissection was performed in 22 patients. In the HER2-negative group, all 149 patients underwent cytotoxic chemotherapy, while combination therapy with cytotoxic agents and trastuzumab was administered in 62.5% (20/32) of the HER2-positive patients. The difference was statistically significant (p < 0.001). In addition, HER2-negative cancers showed a tendency to have more advanced T stage (T4a [68.5%, 102/149] or T4b [23.5%, 35/149]). To the contrary, lower T stages (T2 [9.4%, 3/32] or T3 [12.5%, 4/32]) were more common in HER2-positive cancers (p = 0.015). N and M stage, and morphology of the tumor, did not show any significant difference between the two groups.
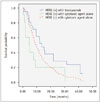
Figure 2 shows the survival curves of HER2-positive and negative cancers according to the primary systemic therapy. Median overall survival was significantly longer in HER2-positive cancer patients treated with trastuzumab (13.7 months; 95% confidence interval [CI], 8.5–18.9) than in HER2-positive (5.0 months; 95% CI, 0.4–9.5; p = 0.019) and HER2-negative cancer patients treated with chemotherapy alone (9.6 months; 95% CI, 7.8–11.4; p = 0.035). However, there were no significant differences in survival between HER2-positive and negative cancers treated with chemotherapy alone (p = 0.205).
CT Findings of Primary Gastric Tumors and Lymph Node Metastases
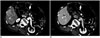
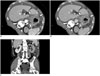
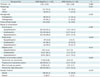
CT findings of primary tumors and metastatic LNs with results of univariate statistical analysis are presented in Tables 3 and 4. HER2-negative cancers (mean thickness, 1.95 cm) were slightly thicker than HER2-positive cancers (mean thickness, 1.66 cm), but the difference was not statistically significant (p = 0.089). In terms of the degree of primary tumor enhancement, HER2-positive cancers (62.5%, 20/32) more frequently showed hyperattenuation on the portal phase, compared with HER2-negative cancers (30.9%, 46/149) (p = 0.003) (Figs. 3, 4). As for the other phases, the difference in the degree of enhancement was not statistically significant. Furthermore, the pattern of dynamic enhancement did not show a significant difference (Table 3).
In terms of LN metastases, HER2-positive cancers represented slightly larger metastatic LNs when compared to HER2-negative cancers (2.66 cm vs. 2.34 cm, respectively), but the difference was not statistically significant (p = 0.253). Moreover, all other variables (i.e., size, shape, homogeneity, presence or absence of necrosis, and degree of enhancement of LN metastasis) were also not statistically different between the two groups (p > 0.05) (Table 4).
CT Findings of Distant Metastasis
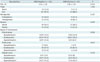
Hepatic metastases were more frequently found in HER2-positive cancers (20/32 [62.5%] vs. 48/149 [32.2%], p = 0.001), while peritoneal seeding was more often found in HER2-negative cancers (80/149 [53.7%] vs. 10/32 [31.3%], p = 0.021) (Fig. 3). Periureteral or peribiliary metastasis was exclusively noted in HER2-negative cancers (13/149 [8.7%] vs. 0/32 [0%]), but the difference was not statistically significant (p = 0.129) (Fig. 4). CT findings of hepatic metastases were not significantly different between the two groups, for all analyzed items (p > 0.05) (Table 5).
Results of Binary Regression Analysis
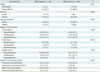
Results of binary regression analysis are presented in Table 6. Hyperattenuation of the primary tumor (odds ratio [OR], 4.68; p < 0.001) and the presence of hepatic metastasis (OR, 4.43; p = 0.001) were significant differentiators of HER2-positive cancers from HER2-negative cancers. Representative examples are presented in Figures 3 and 4.
DISCUSSION
In our study, several CT features were demonstrated to differentiate HER2-positive gastric cancers from HER2-negative cancers. As an example, hyperenhancement of the primary gastric tumors on the portal venous phase was more frequently observed in HER2-positive gastric cancers than in HER2-negative cancers. More specifically, 62.5% (20/32) of the HER2-positive gastric cancers showed hyperattenuation of the tumor on the portal phase, while only 30.9% (46/149) of HER2-negative gastric cancers showed hyperattenuation compared to the adjacent normal gastric mucosa (p = 0.003). The following details may explain these observations. First, even though the exact mechanism is not completely known, a positive correlation between HER2 expression and microvascular density (MVD) in gastric cancers has already been reported (19). Considering that MVD represents angiogenesis in several kinds of tumors, hyperenhancement in HER2-positive cancers might be explained by the higher MVD value. Second, the association between HER2 and vascular endothelial growth factor (VEGF) expression may be responsible for the hyperenhancement of HER2-positive cancers. In a study by Schoppmann et al. (20), they provide evidence for a clinically relevant association between HER2 and VEGF expression in human breast cancer. They found that patients with 3+ HER2 protein expression showed significantly stronger VEGF expression than patients with HER2-negative breast cancers (20). Thus, considering that VEGF is a key factor for angiogenesis, the hyperenhancement of HER2-positive cancers observed in our study may be explained by the higher expression of VEGF protein. Indeed, one of the intracellular mechanisms evoked by trastuzumab is the anti-angiogenesis effect due to the decreased VEGF produced by tumor cells.
Another finding in our study was that the distribution of the T stage on CT was significantly different between HER2-positive and negative cancers. Most HER2-negative cancers (91.9%, 137/149) showed a higher T stage (cT4a [68.5%, 102/149] or cT4b [23.5%, 35/149]), while 21.9% of HER2-positive cancers showed a lower T stage (cT2 [9.4%, 3/32] or cT3 [12.5%, 4/32]) (p = 0.015). In addition, although a statistical significance was not achieved, the mean maximum thickness of primary tumors in HER2-positive cancers tended to be thinner than the HER2-negative cancers. Our results are contradictory to our initial expectations and those of previous studies, in which HER2 overexpression was regarded as an independent poor prognostic factor for patients with gastric carcinoma (2122). According to Zhang et al. (22), HER2 overexpression is significantly associated with an advanced TNM stage, and strongly associated with tumor progression as well as poor prognosis of patients with gastric cancers. However, contradictory results have also been reported (19). Bădescu et al. (19) reported that an overexpression of the HER2 oncoprotein correlates with the first two TNM stages of gastric cancers. Considering a well-known fact that HER2 overexpression is more frequently found in intestinal type than in diffuse type in which the tumor cells tend to infiltrate into deeper tissue, the relationship between HER2-status and histologic type might be responsible for lower T stage in HER2-positive cancers (2324). However, considering that the putative prognostic significance of the overexpression of the HER2 protein in gastric cancer is still controversial, further studies with larger study populations are strongly warranted.
Interestingly, we also found that the distribution of metastatic sites was significantly different between HER2-positive and HER2-negative gastric cancers. In our study, HER2-positive gastric cancers more frequently metastasized to the liver, while HER2-negative cancers frequently metastasized to the peritoneal cavity. The observed frequent hematogenous metastasis to the liver may be related to the association of HER2 positivity and angiogenic factors such as MVD and VEGF. On the other hand, frequent metastasis to the peritoneal cavity may be related to the higher T stage (cT4a and cT4b) of HER2-negative gastric cancers. In addition, serosal exposure of HER2-negative gastric cancers could lead to the tumoral spread to the peritoneal cavity, resulting in peritoneal seeding. Furthermore, even though a statistical significance was not reached, periureteral or peribiliary metastasis were exclusively found in patients with HER2-negative gastric cancers (13/13, 100%) in our study. We believe this observation is of clinical importance, because periureteral or peribiliary metastasis may result in the obstruction of the ureter or bile duct, leading to the necessity of palliative intervention, such as double J catheter insertion or biliary stent insertion.
Contrary to our expectations, the enhancement pattern of metastatic hepatic tumors was not significantly different between the two groups. In addition to the hyperattenuation of primary gastric tumors in HER2-positive cancers, metastatic hepatic tumors in HER2-positive cancers (12/19, 63.2%) showed arterial hypervascularity more frequently than in HER2-negative cancers (17/36, 47.2%), albeit without a statistically significant difference (p = 0.468). Although we are unable to explain exactly why the enhancement patterns of primary and metastatic tumors were discordant, we believe that the small number of patients with metastatic hepatic tumors may be partly responsible. Therefore, further studies recruiting more patients with metastatic gastric cancers are strongly warranted to resolve this issue.
In terms of clinical outcomes, the median survival of HER2-positive cancers treated with trastuzumab (13.7 months; 95% CI, 8.5–18.9) was significantly longer compared to those of HER2-positive (5.0 months; 95% CI, 0.4–9.5) and HER2-negative cancers treated with conventional chemotherapy alone (9.6 months; 95% CI, 7.8–11.4) (p < 0.05). This result is in good agreement with a previous study by Bang et al. (11) who reported that patients with HER2-positive cancers treated with trastuzumab plus chemotherapy showed longer median survival (13.8 months; 95% CI, 12–16) than those who underwent chemotherapy alone (11.1 months; 95% CI, 10–13) (11). Our study results also indicate the survival benefit of trastuzumab in HER2-positive cancers. In addition, the median survival of HER2-positive cancers was slightly shorter than that of HER2-negative cancers in the chemotherapy alone group, albeit without statistical significance (p = 0.205). Considering the lower T stage and lower tumor burden of HER2-positive cancers compared to HER2-negative cancers, this result was contradictory to our expectation. We believe that the small number of patients might be partly responsible for this unexpected finding. These conflicting results regarding the prognosis of HER2-positive and negative cancers require further studies with a larger study population.
We should address several limitations of the current study. First, as our study was retrospectively designed, a variety of CT scanners were used, resulting in differences in the parameters, degrees of gastric distension, patients' positions, and doses of contrast media used. However, as all our patients had undergone MDCT with slice thicknesses of ≤ 5 mm, we believe that CT images may be acceptable for imaging interpretation. Nonetheless, further prospective studies using a standardized and uniform CT protocol are required to prove our results. Second, TNM staging of most patients was determined by imaging alone, without proven reference standard. Although MDCT with 3D imaging has markedly improved the accuracy for TNM staging of gastric cancer, the overall performance is still limited. However, considering explorative open and close operation for the confirmation of TNM staging in unresectable gastric cancer patients is ethically unacceptable, we believe that this limitation is unavoidable. Third, the presence of locally advanced cancer (T4b) or metastatic cancer (M1) was not histologically proven in all patients in our study. However, we used strict imaging criteria, and a sufficient follow-up period of more than 3 years, to confirm these tumors. Finally, the number of patients in our study for hepatic metastases assessment was relatively small. Further studies with a larger number of patients are warranted to better evaluate the differences in CT findings between hepatic metastases from HER2-positive and HER2-negative cancers.
In conclusion, HER2-positive gastric cancers show less advanced cT stage, hyperattenuation on the portal phase, and frequently metastasize to the liver. Identification of phenotype-genotype associations has great potential for the development of an imaging-based therapeutic strategy in gastric cancer patients.

 XML Download