

 PDF
PDF ePub
ePub Citation
 Print
Print


INTRODUCTION
Rotational atherectomy (RA) was firstly introduced as a technique for endovascular treatment of obstructive atherosclerotic disease (1). Cardinal indication for RA is calcified lesion. In the absence of plaque modification, calcified lesion confers an increased likelihood of procedural failure, stent under-deployment, restenosis, and major complications (2). RA facilitates percutaneous coronary intervention (PCI) for complex de novo lesions with severe calcification.
In practice, calcification severity is customarily graded by qualitative assessment of invasive coronary angiography (ICA) (3). However, ICA is insensitive for detecting mild or moderate calcification in comparison with intravascular ultrasound (IVUS) (4). Coronary computed tomography angiography (CCTA) has been established as an effective non-invasive imaging modality for coronary calcium assessment by using Agatston score which is associated with patient's outcome (56). Although the diagnostic accuracy of lumen evaluation by CCTA is impaired in the presence of moderate to severe calcified lesions (78), CCTA remains a valuable method for morphological assessment of calcium arc (9). The objective of this study was to determine the feasibility of calcification characterization by CCTA to predict the use of RA for coronary intervention of lesions with moderate to severe calcification.
Go to : 
MATERIALS AND METHODS
Patient Population
Institutional Review Board approval was obtained for this retrospective study. Informed consent was waived due to its retrospective nature. Between January 2011 and December 2015, consecutive patients who underwent CCTA and ICA within one month were retrospectively reviewed. Inclusion criteria were: 1) patients with moderate or severe calcified lesions and significant stenosis (moderate calcification was defined as cross-sectional arc calcium of 90–180° whereas severe calcification was defined as cross-sectional arc calcium of 180°); and 2) PCI was attempted for lesion revascularization. Exclusion criteria were: 1) patients who did not have moderate or severe calcified lesions with significant stenosis, 2) PCI was not attempted for lesion revascularization, or 3) CCTA was uninterpretable due to poor image quality (Fig. 1).
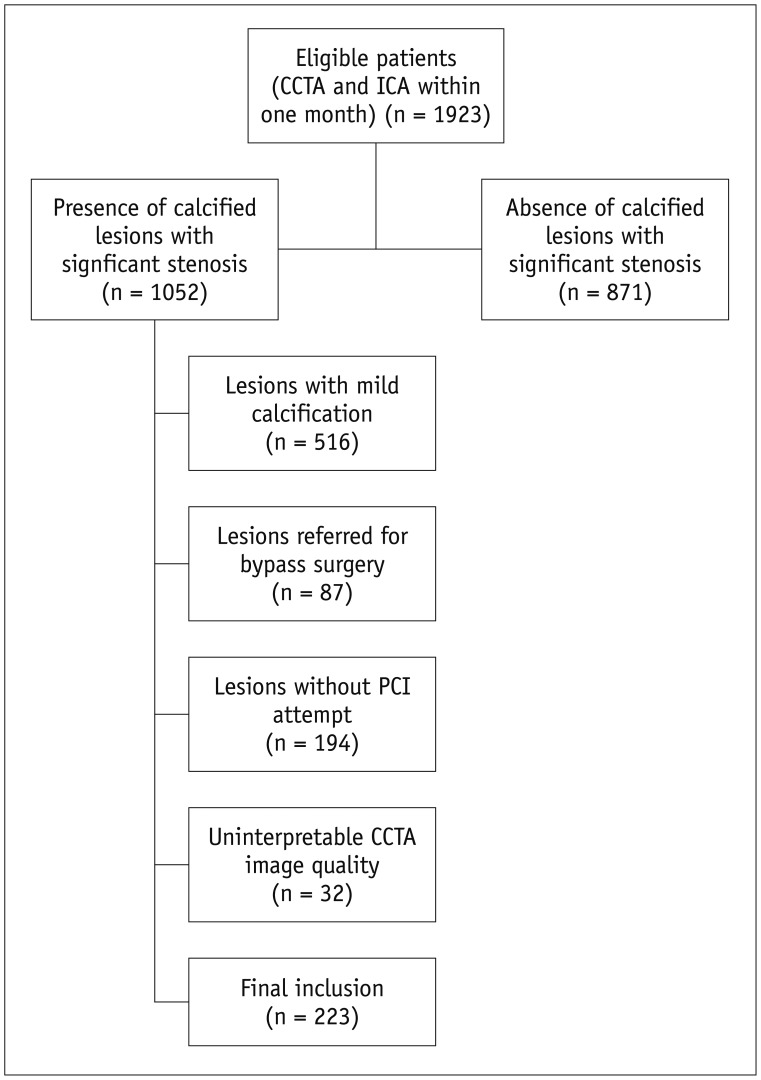
A total of 1923 patients who underwent CCTA and ICA within one month were initially reviewed. Of these, 1387 patients with non-calcified or mild calcified lesions and 281 patients with moderate or severe calcified lesions but without PCI attempt were subsequently excluded. A total of 32 patients were excluded due to partially uninterpretable CCTA image quality. Therefore, a total of 223 patients with mean age of 68.5 ± 9.7 years (range, 39 to 90 years) were finally included in this study (Fig. 1), including 146 males with mean age of 68.6 ± 10.4 years (range, 39 to 90 years) and 77 females with mean age of 68.5 ± 8.3 years (range, 49 to 88 years) (p = 0.972).
Scan Protocol of CCTA
A 128-slice multidetector CT (Definition AS, Siemens Medical Solutions, Forchheim, Germany) was employed for scanning. β-blocker (25–75 mg, Betaloc ZOK, AstraZeneca, China) was administrated orally 1 hour prior to examination of patients with heart rate > 65 bpm. Nitroglycerin was given sublingually to all patients. A bolus of contrast media (iopamidol, Isovist, 370 mg iodine/mL, Bayer Healthcare, Berlin, Germany) was injected into the antecubital vein at a rate of 4.5–5 mL/s, followed by a 20–40 mL saline flush using a dual-barrel power injector (Tyco, Cincinnati, OH, USA). The amount of contrast media was determined according to the patient's body weight and scan time. A test bolus was first injected and the region of interest was placed within ascending aorta to determine the proper delay time which was defined as 4 seconds plus the peak time of ascending aorta. Retrospective electrocardiography (ECG)-gated CTA was performed for patients with final heart rate ≥ 70 bpm, collimation of 64 × 0.6 mm, reconstructed slice thickness of 0.6 mm, reconstructed slice interval of 0.5 mm, and rotation time of 300 ms. The pitch and current were ECG-modified. The effective current was set at 200 mA (ECG-dependent dose modulation technique was applied, full dose during the R-R interval of 40–70%) and tube voltage was set at 120 kVp. Prospective ECG-triggered CTA was performed in patients with final heart rate < 70 bpm with the center of triggering window set at 70% of the R-R interval. For the rest of parameters, prospective acquisitions were used as retrospective acquisitions.
CCTA Image Reconstruction and Analysis
Data were transferred to an offline workstation (Syngo™, Siemens Medical Solutions) for assessment. Axial images, cross-sectional view, curved planar reformation (CPR), multiplanar reformation, and 3D-maximum intensity projection images were available for evaluation.
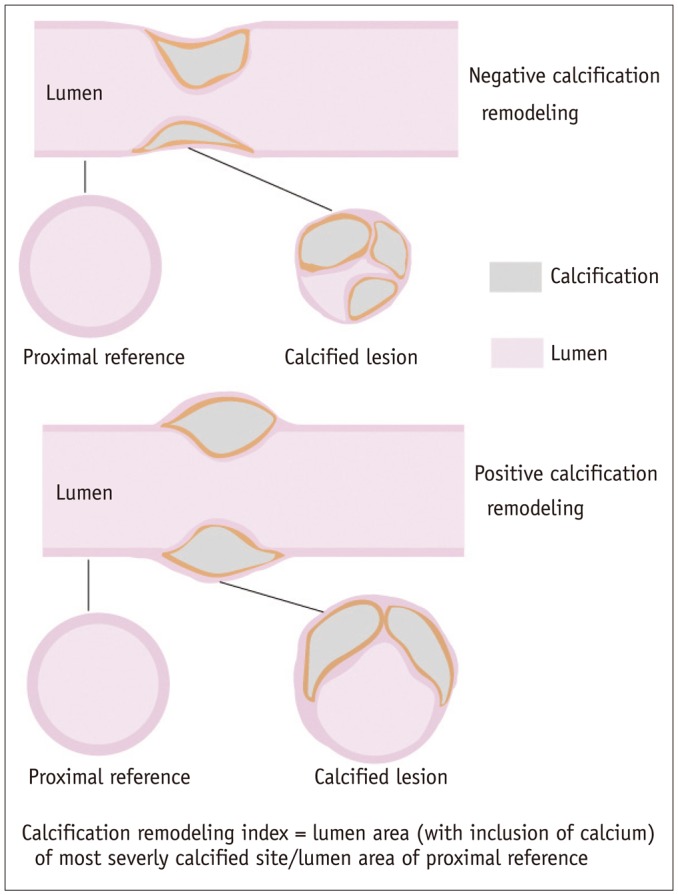
The morphology of calcium arc was evaluated on crosssectional images and subdivided into three groups: mild (cross-sectional arc calcium < 90°, 1 quadrant), moderate (cross-sectional arc calcium of 90–180°, 2 quadrants), and severe (cross-sectional arc calcium > 180°, 3–4 quadrants). Lesions with mild calcification were excluded from further assessment since RA was not employed for this subgroup (10). Lesions with moderate to severe calcification and PCI attempt were selected for further analysis. Various parameters were measured and recorded as following. The per-lesion coronary calcium burden was evaluated using Agatston score and calcium volume of each manually selected calcified lesion. Total calcification length was measured on CPR at best projection view from the proximal end of calcium to the distal end. Calcification remodeling index (RI) of lesion was calculated as the ratio of the smallest vessel cross-sectional area of the lesion (including the area of calcification) to the proximal reference luminal area of the lesion (Fig. 2). The vessel area of calcified lesion was corrected for the influence of normal tapering (1.2 mm2/cm) when the length was > 10 mm (11). Plaque burden was measured on cross-sectional images and defined as the ratio of plaque cross sectional area to vessel cross sectional area.
Two experienced radiologists (with 10 years and 8 years of experience in cardiac imaging, respectively) who were blinded to clinical histories and prior ICA results independently analyzed these lesions. The mean value of calcification RI and calcification length measured by the two observers was used for further analysis. Bland-Altman analysis was performed in 40 randomly selected lesions to test the inter-rater agreement. Any disagreement between two observers was resolved by consensus.
ICA and RA Procedure
Invasive coronary angiography was performed with standard techniques. At least two different views were obtained for each main vessel. Two skilled observers who were blinded to the results of CCTA evaluated all segments. The stenosis extent of every lesion was evaluated and recorded based on visual assessment. Culprit lesions were considered for revascularization by interventional cardiologists. Indications for RA in our institution were made according to current guidelines for PCI, i.e., calcified lesions not crossable by a balloon catheter or adequately dilated before stent implantation (12).
Rotational atherectomy was performed using a Rotablator (Boston Scientific Scimed, Maple Grove, MN, USA). The burr size was set to reach a burr/vessel ratio of 0.5 (maximum of 0.7 if needed). Rotablation speed ranged from 140000 to 180000 rotations per minute. The burr was platformed immediately proximal to the lesion to avoid injury to healthy vessel segment.
Statistical Analysis
Statistical analysis was performed using commercial available statistical software (SSPS, V13.0, SPSS Inc., Chicago, IL, USA; MedCalc Statistical Software version 15.2.2, MedCalc Software bvba, Ostend, Belgium). One-sample Kolmogorov-Smirnov test was used to check whether the distribution of data was normal. Quantitative variables with normal distribution were expressed as mean ± standard deviation. Median and quartiles were used otherwise. The t test and Pearson test were used for normally distributed data while Mann-Whitney U-test was used for data that were not normally distributed. Bland-Altman analysis was performed to test the inter-rater agreement. The best cut-off values of various parameters were determined by Youden index. The maximum sum of sensitivity and specificity were determined using receiver operating characteristic (ROC) curve analysis with Delong method. The sensitivity, specificity, positive predictive value, and negative predictive value of best cut-off values of all parameters for identifying lesions with RA were generated from ROC curve analysis. A two-tailed p < 0.05 was considered statistically significant. A multivariate model was fitted by including all CCTA and ICA parameters to identify variables that could predict the use of RA in moderate to severe calcified lesions.
Go to :
RESULTS
Clinical Characteristics
The dose length product of CCTA was 443.5 ± 142.2 mGy*cm (range 177 to 738 mGy*cm). The mean amount of contrast material used for CCTA was 85.4 ± 7.2 mL (range, 70 to 105 mL). ICA was performed in all patients with an interval of 9.1 ± 5.6 days (range, 1 to 28 days). Detailed demographic data are summarized in Table 1.
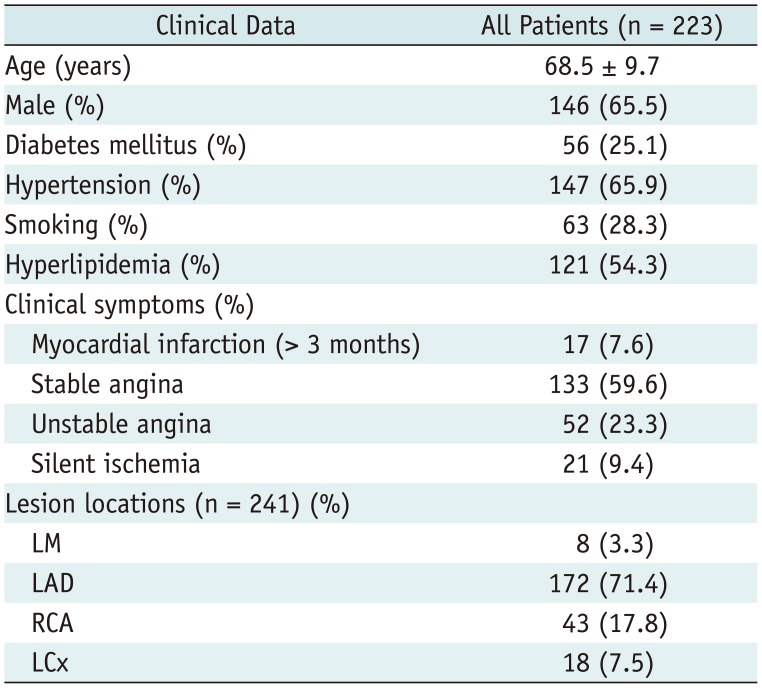
Table 1
Demographic Data
![]()
ICA and PCI Characteristics
A total of 223 patients (241 calcified lesions) who had PCI attempt were finally included for analysis. Based on ICA, all lesions were found to have moderate to severe coronary stenosis. They were considered for further interventional treatment according to patient's clinical symptoms or findings of functional tests. Among those calcified coronary stenosis, 204 lesions were successfully revascularized with PCI without additional plaque modification while another 37 lesions were stented after using RA in order to make balloon catheter crossable or adequately dilated. The mean percentage of stenosis extent assessed by ICA in the group with RA was 90%, which was larger than that of stenosis extent in group without RA (Table 2). However, the difference between the two groups was not statistically significant.
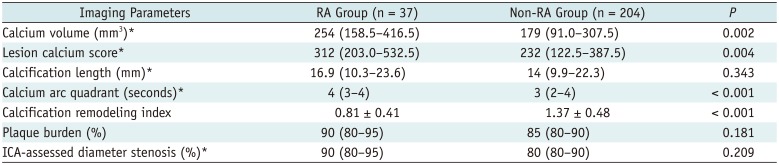
Table 2
Comparison of Various Parameters in Patients with or without RA
![]()
CCTA Characteristics
A total of 241 calcified lesions were comprehensively analyzed by CCTA. A variety of parameters were measured and recorded as mentioned previously. The inter-observer agreement for the calculation of calcification RI and calcification length was good (r = 0.84 and 0.92, both p < 0.001). According to CCTA findings, lesions with RA tended to have larger calcium volume and focal Agatston score compared to lesions without RA (Table 2). More involved calcium arc quadrants and significantly smaller calcification RI were also present in the group with RA (Figs. 3, 4). However, calcification length was similarly distributed in the two groups.
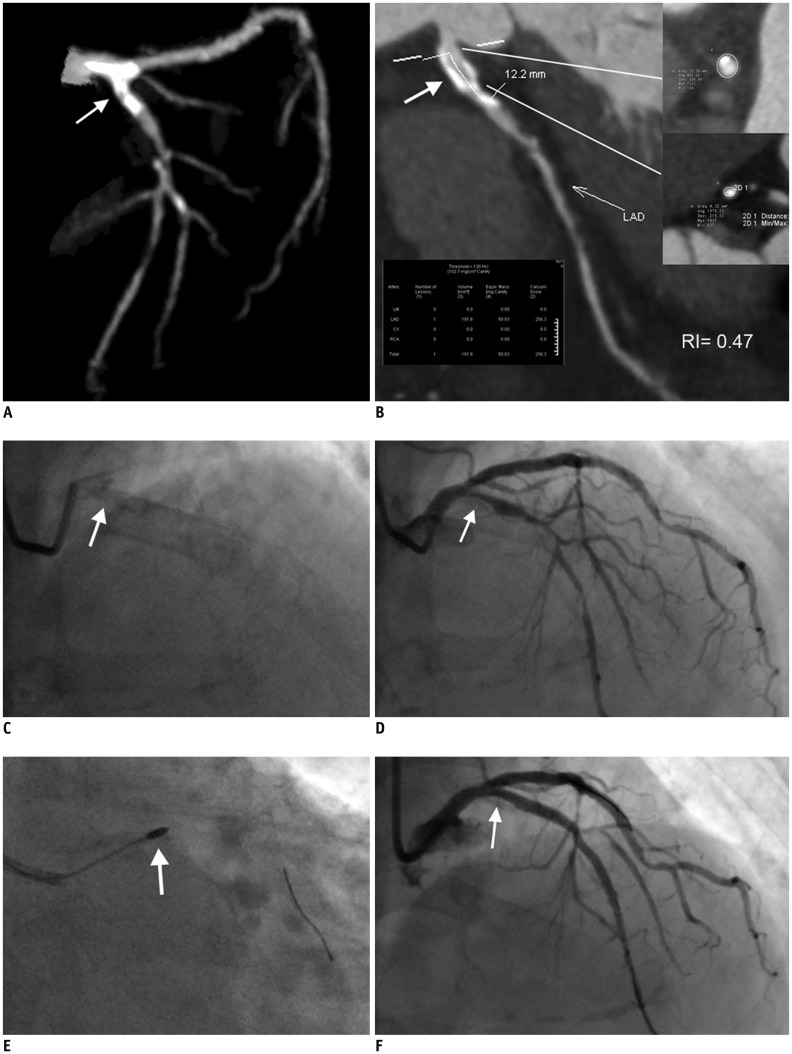 | Fig. 3Representative case of calcified coronary stenosis treated with RA and PCI.
A. 3D-MIP image of left coronary artery showing calcified lesion located at LM and proximal LAD (white arrow). B. Calcification length measured on CPR image (white arrow) was 12.2 mm. Calcium volume and focal Agatston score were 191.8 mm3 and 256.3, respectively. Calcification remodeling index of this lesion was calculated to be 0.47. Involved calcium arc quadrant was 3 as identified on cross-sectional images. C. Fluoroscopy of left coronary artery revealing calcification of proximal LAD (white arrow). D. ICA of left coronary artery showing severe stenosis of proximal LAD (white arrow). E. Lesion was modified with RA (white arrow) prior to stent deployment. F. Lesion was successfully treated after stent implantation as confirmed by ICA (white arrow). CPR = curved planar reformation, LAD = left anterior descending, LM = left main, MIP = maximum intensity projection, RA = rotational atherectomy
|
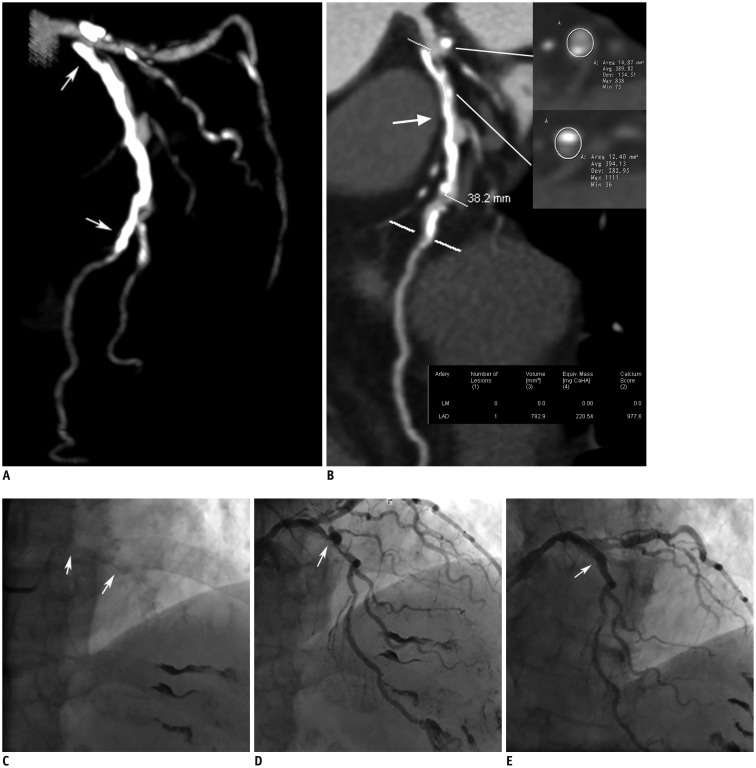 | Fig. 4Representative case of calcified coronary stenosis treated with PCI but without RA.
A. 3D-MIP image of left coronary artery showing long diffusely calcified lesion located at proximal to middle LAD (white arrows). B. Calcification length measured on CPR image (white arrow) was 38.2 mm. Calcium volume and focal Agatston score were 782.9 mm3 and 977.6, respectively. Calcification remodeling index of this lesion was calculated to be 0.91. Involved calcium arc quadrant was 2 as identified on cross-sectional images. C. Fluoroscopy of left coronary artery revealing calcification of proximal to middle LAD (white arrows). D. ICA of left coronary artery showing severe stenosis of proximal LAD (white arrow). E. Lesion was successfully treated after stent implantation without use of RA (white arrow).
|
ROC Curve Analysis and Multivariate Analysis
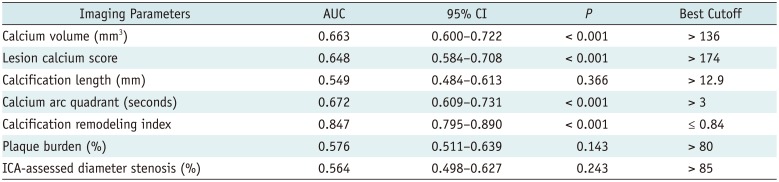
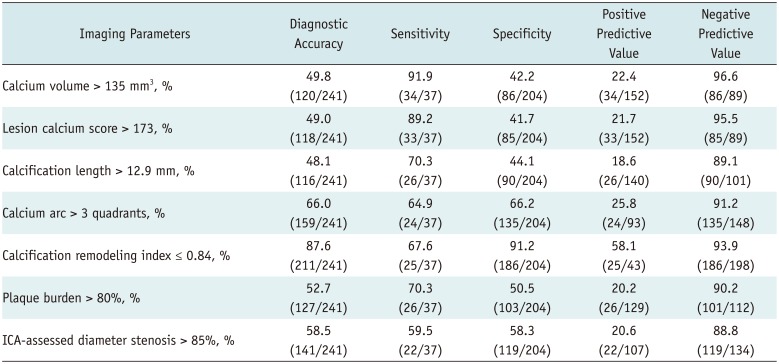
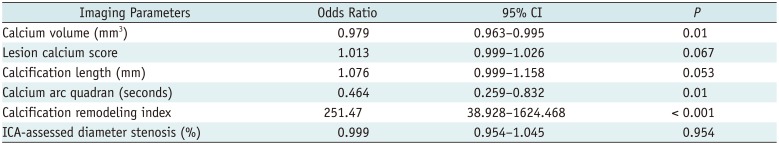
According to ROC curve analysis, calcification RI had the largest area under curve with the best cut-off value of ≤ 0.84 when compared to other parameters (Fig. 5, Table 3). Using the best cut-off value derived from ROC curve analysis, calcification RI yielded the best diagnostic accuracy (87.6%, 211/241) while all other parameters failed to reach comparable diagnostic performance (Table 4). A multivariate model was fitted by including all CCTA and ICA parameters recorded. Calcification RI ≤ 0.84 was found to be the strongest independent predictor (odds ratio: 251.47, p < 0.001) for using RA when compared to other parameters (Table 5). Calcium arc involving more than 3 quadrants and calcium volume > 135 mm3 were also found to be independent predictors of additional plaque modification with much less predictive power. However, Agatston score, calcification length, and ICA-assessed stenosis extent were not independent predictors based on multivariate analysis.
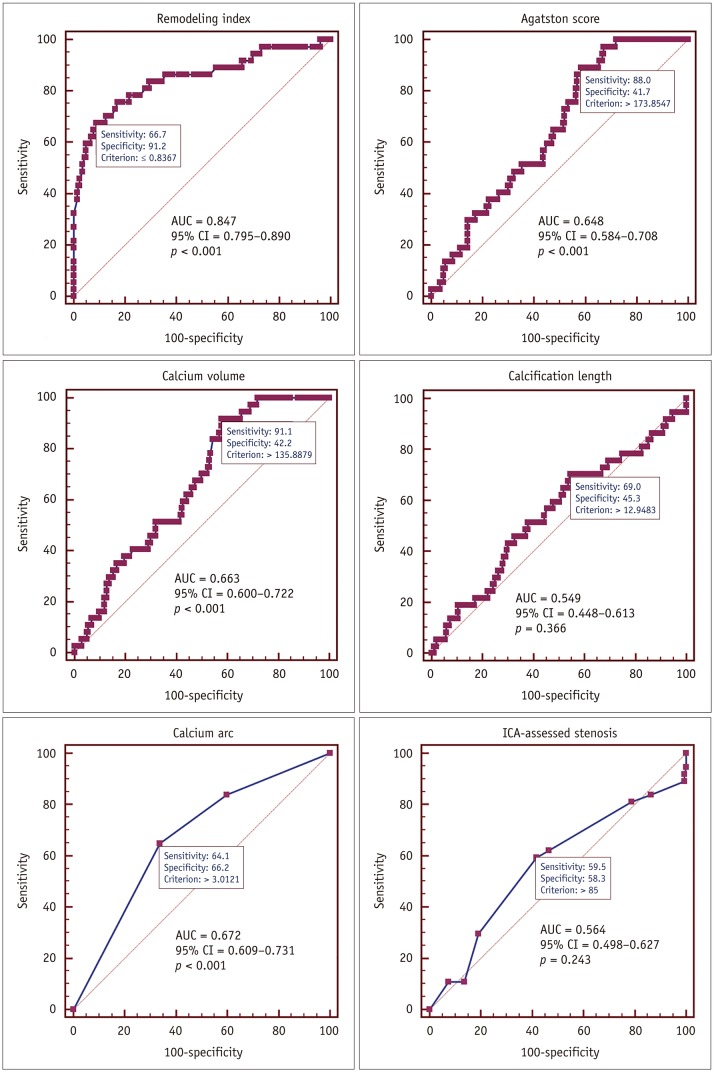 | Fig. 5ROC curve analysis of various parameters for identifying calcified lesions treated with RA.Calcification remodeling index showing largest AUC and best diagnostic performance over other parameters. AUC = area under curve, CI = confidence interval, ROC = receiver operating characteristic.
Calcification remodeling index showing largest AUC and best diagnostic performance over other parameters.
|
Table 3
ROC Curve Analysis of Various Parameters for Identifying Lesions with RA
![]()
Table 4
Diagnostic Performance of Various Parameters for Identifying Lesions with RA
![]()
Table 5
Multivariate Analysis to Identify Predictors of RA Employment
![]()
Go to :
DISCUSSION
The main finding of this study was that the calcification RI of moderate or severe calcified coronary lesions was associated with the incidence of using RA to aid PCI. Calcification RI ≤ 0.84 was the strongest independent predictor for using RA.
Coronary artery calcification is a common finding in elderly patients (13). Its extent is strongly correlated with the degree of atherosclerosis and the rate of future cardiac events (14). After balloon angioplasty and stent implantation, severe coronary calcification can increase the likelihood of procedural failure and complications such as coronary dissection and thrombosis, stent under-expansion, asymmetric expansion, and malposition (151617). In order to improve target vessel compliance, RA has been introduced to facilitate PCI procedure. RA has been confirmed to be associated with better clinical outcomes (18).
Consideration of RA requires the determination of calcification severity because benefits of RA are attenuated when calcification is mild or absent. ICA is one of the widely applied invasive methods for calcium assessment. However, it has low sensitivity and high specificity (4). Compared to ICA, IVUS is substantially more accurate for calcium detection with very high sensitivity and specificity (19). However, because ultrasound does not penetrate calcium, calcium thickness cannot be determined and volume cannot be calculated. In contrast to IVUS, CCTA is able to measure calcium volume and burden by Agatston score and a series of additional parameters non-invasively. Therefore, the role of CCTA for prediction of RA use was comprehensively investigated in the present study.
According to our findings, calcification RI was strongly correlated with the incidence of RA employment. It outperformed other parameters such as per-lesion calcium volume, Agatston score, calcification length, and stenosis extent for predicting the use of RA. Negative remodeling was predominantly present in the RA subgroup whereas positive remodeling was more frequently seen in the non-RA subgroup. In other words, lesions with small calcium score and volume but with severe negative calcification remodeling are more likely to undergo plaque modification prior to stent implantation than lesions with large calcium score and volume but with positive calcification remodeling. Although histological correlation of this calcification remodeling remains unknown, it could potentially represent different locations of calcium deposits. As revealed by IVUS, calcium location is defined as superficial if it is present in the intimal-luminal interface or deep if it is present within the medial-adventitial border or closer to the adventitia than the lumen. Due to limited spatial resolution, CCTA is unable to identify the accurate locations of calcium deposits on cross-sectional images. However, calcification with significant negative remodeling could be predominantly intimal-located which might protrude into the coronary lumen and subsequently hamper balloon crossing or dilation. Therefore, the clinical implication of calcification RI lies in its role in predicting application of plaque modification techniques for PCI. For lesions with significant negative calcification remodeling, RA is highly likely to be performed prior to stent implantation.
Other parameters such as Agatston score, calcium volume, and involved calcium arc quadrant were also found to be associated with RA use. It is conceivable that lesions with higher calcium score, calcium volume, and more involved calcium arc quadrant would be more likely to cause balloon crossing failure or inadequate dilation. However, multivariate regression analysis revealed that these parameters were not independent predictors for plaque modification as strong as calcification RI. This might be due to the impact of different calcification locations of lesions with similar calcium burdens. In other words, when calcium is deeply located, it could present as positive calcification remodeling with less involvement of calciumlumen interface to hamper balloon crossing or dilation. Therefore, RA is less likely to be used in lesions with large calcium burden and positive calcification remodeling.
The major limitation of this study is its retrospective design, which might give rise to inclusion bias. Patients who were referred for bypass surgery were excluded. Distal calcified lesions were also excluded since PCI was not indicated. Therefore, results of this study could not be applied to the general population. In addition, the overall sample size of the RA group was relatively small. Thus, further prospective studies with larger sample size are warranted to confirm the current findings.
In conclusion, calcification RI characterized by CCTA is associated with the incidence of using RA to aid PCI. Calcification RI ≤ 0.84 is the strongest independent predictor for using RA prior to stent implantation.
Go to :
 XML Download