INTRODUCTION
Given the limitations of spirometry in the characterization of chronic obstructive pulmonary disease (COPD), quantitative computed tomography (QCT) is increasingly being used to evaluate different COPD phenotypes, such as emphysema, large airway remodeling, and expiratory air trapping (
123456). Spirometry may be an insensitive instrument partly owing to variations in maximal forced expiratory volume in 1 second (FEV
1) as a buffer of the capacity prior to the detectable declining level in subclinical emphysema (
789). However, even though QCT allows for more objective measurements, there are only a few reports regarding the QCT measurements in healthy normal subjects demonstrating the limitation of measurement variation according to age, height, sex, race/ethnicity, and scanner manufacturer (
1011). Inspiratory low attenuation area (LAA) ranged from less than 1% to around 8% in the lung tissue with attenuation values of −950 Hounsfield units (HUs) or less on inspiratory CT (LAA
I-950) in studies performed among non-smokers or normal subjects (
1213). According to a recent QCT study among healthy non-Hispanic white non-smoking adults, the mean percentage of LAA
I-950 was 2.0%, although the study did not mention the normal values of different airway parameters (
10). Few efforts have been made to measure QCT parameters in normal Korean subjects; such data could be useful, supportive, reference data in the future. The purpose of this study was to measure the QCT parameters of the lungs and airways in Korean never-smokers and ever-smokers with normal spirometry and visually normal chest CT results and to compare the results according to age, sex, and smoking history.
Go to :

MATERIALS AND METHODS
Study Subjects
Between September 2013 and April 2015, a total of 1000 consecutive subjects (500 males and 500 females; 15 to 81 years old; mean age, 51.0 ± 16.1 years) who underwent chest CT and pulmonary function tests (PFTs) were recruited from two institutions. Among them, those with medical records showing normal PFT results, normal findings on chest CT scans, and no known history of lung disease or surgery were enrolled in this study. Subjects were excluded when chest CT protocols were not identical between the two institutions. Medical records prepared by fourth year radiology residents were retrospectively reviewed with a focus on physical examination, age, sex, smoking history, chest CT report, and PFT results. Finally, 164 subjects who had normal results on chest CT and spirometry tests and normal physical examination according to their medical records were selected for the analysis. One hundred nineteen subjects were never-smokers and 45 subjects were ex-smokers or current smokers. Their overall mean age was 53.3 ± 14.4 years. There were 67 males (mean age, 52.5 ± 14.8 years) and 97 females (mean age, 57.1 ± 13.8 years) and the proportion of ever-smokers among males and females was 66 percent and one percent, respectively. The Institutional Review Board of each institution approved this retrospective study and waived the requirement of obtaining informed consent.
CT Examination, Acquisition
All subjects underwent volumetric assessment using a 16 or 128 multidetector CT scanner (Somatom Sensation 16, Siemens Medical Solutions, Erlangen, Germany; Somatom Definition AS, Siemens Medical Solutions, Forchheim, Germany, respectively) without contrast in the craniocaudal direction while they were placed in the supine position; scans were taken at full inspiration and relaxed exhalation after coaching. Volumetric CT scans were obtained both at full inspiration (200 mAs) and at the end of normal expiration (50 mAs) using 120 kVp tube current, 0.5 or 0.33 second rotation time, submillimeter reconstruction (thickness: 0.75 mm, interval: 0.5 mm), B35f (or B31f) and B46f (or B45f) reconstruction kernel, and 16 × 0.75 or 128 × 0.6 mm acquisition. Images were displayed in the lung window to assess the lung parenchyma (window level, −600 to −700 HU; window width, 1200–1500 HU) (
14).
Quantitative CT Measurements and Data Analysis
Whole lung volumetric CT images for quantitative analysis were reconstructed using a standard algorithm. Using commercial software (Pulmonary Workstation, version 2.0, VIDA Diagnostics, Coralville, IA, USA), QCT measurements for LAA
I-950, measurements with an attenuation value of −856 HU or less on expiratory CT (LAA
E-856), CT attenuation value at the 15th percentile (HU 15th percentile), mean lung attenuation (MLA), and airway wall thickness were obtained (
514151617181920). The software automatically calculated the LAA, which is defined as the percentage of lung voxels at or below the designated threshold value on inspiratory or expiratory CT. Quantitative assessment of airway wall thickness was performed automatically as the square root of the wall area at the inner perimeter of a 10 mm diameter airway (Pi10). Airway segmentations obtained with the software were assessed for complete airway inclusion as well as correct and consistent labeling. Skipped branch points were manually added as necessary to ensure accurate measurement of airway length. Total lung capacity (TLC
CT) and functional residual capacity (FRC
CT) were also calculated based on the inspiratory and expiratory CT images, respectively. Skewness and kurtosis were measured to evaluate the degree of pulmonary fibrosis.
Pulmonary Function Testing
Pulmonary function tests were performed according to the American Thoracic Society guidelines (
21). A portable spirometer (Chestgraph HI-701, Chest Co. Ltd., Tokyo, Japan) was used, and the following values were assessed: vital capacity (VC), residual volume, TLC, FEV
1, forced VC (FVC), FEV
1/FVC ratio, forced expiratory flow 25–75%, and diffusion capacity of the lung for carbon monoxide. All PFTs were performed on the same day as chest CT scans.
Statistical Analysis
Results are expressed as mean ± standard deviation for continuous variables. In univariate analysis, differences in continuous data between the two groups were analyzed with a 2-tailed unpaired t test. The Wilcoxon rank-sum test was used for non-normally distributed data. One-way ANOVA was used to evaluate the difference between groups. Pearson's correlation coefficient was used to evaluate the relationship between QCT parameters and PFTs. Simple and multiple regression analyses were performed to identify the factors associated with lung attenuation and airway parameters. Statistical analyses were performed using SPSS version 12.0.1 (SPSS Inc., Chicago, IL, USA) and SAS version 9.3 (SAS Institute Inc., Cary, NC, USA). p values < 0.05 were considered statistically significant.
Go to :
RESULTS
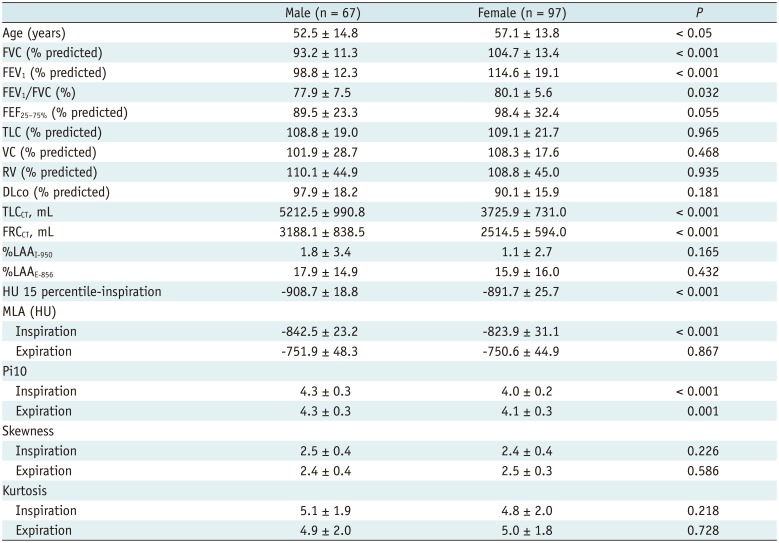
The baseline characteristics and QCT measurements of these 164 subjects are shown in
Table 1. All 164 subjects showed normal PFT results; however, FEV
1 (% predicted), FVC (% predicted), and the FEV
1/FVC ratio in females were significantly greater than those in males (
p < 0.05). The MLA and the 15th percentile on inspiratory QCT were significantly lower in males than in females (
p < 0.001). However, %LAA
I-950 and %LAA
E-856 were not significantly different between males and females (
p = 0.165 and 0.432, respectively). The values of inspiratory and expiratory Pi10 as assessed by QCT were significantly greater in males than in females (
p < 0.001). TLC
CT and FRC
CT were also greater in males than in females (
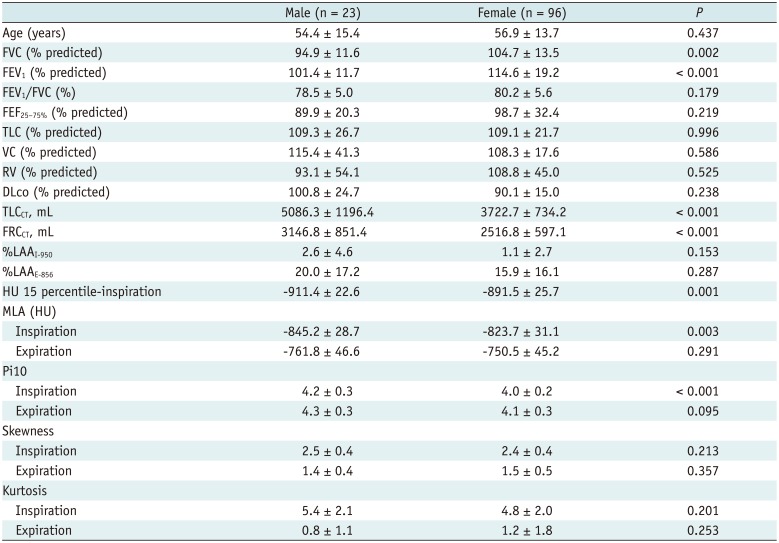
p < 0.001). Skewness and kurtosis were not significantly different between the genders. These significant differences in PFT results and QCT measurements between males and females among all subjects still remained even only in never-smokers (all
p < 0.05 except for FEV
1/FVC) (
Table 2).
Table 1
Subject Characteristics, Physiologic and Quantitative Measurements
|
Male (n = 67) |
Female (n = 97) |
P
|
|
Age (years) |
52.5 ± 14.8 |
57.1 ± 13.8 |
< 0.05 |
|
FVC (% predicted) |
93.2 ± 11.3 |
104.7 ± 13.4 |
< 0.001 |
|
FEV1 (% predicted) |
98.8 ± 12.3 |
114.6 ± 19.1 |
< 0.001 |
|
FEV1/FVC (%) |
77.9 ± 7.5 |
80.1 ± 5.6 |
0.032 |
|
FEF25–75% (% predicted) |
89.5 ± 23.3 |
98.4 ± 32.4 |
0.055 |
|
TLC (% predicted) |
108.8 ± 19.0 |
109.1 ± 21.7 |
0.965 |
|
VC (% predicted) |
101.9 ± 28.7 |
108.3 ± 17.6 |
0.468 |
|
RV (% predicted) |
110.1 ± 44.9 |
108.8 ± 45.0 |
0.935 |
|
DLco (% predicted) |
97.9 ± 18.2 |
90.1 ± 15.9 |
0.181 |
|
TLCCT, mL |
5212.5 ± 990.8 |
3725.9 ± 731.0 |
< 0.001 |
|
FRCCT, mL |
3188.1 ± 838.5 |
2514.5 ± 594.0 |
< 0.001 |
|
%LAAI-950
|
1.8 ± 3.4 |
1.1 ± 2.7 |
0.165 |
|
%LAAE-856
|
17.9 ± 14.9 |
15.9 ± 16.0 |
0.432 |
|
HU 15 percentile-inspiration |
−908.7 ± 18.8 |
−891.7 ± 25.7 |
< 0.001 |
|
MLA (HU) |
|
|
|
|
Inspiration |
−842.5 ± 23.2 |
−823.9 ± 31.1 |
< 0.001 |
|
Expiration |
−751.9 ± 48.3 |
−750.6 ± 44.9 |
0.867 |
|
Pi10 |
|
|
|
|
Inspiration |
4.3 ± 0.3 |
4.0 ± 0.2 |
< 0.001 |
|
Expiration |
4.3 ± 0.3 |
4.1 ± 0.3 |
0.001 |
|
Skewness |
|
|
|
|
Inspiration |
2.5 ± 0.4 |
2.4 ± 0.4 |
0.226 |
|
Expiration |
2.4 ± 0.4 |
2.5 ± 0.3 |
0.586 |
|
Kurtosis |
|
|
|
|
Inspiration |
5.1 ± 1.9 |
4.8 ± 2.0 |
0.218 |
|
Expiration |
4.9 ± 2.0 |
5.0 ± 1.8 |
0.728 |

Table 2
Physiologic and Quantitative Measurements in Never-Smokers
|
Male (n = 23) |
Female (n = 96) |
P
|
|
Age (years) |
54.4 ± 15.4 |
56.9 ± 13.7 |
0.437 |
|
FVC (% predicted) |
94.9 ± 11.6 |
104.7 ± 13.5 |
0.002 |
|
FEV1 (% predicted) |
101.4 ± 11.7 |
114.6 ± 19.2 |
< 0.001 |
|
FEV1/FVC (%) |
78.5 ± 5.0 |
80.2 ± 5.6 |
0.179 |
|
FEF25–75% (% predicted) |
89.9 ± 20.3 |
98.7 ± 32.4 |
0.219 |
|
TLC (% predicted) |
109.3 ± 26.7 |
109.1 ± 21.7 |
0.996 |
|
VC (% predicted) |
115.4 ± 41.3 |
108.3 ± 17.6 |
0.586 |
|
RV (% predicted) |
93.1 ± 54.1 |
108.8 ± 45.0 |
0.525 |
|
DLco (% predicted) |
100.8 ± 24.7 |
90.1 ± 15.0 |
0.238 |
|
TLCCT, mL |
5086.3 ± 1196.4 |
3722.7 ± 734.2 |
< 0.001 |
|
FRCCT, mL |
3146.8 ± 851.4 |
2516.8 ± 597.1 |
< 0.001 |
|
%LAAI-950
|
2.6 ± 4.6 |
1.1 ± 2.7 |
0.153 |
|
%LAAE-856
|
20.0 ± 17.2 |
15.9 ± 16.1 |
0.287 |
|
HU 15 percentile-inspiration |
−911.4 ± 22.6 |
−891.5 ± 25.7 |
0.001 |
|
MLA (HU) |
|
|
|
|
Inspiration |
−845.2 ± 28.7 |
−823.7 ± 31.1 |
0.003 |
|
Expiration |
−761.8 ± 46.6 |
−750.5 ± 45.2 |
0.291 |
|
Pi10 |
|
|
|
|
Inspiration |
4.2 ± 0.3 |
4.0 ± 0.2 |
< 0.001 |
|
Expiration |
4.3 ± 0.3 |
4.1 ± 0.3 |
0.095 |
|
Skewness |
|
|
|
|
Inspiration |
2.5 ± 0.4 |
2.4 ± 0.4 |
0.213 |
|
Expiration |
1.4 ± 0.4 |
1.5 ± 0.5 |
0.357 |
|
Kurtosis |
|
|
|
|
Inspiration |
5.4 ± 2.1 |
4.8 ± 2.0 |
0.201 |
|
Expiration |
0.8 ± 1.1 |
1.2 ± 1.8 |
0.253 |
Comparison between the Never-Smoker and Ever-Smoker Groups in Terms of QCT and PFT
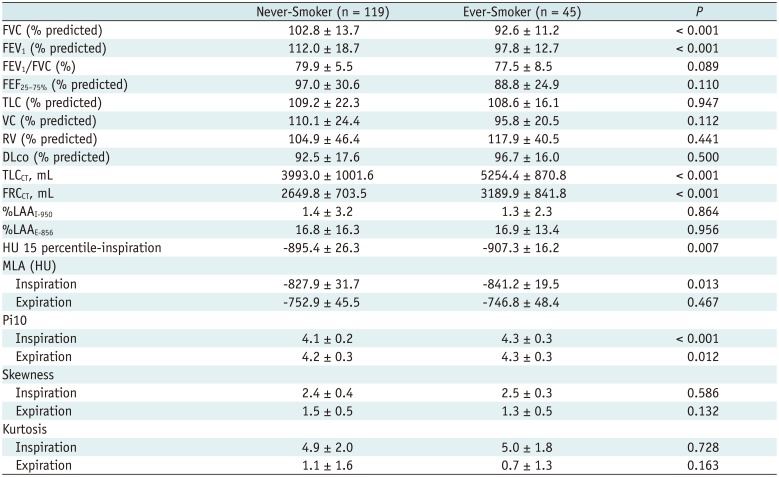
Forty-five subjects were ever-smokers. There were no airflow limitations in the ever-smoker group, but FEV
1 (% predicted) and FVC (% predicted) were significantly greater in the never-smoker group (
p < 0.001) (
Table 3). The MLA and HU 15th percentile on inspiratory QCT were significantly lower in the ever-smoker group than in the never-smoker group (
p < 0.05); however, %LAA
I-950 and %LAA
E-856 were not significantly different between the two groups (
p = 0.864 and 0.956, respectively). The values of airway measurements of Pi10 in the ever-smoker group were 4.29 ± 0.29 mm on inspiratory QCT and 4.29 ± 0.28 mm on expiratory QCT, and both were significantly greater in the ever-smoker group than in the never-smoker group (
p < 0.05) (
Fig. 1). TLC
CT and FRC
CT were greater in the ever-smoker group than in the never-smoker group (
p < 0.001). Skewness and kurtosis as measured by QCT were not significantly different between the two groups (
p > 0.05).
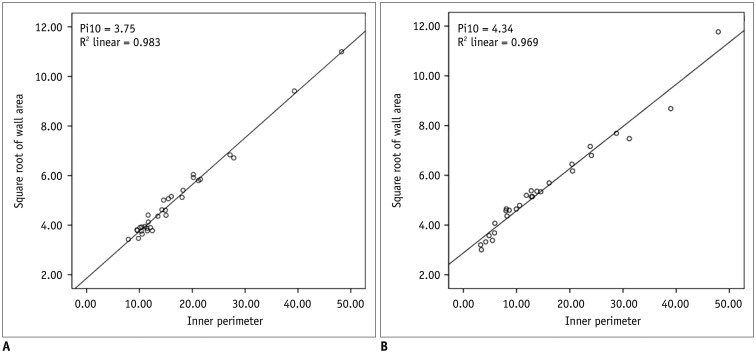 | Fig. 1
Relationship between inner perimeter (Pi) and square root of wall area (WA) on inspiratory quantitative CT.
A. 46-year-female never-smoker. B. 53-year-old man who had 30 pack year history. Slope of straight relationship between Pi and square root of WA is calculated and values of square root of WA at designated Pi10 between never-smoker and heavy smoker are 3.75 and 4.34, respectively. Pi10 = Pi of 10 mm

|
Table 3
Comparison between Never-Smoker and Ever-Smoker Group Regarding QCT and PFT
|
Never-Smoker (n = 119) |
Ever-Smoker (n = 45) |
P
|
|
FVC (% predicted) |
102.8 ± 13.7 |
92.6 ± 11.2 |
< 0.001 |
|
FEV1 (% predicted) |
112.0 ± 18.7 |
97.8 ± 12.7 |
< 0.001 |
|
FEV1/FVC (%) |
79.9 ± 5.5 |
77.5 ± 8.5 |
0.089 |
|
FEF25–75% (% predicted) |
97.0 ± 30.6 |
88.8 ± 24.9 |
0.110 |
|
TLC (% predicted) |
109.2 ± 22.3 |
108.6 ± 16.1 |
0.947 |
|
VC (% predicted) |
110.1 ± 24.4 |
95.8 ± 20.5 |
0.112 |
|
RV (% predicted) |
104.9 ± 46.4 |
117.9 ± 40.5 |
0.441 |
|
DLco (% predicted) |
92.5 ± 17.6 |
96.7 ± 16.0 |
0.500 |
|
TLCCT, mL |
3993.0 ± 1001.6 |
5254.4 ± 870.8 |
< 0.001 |
|
FRCCT, mL |
2649.8 ± 703.5 |
3189.9 ± 841.8 |
< 0.001 |
|
%LAAI-950
|
1.4 ± 3.2 |
1.3 ± 2.3 |
0.864 |
|
%LAAE-856
|
16.8 ± 16.3 |
16.9 ± 13.4 |
0.956 |
|
HU 15 percentile-inspiration |
−895.4 ± 26.3 |
−907.3 ± 16.2 |
0.007 |
|
MLA (HU) |
|
|
|
|
Inspiration |
−827.9 ± 31.7 |
−841.2 ± 19.5 |
0.013 |
|
Expiration |
−752.9 ± 45.5 |
−746.8 ± 48.4 |
0.467 |
|
Pi10 |
|
|
|
|
Inspiration |
4.1 ± 0.2 |
4.3 ± 0.3 |
< 0.001 |
|
Expiration |
4.2 ± 0.3 |
4.3 ± 0.3 |
0.012 |
|
Skewness |
|
|
|
|
Inspiration |
2.4 ± 0.4 |
2.5 ± 0.3 |
0.586 |
|
Expiration |
1.5 ± 0.5 |
1.3 ± 0.5 |
0.132 |
|
Kurtosis |
|
|
|
|
Inspiration |
4.9 ± 2.0 |
5.0 ± 1.8 |
0.728 |
|
Expiration |
1.1 ± 1.6 |
0.7 ± 1.3 |
0.163 |
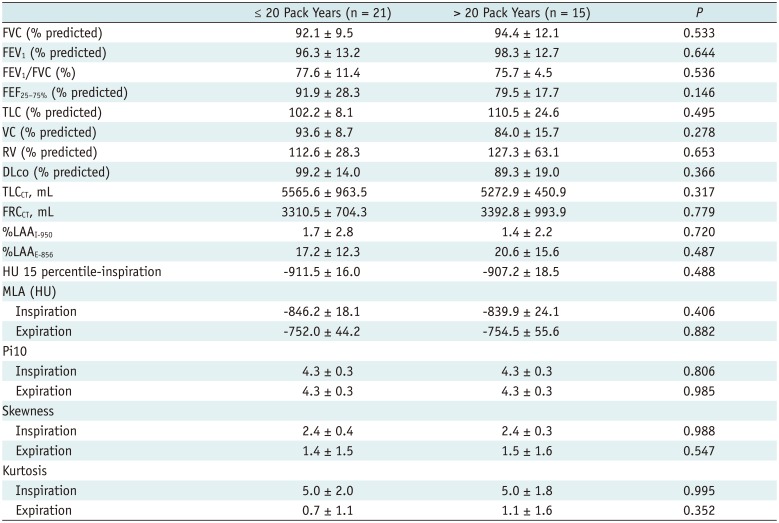
Comparisons of QCT and PFT Measurements According to Smoking Intensity
The mean number of smoking pack-years in the ever-smoker group was 22.2 ± 15.1 years.
Table 4 shows comparisons of the QCT and PFT measurements according to smoking intensity between the two subgroups divided by mean smoking pack years (cutoff, 20 years) among ever-smokers. All lung attenuation parameters, airway parameters, TLC
CT, and FRC
CT were not significantly different according to smoking intensity (all
p > 0.05).
Table 4
Comparisons of QCT and PFT Measurements Grouped by Smoking Intensity
|
≤ 20 Pack Years (n = 21) |
> 20 Pack Years (n = 15) |
P
|
|
FVC (% predicted) |
92.1 ± 9.5 |
94.4 ± 12.1 |
0.533 |
|
FEV1 (% predicted) |
96.3 ± 13.2 |
98.3 ± 12.7 |
0.644 |
|
FEV1/FVC (%) |
77.6 ± 11.4 |
75.7 ± 4.5 |
0.536 |
|
FEF25–75% (% predicted) |
91.9 ± 28.3 |
79.5 ± 17.7 |
0.146 |
|
TLC (% predicted) |
102.2 ± 8.1 |
110.5 ± 24.6 |
0.495 |
|
VC (% predicted) |
93.6 ± 8.7 |
84.0 ± 15.7 |
0.278 |
|
RV (% predicted) |
112.6 ± 28.3 |
127.3 ± 63.1 |
0.653 |
|
DLco (% predicted) |
99.2 ± 14.0 |
89.3 ± 19.0 |
0.366 |
|
TLCCT, mL |
5565.6 ± 963.5 |
5272.9 ± 450.9 |
0.317 |
|
FRCCT, mL |
3310.5 ± 704.3 |
3392.8 ± 993.9 |
0.779 |
|
%LAAI-950
|
1.7 ± 2.8 |
1.4 ± 2.2 |
0.720 |
|
%LAAE-856
|
17.2 ± 12.3 |
20.6 ± 15.6 |
0.487 |
|
HU 15 percentile-inspiration |
-911.5 ± 16.0 |
-907.2 ± 18.5 |
0.488 |
|
MLA (HU) |
|
|
|
|
Inspiration |
-846.2 ± 18.1 |
-839.9 ± 24.1 |
0.406 |
|
Expiration |
-752.0 ± 44.2 |
-754.5 ± 55.6 |
0.882 |
|
Pi10 |
|
|
|
|
Inspiration |
4.3 ± 0.3 |
4.3 ± 0.3 |
0.806 |
|
Expiration |
4.3 ± 0.3 |
4.3 ± 0.3 |
0.985 |
|
Skewness |
|
|
|
|
Inspiration |
2.4 ± 0.4 |
2.4 ± 0.3 |
0.988 |
|
Expiration |
1.4 ± 1.5 |
1.5 ± 1.6 |
0.547 |
|
Kurtosis |
|
|
|
|
Inspiration |
5.0 ± 2.0 |
5.0 ± 1.8 |
0.995 |
|
Expiration |
0.7 ± 1.1 |
1.1 ± 1.6 |
0.352 |
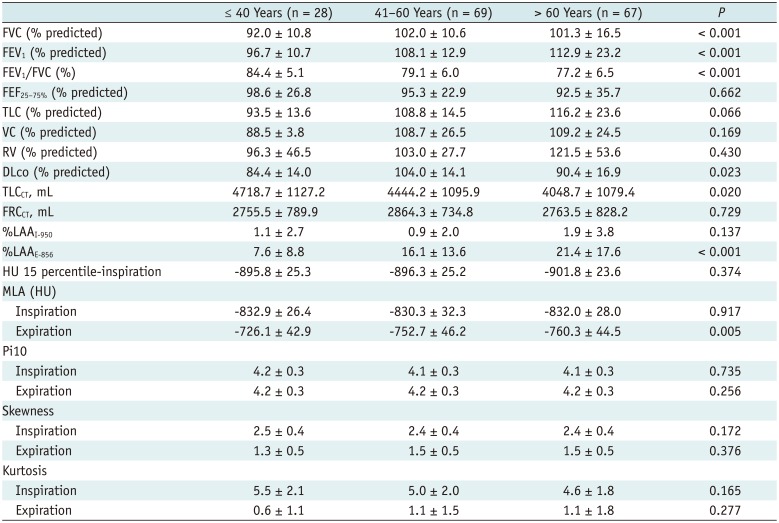
Comparisons of QCT and PFT Measurements According to Age
Table 5 shows the results of QCT and PFT measurements according to the age range in all subjects. With an advancement in age, there was tendency towards airflow limitation, and FEV
1 (% predicted), FVC (% predicted), and FEV
1/FVC were significantly different among the three age groups (
p < 0.001). %LAA
E-856 gradually increased significantly. However, Pi10 did not change significantly with age. TLC
CT gradually decreased as the age increased (
p < 0.05).
Table 5
Comparisons of QCT and PFT Measurements Grouped by Age
|
≤ 40 Years (n = 28) |
41–60 Years (n = 69) |
> 60 Years (n = 67) |
P
|
|
FVC (% predicted) |
92.0 ± 10.8 |
102.0 ± 10.6 |
101.3 ± 16.5 |
< 0.001 |
|
FEV1 (% predicted) |
96.7 ± 10.7 |
108.1 ± 12.9 |
112.9 ± 23.2 |
< 0.001 |
|
FEV1/FVC (%) |
84.4 ± 5.1 |
79.1 ± 6.0 |
77.2 ± 6.5 |
< 0.001 |
|
FEF25–75% (% predicted) |
98.6 ± 26.8 |
95.3 ± 22.9 |
92.5 ± 35.7 |
0.662 |
|
TLC (% predicted) |
93.5 ± 13.6 |
108.8 ± 14.5 |
116.2 ± 23.6 |
0.066 |
|
VC (% predicted) |
88.5 ± 3.8 |
108.7 ± 26.5 |
109.2 ± 24.5 |
0.169 |
|
RV (% predicted) |
96.3 ± 46.5 |
103.0 ± 27.7 |
121.5 ± 53.6 |
0.430 |
|
DLco (% predicted) |
84.4 ± 14.0 |
104.0 ± 14.1 |
90.4 ± 16.9 |
0.023 |
|
TLCCT, mL |
4718.7 ± 1127.2 |
4444.2 ± 1095.9 |
4048.7 ± 1079.4 |
0.020 |
|
FRCCT, mL |
2755.5 ± 789.9 |
2864.3 ± 734.8 |
2763.5 ± 828.2 |
0.729 |
|
%LAAI-950
|
1.1 ± 2.7 |
0.9 ± 2.0 |
1.9 ± 3.8 |
0.137 |
|
%LAAE-856
|
7.6 ± 8.8 |
16.1 ± 13.6 |
21.4 ± 17.6 |
< 0.001 |
|
HU 15 percentile-inspiration |
-895.8 ± 25.3 |
-896.3 ± 25.2 |
-901.8 ± 23.6 |
0.374 |
|
MLA (HU) |
|
|
|
|
|
Inspiration |
-832.9 ± 26.4 |
-830.3 ± 32.3 |
-832.0 ± 28.0 |
0.917 |
|
Expiration |
-726.1 ± 42.9 |
-752.7 ± 46.2 |
-760.3 ± 44.5 |
0.005 |
|
Pi10 |
|
|
|
|
|
Inspiration |
4.2 ± 0.3 |
4.1 ± 0.3 |
4.1 ± 0.3 |
0.735 |
|
Expiration |
4.2 ± 0.3 |
4.2 ± 0.3 |
4.2 ± 0.3 |
0.256 |
|
Skewness |
|
|
|
|
|
Inspiration |
2.5 ± 0.4 |
2.4 ± 0.4 |
2.4 ± 0.4 |
0.172 |
|
Expiration |
1.3 ± 0.5 |
1.5 ± 0.5 |
1.5 ± 0.5 |
0.376 |
|
Kurtosis |
|
|
|
|
|
Inspiration |
5.5 ± 2.1 |
5.0 ± 2.0 |
4.6 ± 1.8 |
0.165 |
|
Expiration |
0.6 ± 1.1 |
1.1 ± 1.5 |
1.1 ± 1.8 |
0.277 |
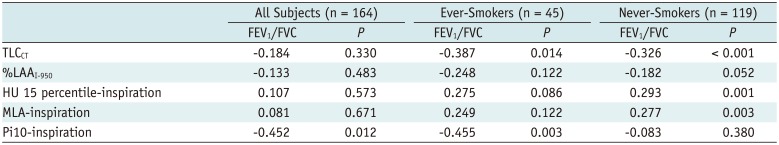
Correlation of QCT and PFT Measurements after Adjustment for Age and Smoking Intensity
According to the partial correlation coefficient analysis after adjustment for age and smoking intensity, only Pi10 on inspiration was significantly correlated with FEV
1/FVC (
r = −0.452,
p = 0.012) in all subjects and with FEV
1/FVC (
r = −0.455,
p = 0.003) in ever-smokers. However, Pi10 on inspiration in never-smokers did not correlate with FEV
1/FVC (
Table 6).
Table 6
Correlation between FEV1/FVC and QCT Parameters
|
All Subjects (n = 164) |
Ever-Smokers (n = 45) |
Never-Smokers (n = 119) |
|
FEV1/FVC |
P
|
FEV1/FVC |
P
|
FEV1/FVC |
P
|
|
TLCCT
|
−0.184 |
0.330 |
−0.387 |
0.014 |
−0.326 |
< 0.001 |
|
%LAAI-950
|
−0.133 |
0.483 |
−0.248 |
0.122 |
−0.182 |
0.052 |
|
HU 15 percentile-inspiration |
0.107 |
0.573 |
0.275 |
0.086 |
0.293 |
0.001 |
|
MLA-inspiration |
0.081 |
0.671 |
0.249 |
0.122 |
0.277 |
0.003 |
|
Pi10-inspiration |
−0.452 |
0.012 |
−0.455 |
0.003 |
−0.083 |
0.380 |
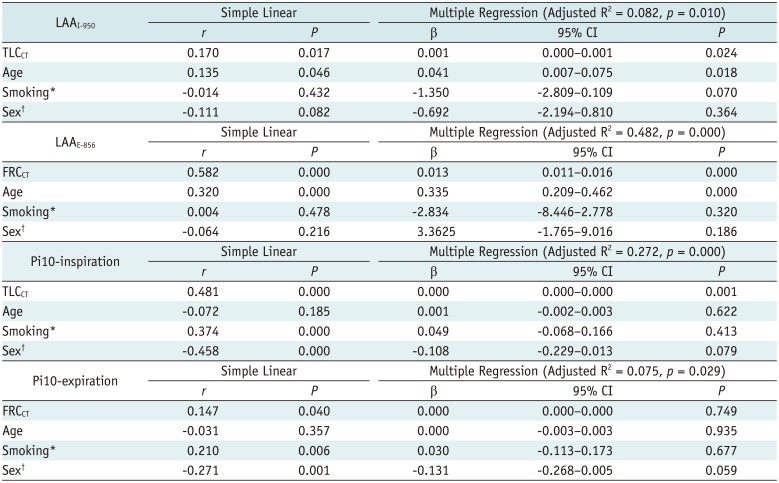
Independent Predictive Variables for Lung Attenuation and Airway Parameters
In simple and multivariate regression analyses, TLC
CT and age, and FRC
CT and age showed a significant relationship with LAA
I-950 and LAA
E-856, respectively, and they were independent predictive variables for lung attenuation (all
p < 0.05); however, there were no association with history of smoking or sex groups (
p > 0.05) (
Table 7). Although inspiratory Pi10 showed a significant relationship with TLC
CT, sex, and history of smoking in the simple linear regression model, only TLC
CT was significantly associated with inspiratory Pi10 in multiple regression analysis (
p = 0.001). None of these parameters were associated with expiratory Pi10 in multiple regression analysis (all
p > 0.05).
Table 7
Simple and Multiple Regression Analyses for Lung Attenuation and Airway Parameters
|
LAAI-950
|
Simple Linear |
Multiple Regression (Adjusted R2 = 0.082, p = 0.010) |
|
r
|
P
|
β |
95% CI |
P
|
|
TLCCT
|
0.170 |
0.017 |
0.001 |
0.000–0.001 |
0.024 |
|
Age |
0.135 |
0.046 |
0.041 |
0.007–0.075 |
0.018 |
|
Smoking*
|
−0.014 |
0.432 |
−1.350 |
−2.809–0.109 |
0.070 |
|
Sex†
|
−0.111 |
0.082 |
−0.692 |
−2.194–0.810 |
0.364 |
|
LAAE-856
|
Simple Linear |
Multiple Regression (Adjusted R2 = 0.482, p = 0.000) |
|
r
|
P
|
β |
95% CI |
P
|
|
FRCCT
|
0.582 |
0.000 |
0.013 |
0.011–0.016 |
0.000 |
|
Age |
0.320 |
0.000 |
0.335 |
0.209–0.462 |
0.000 |
|
Smoking*
|
0.004 |
0.478 |
−2.834 |
−8.446–2.778 |
0.320 |
|
Sex†
|
−0.064 |
0.216 |
3.3625 |
−1.765–9.016 |
0.186 |
|
Pi10-inspiration |
Simple Linear |
Multiple Regression (Adjusted R2 = 0.272, p = 0.000) |
|
r
|
P
|
β |
95% CI |
P
|
|
TLCCT
|
0.481 |
0.000 |
0.000 |
0.000–0.000 |
0.001 |
|
Age |
−0.072 |
0.185 |
0.001 |
−0.002–0.003 |
0.622 |
|
Smoking*
|
0.374 |
0.000 |
0.049 |
−0.068–0.166 |
0.413 |
|
Sex†
|
−0.458 |
0.000 |
−0.108 |
−0.229–0.013 |
0.079 |
|
Pi10-expiration |
Simple Linear |
Multiple Regression (Adjusted R2 = 0.075, p = 0.029) |
|
r
|
P
|
β |
95% CI |
P
|
|
FRCCT
|
0.147 |
0.040 |
0.000 |
0.000–0.000 |
0.749 |
|
Age |
−0.031 |
0.357 |
0.000 |
−0.003–0.003 |
0.935 |
|
Smoking*
|
0.210 |
0.006 |
0.030 |
−0.113–0.173 |
0.677 |
|
Sex†
|
−0.271 |
0.001 |
−0.131 |
−0.268–0.005 |
0.059 |
Go to :
DISCUSSION
This study provides normal values for QCT parameters of the lungs and airways in Korean never-smokers and ever-smokers with normal spirometry and visually normal chest CT results. There were differences in lung attenuation values and airway parameters according to sex, smoking history, and age; however, there were no differences in smoking intensity among normal subjects. Among the QCT parameters, only inspiratory Pi10 showed a negative correlation with the FEV1/FVC ratio in normal subjects. Furthermore, only status of lung volume and age showed significant associations with inspiratory and expiratory lung attenuation. Also, lung volume itself influenced inspiratory Pi10, whereas expiratory Pi10 was not associated with lung volume, age, sex, or smoking history.
In a previous research regarding QCT of the lungs and airways in healthy nonsmoking adults, sex differences in the values of inspiratory TLC
CT, expiratory FRC
CT, and MLA were similar to the present results (
10). The previously reported mean %LAA
I-950 and %LAA
E-856 were 2.0 and 9.2%, respectively, and significant differences were observed according to gender. Although %LAA
E-856 (17.9% in men and 15.9% in women) in our study was much greater than that in the previous study, %LAA
I-950 values in men (1.78%) and women (1.10%) were compatible to those found in the previous study, and there were no significant sex differences in %LAA
I-950 and %LAA
E-856. However, we found a significant difference in the HU 15th percentile between males (-908 HU) and females (-891 HU). Indeed, even with the inclusion of ever-smokers in our study and even only in never-smokers, there were no significant sex differences in %LAA
I-950 and %LAA
E-856, but the HU 15th percentile in men was significantly lower than that in women. This finding differs from the results of the previous study. In normal Koreans, we should consider the sex difference in HU 15th percentile in addition to MLA.
With respect to the airway parameters of inspiratory and expiratory Pi10 in normal subjects, these values were not mentioned in the previous study (
10). In our study, we tried to suggest the absolute value of Pi10 in Korean normal subjects and our results suggest that the Pi10 value in normal Korean male subjects is significantly greater than that in normal Korean female subjects.
On comparing QCT parameters between the never-smoker and ever-smoker groups, it was found that the values of MLA and HU 15th percentile in the ever-smoker group were significantly lower than those in the never-smoker group. Inspiratory and expiratory Pi10 values were also significantly greater in the ever-smoker group than in the never-smoker group. However, %LAAI-950 and %LAAE-856 were not different between the two groups. We speculate that, even in normal subjects with normal spirometry and visually normal chest CT results, smoking influences lung attenuation and airway remodeling. Furthermore, interestingly, although smoking history itself was found to affect lung attenuation and airway remodeling, smoking intensity did not result in any differences in these parameters. We speculate that smoking itself rather than smoking intensity has a greater influence on lung attenuation and airway remodeling in QCT measurements of normal subjects.
In our normal subjects, MLA
exp was significantly lower and %LAA
E-856 was significantly higher as the subjects got older, whereas MLA
ins and %LAA
I-950 were not significantly different according to age. These results are similar to those reported previously (
10). In normal subjects, expiratory lung attenuation may be a useful tool for monitoring the normal aging process in the lung tissue. However, Pi10 did not show any significant change according to age.
In our regression analyses, change in lung attenuation measurements on inspiration and expiration were dependent on age and on TLC
CT and FRC
CT. These findings are similar to those of previous studies, which showed up to a 1% increase per year in inspiratory %LAA and a significant correlation with age (
122223). However, in airway measurements obtained in our study, TLC
CT showed a strong association with inspiratory Pi10 and it showed no association with expiratory Pi10. This finding may support the notion that the depth or degree of inspiration affects the measurement of airway walls; therefore, expiratory Pi10 is a good independent measure for airway assessment. Moreover, in our study, Pi10 showed a significant correlation with FEV
1/FVC.
Our study has some limitations. First, we did not consider the patients' physical size during CT scans performed using fixed mAs, which may have produced different noise levels during QCT measurements. Second, although there was a significant gender difference in PFT results and QCT measurements between males and females among all subjects and even only in never-smokers, we included a lesser number of ever-smokers (n = 45) than never-smokers (n = 119) and a much higher proportion of male smokers, which may have produced errors while evaluating the influence of smoking in a large cohort. However, we attempted to measure and compare the QCT parameters of the lungs and airways and to demonstrate the effect of smoking in Korean subjects with normal spirometry and visually normal chest CT scans. Third, inter- and intra-CT scanner variation is also a major factor that could have introduced QCT measurement error.
In this study, in Korean subjects with normal spirometry and visually normal chest CT results, there were significant differences in QCT parameters according to sex, age, and smoking history. The most influential factors for QCT measurements were age and status of lung volume.
Go to :


 PDF
PDF ePub
ePub Citation
 Print
Print


 XML Download