INTRODUCTION
Brain metastases are the most common intracranial tumors in adults. They occur in about 20–40% of patients with primary malignancy (
123). The number of metastases is a critical prognostic factor as patients with a large number of brain metastases have earlier disease progression and poorer prognosis as compared to those with a smaller number of metastases or no metastases (
2456). Moreover, therapeutic strategies are implemented only after considering the number of brain metastases: a single metastasis may be treated with surgery, while small metastases may be treated with stereotactic radiosurgery if they are less than four in number. Multiple metastases are treated by providing whole-brain radiation (
25789). Therefore, an early and accurate diagnosis of brain metastases is crucial in pretreatment staging.
Contrast-enhanced 3D T1-weighted gradient-echo imaging (3D-GRE) is an imaging technique that is normally used to diagnose brain metastases (
21011). However, it is difficult to differentiate between enhancing metastases and normal blood vessels with 3D-GRE, since contrast materials remain in both blood and tumor parenchyma (
212). Therefore, to selectively suppress blood vessel signals, black-blood imaging technique such as motion-sensitized driven-equilibrium (MSDE) or improved MSDE (iMSDE) preparation is implemented along with contrast-enhanced 3D T1-weighted turbo-spin echo imaging (MSDE- or iMSDE-TSE) (
213141516). MSDE- or iMSDE preparation is a black-blood imaging technique in which motion-sensitizing gradient pairs are used for phase dispersion among moving spins. Thus, flowing blood signals are suppressed with this technique (
1718). Many previous studies have proved that small brain metastases can be effectively detected with MSDE or iMSDE-TSE (
2131415).
In this study, we implemented iMSDE-TSE with maximum intensity projection (MIP) reconstruction. It is well-known that MIP reconstruction is effective in detecting small lesions. Moreover, it is a less time-consuming method as it reduces the number of images to be reviewed by radiologists (
19202122). Despite the incremental benefit of MIP, few studies have investigated whether MIP could be used in magnetic resonance imaging (MRI) for the detection of brain metastases, especially iMSDE-TSE. We hypothesized that MIP reconstruction should be applied to iMSDE-TSE as it would further improve the detection of small brain metastases and the reading performance of radiologists. Thus, the purpose of our study is to evaluate whether 5-mm MIP reconstruction in iMSDE-TSE (MIP iMSDE-TSE) would improve the detection of brain metastases. The diagnostic images of 5-mm MIP iMSDE-TSE were compared with 1-mm images of iMSDE-TSE (non-MIP iMSDE-TSE), 1-mm 3D-GRE (non-MIP 3D-GRE), and 5-mm MIP 3D-GRE.
Go to :

MATERIALS AND METHODS
Patients
The Institutional Review Board of our hospital approved this retrospective study and waived written informed consent. From October 2014 to July 2015, we evaluated 65 patients (26 male, 39 female; age range: 18–86 years; mean age: 55.2 years) with primary malignancies other than brain tumors. Brain MRI, including 3D-GRE and iMSDE-TSE, were performed to evaluate brain metastases in these patients. Among these subjects, there were 30 patients (12 male, 18 female; age range: 28–77 years; mean age: 60.6 years) with enhancing lesions in brain parenchyma. The diagnosis was done by a board-certified neuroradiologist with nine years of experience. However, the neuroradiologist did not participate in the observer study. All the patients had to undergo at least 1 follow-up MRI. These patients had different types of primary tumors, such as lung cancer (n = 26), breast cancer (n = 2), ovary cancer (n = 1), and rectal cancer (n = 1).
MRI Protocol
We performed MRI using 3T MR scanner (Ingenia, Philips Healthcare, Best, the Netherlands), which was equipped with 32-channel sensitivity encoding head coil. Thereafter, we performed non-MIP 3D-GRE under following conditions: field-of-view (FOV), 240 × 240 mm
2; acquisition matrix, 240 × 240; slice thickness, 1 mm; number of excitation (NEX), 1; repetition time (TR), 8.5 msec; echo time (TE), 4.6 msec; flip angle, 8°; scan time, 4 minutes. Based on the scheme “magnetization transfer prepared spin echo”–like contrast volume examination proposed by Yoneyama et al. (
14), we implemented the black-blood imaging technique iMSDE-TSE. In this technique, we used a combination of iMSDE preparation and 3D low refocusing flip-angle TSE sequence. To construct iMSDE pre-pulse, we used motion-sensitizing gradients between the following radiofrequency pulses: 90° excitation pulse, two 180° refocusing pulses, and a 90° flip-back pulse (
17). In addition, bipolar gradients were inserted in front of the 90° excitation pulse to compensate eddy currents (
14). The parameters for implementing non-MIP iMSDE-TSE were as follows: FOV, 240 × 240 mm
2; acquisition matrix, 240 × 240; slice thickness, 1 mm; NEX, 1; TR, 450 msec; TE, 18 msec; flip angle, 8°; echo train length, 30; and scan time, 3 minutes and 30 seconds. The iMSDE preparation was completed in 17 msec. Gradient pulses were produced with a flow velocity encoding of 1 cm/sec. For contrast enhancement, 0.1 mmol/kg of gadobutrol (Gadovist®, Bayer Healthcare, Berlin, Germany)was intravenously injected as a bolus. Two minutes after the injection, we scanned 19 patients with non-MIP 3D-GRE. Seven minutes after the injection, we scanned them with non-MIP iMSDE-TSE. Then, the scan order was reversed for the remaining 11 patients: we scanned them with non-MIP iMSDE-TSE two minutes after the injection. Then, we scanned them with non-MIP 3D-GRE about seven minutes after the injection. Other pre-contrast sequences, including T1-weighted imaging, T2-weighted imaging, and fluid-attenuated inversion recovery imaging, were also performed according to our institute's routine protocol for patients with clinically suspected brain metastases.
After MRI scanning, MIP reconstruction was done with a 5-mm-thick slab in MIP 3D-GRE. On the other hand, MIP reconstruction was done without overlapping or slice gap in MIP iMSDE-TSE. The resulting images were subsequently transferred to picture archiving and communication system for image review.
Reference Standard for Brain Metastases
The scanned images obtained using non-MIP 3D-GRE and non-MIP iMSDE-TSE were used to determine brain metastases. If necessary, pre-contrast images were used for diagnosis. A neuroradiologist reviewed the initial and follow-up MRIs of included patients to diagnose brain metastases. The neuroradiologist did not participate in the observer study but had nine of experience. The diagnostic criteria of brain metastases were as follows: 1) the appearance of different enhancing lesions, including nodular enhancing lesions, ring enhancing lesions, lesions with peritumoral edema, and enhancing lesions without continuity (vascular structures), and 2) an interval change in the size of lesions in follow-up imaging, including an increase in size, a decrease in size, or complete disappearance after treatment. Leptomeningeal seeding, artifacts, and enhancing vessels were excluded from analysis by carefully comparing the initial and follow-up images.
Imaging Analysis
We included two board-certified neuroradiologists with seven and 17 years of experience, respectively. They were blinded to the clinical information of patients, including the diagnosis of brain metastases. Both of them participated in the observer study.
First, each reader reviewed non-MIP 3D-GRE scans and indicated enhancing lesions other than the suspected leptomeningeal seeding with arrows on scanned images of each patient. After indicating lesions, the readers assigned each lesion with a confidence level on a 5-point scale: 1, definitely not metastasis; 2, probably not metastasis; 3, probable metastasis; and 4, definite metastasis. If an enhancing lesion was only detected by one reader and not by the other reader, the lesion was assigned with a scale 0 (fail to detect) for the latter reader. After rating the confidence level, the readers deleted the arrows indicating enhancing lesions in images. Next, the readers reviewed non-MIP iMSDE-TSE, MIP 3D-GRE, and MIP iMSDE-TSE scans one after the other, but a time gap of at least one month was maintained between two reviews. The enhancing lesions were marked with arrows and assigned with a confidence level according to the aforementioned method.
All the images of 30 patients were displayed on a 21-inch LCD monitor. The readers reviewed these images in three imaging planes (axial, coronal, and sagittal) on the LCD monitor. The readers were allowed to freely enlarge sections of images using a mouse wheel. They were also allowed to adjust the window level, window width, and magnification. During each reading session, the time required for the review was recorded.
Statistical Analysis
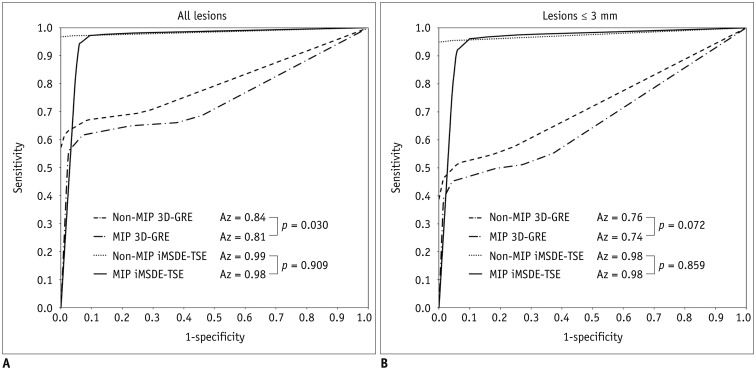
Jackknife alternative free-response receiver operating characteristic (JAFROC) analysis was performed to evaluate the reading performance of radiologists in the observer study (
2324). This analysis is used to statistically estimate the differences in the diagnostic performance of different modalities when location issues are relevant (
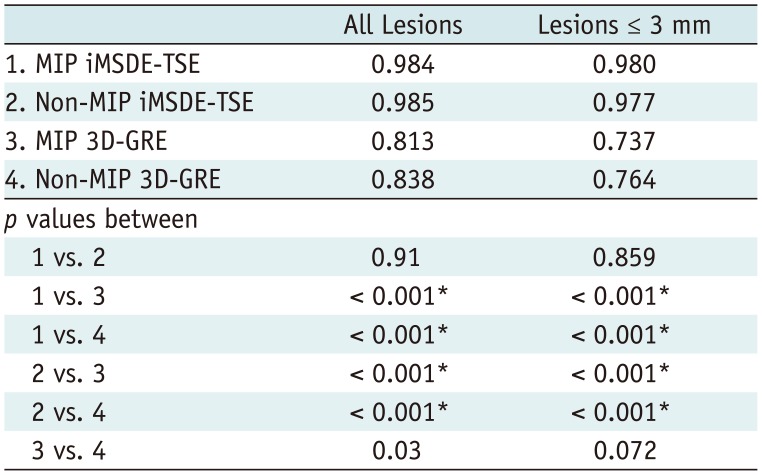
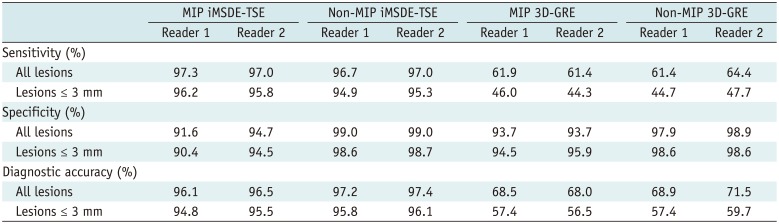
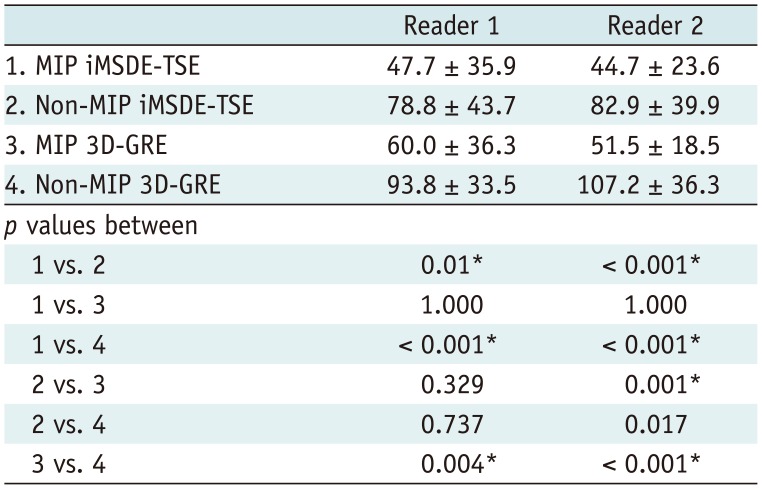
22324). The diagnostic performances of four sequences (non-MIP and MIP 3D-GREs, non-MIP, and MIP iMSDE-TSEs) were determined using figure of merit (FOM) values derived from JAFROC analysis. The sensitivity, specificity, and diagnostic accuracy were also calculated in each sequence. For this calculation, lesions assigned with a confidence level of 3 or 4 were classified as true-positive lesions, whereas lesions with a confidence level of 0, 1, or 2 were classified as false-negative lesions. Lesions other than true metastases assigned with a confidence level of 3 or 4 were considered as false-positive, while those with a confidence level of 0, 1, or 2 were considered as true-negative. The sensitivity of each sequence was compared using McNemar chi-square test. Reading time of each sequence was compared by conducting one-way ANOVA test followed by subgroup analysis with Bonferroni correction. For detecting brain metastases in each sequence, interobserver agreement was implemented with Cohen kappa (κ) statistics. If κ value > 0.75, there is an excellent agreement between observers. If κ value is in the range of 0.40 to 0.75, there is fair to good agreement between observers. But if κ value < 0.40, there is poor agreement between observers.
All the statistical analyses were performed twice by including all the lesions. These lesions had a maximal diameter ≤ 3 mm. The results were considered to be statistically significant when
p < 0.05. A free software package (JAFROC1,
http://www.devchakraborty.com) was used to perform JAFROC analysis, but other statistical analyses were performed using SPSS software (version 17.0, SPSS Inc., Chicago, IL, USA).
Go to :
DISCUSSION
In this study, we evaluated whether 5-mm MIP reconstruction of 1-mm thin-section of iMSDE-TSE was useful in improving the diagnosis of brain metastases. Our results indicate that the sensitivity and FOM value of MIP iMSDE-TSE were comparable to those of non-MIP iMSDE-TSE but were superior to non-MIP and MIP 3D-GREs. The same result was derived from the evaluation of small lesions ≤ 3 mm. Moreover, the reading time for MIP images was significantly lower than that of non-MIP images; however, interobserver agreement was excellent in both MIP and non-MIP images. Therefore, we conclude that MIP iMSDE-TSE can improve the reading performance of radiologists without compromising the high detectability of non-MIP iMSDE-TSE, which is higher than that of non-MIP 3D-GRE.
Many advanced MRI techniques have been proposed to solve the diagnostic problems associated with conventional imaging of brain tumors (
25). Among them, iMSDE-TSE is well-known for its high detectability of brain metastases, so it is mostly used to detect small lesions (
213141516). iMSDE preparation improves contrast-to-noise ratio (CNR) between the vessel lumen and the adjacent tissue by selectively suppressing the flow of blood (
14). By adding extra 180° refocusing pulses, iMSDE preparation also compensates signal loss, which was the limitation of a former MSDE preparation (
1718). Therefore, iMSDE-TSE has a higher ability to differentiate small-sized tumors. Thus, its detectability of brain metastases is higher than that of 3D-GRE (
13141516). In addition, Nagao et al. (
2) have reported that MSDE-TSE improves the reading performance of radiologists as the reading time of this imaging technique is shorter than that of 3D-GRE.
In iMSDE-TSE, the number of images to be reviewed by radiologists is greater, so as the likelihood of tedious fatigue and perceptual error increases. As a result, reading efficiency of radiologists may decrease with iMSDE-TSE (
1921). Nevertheless, post-processing techniques such as MIP have been successfully used to further improve the reading performance of radiologists. They are mainly used to detect small pulmonary nodules, hepatic lesions, or peritoneal metastases in computed tomography (CT) scans (
19202122262728). This is because MIP reduces the number of images to be reviewed by radiologists, and it also enhances the conspicuity of structures that are relatively higher in density than the adjacent tissues (
20). Thus, MIP is useful while reviewing numerous thin-slice CT images of multiple patients (
20). Nevertheless, no one has attempted to use MIP reconstruction in MRI for the detection of brain metastases. Only recently, Sepulveda et al. (
29) developed 6-mm MIP reconstruction of 3D-GRE, and they compared its diagnostic performance with non-MIP 3D-GRE. They found that MIP-reconstructed images had a non-significant trend of higher detection of brain metastases, regardless of the lesion size. Moreover, they did not perform MIP reconstruction in iMSDE-TSE, which is already known to be superior to 3D-GRE.
To the best of our knowledge, ours is the first study to evaluate the diagnostic performance of MIP reconstruction images from iMSDE-TSE. We compared these images with those obtained with non-MIP iMSDE-TSE, non-MIP, and MIP 3D-GRE. We adopted a slab of 5 mm thickness by referring to many previous studies in which MIP images were used to evaluate the detection rate of pulmonary nodules (
192126), peritoneal seeding nodules (
20), and brain metastasis (
29). We believed that if the slab was more than 5 mm in thickness, it would create more false-positive findings. Moreover, if the slab was less than 5 mm in thickness, then the reading time would be reduced. As a result, MIP iMSDE-TSE had sensitivity and FOM values comparable to those of non-MIP iMSDE-TSE, but they were significantly higher than those of non-MIP and MIP 3D-GREs. This high detectability of MIP iMSDE-TSE was also observed during the evaluation of small lesions ≤ 3 mm. The high detectability of MIP iMSDE-TSE has been attributed to the following factors: iMSDE preparation selectively suppresses blood vessels and achieves a high CNR, while MIP reconstruction improves the conspicuity of lesions (
Fig. 2). In addition, the number of image slices to be reviewed was significantly smaller in MIP iMSDE-TSE (axial slice number, 30) than in non-MIP iMSDE-TSE (axial slice number, range 140–160). Consequently, the average reading time of MIP iMSDE-TSE was significantly shorter than that of non-MIP iMSDE-TSE. Given the equivalently high detectability of MIP iMSDE-TSE and non-MIP iMSDE-TSE, we conclude that MIP iMSDE-TSE exhibits high diagnostic performance and improves the reading efficiency of radiologists.
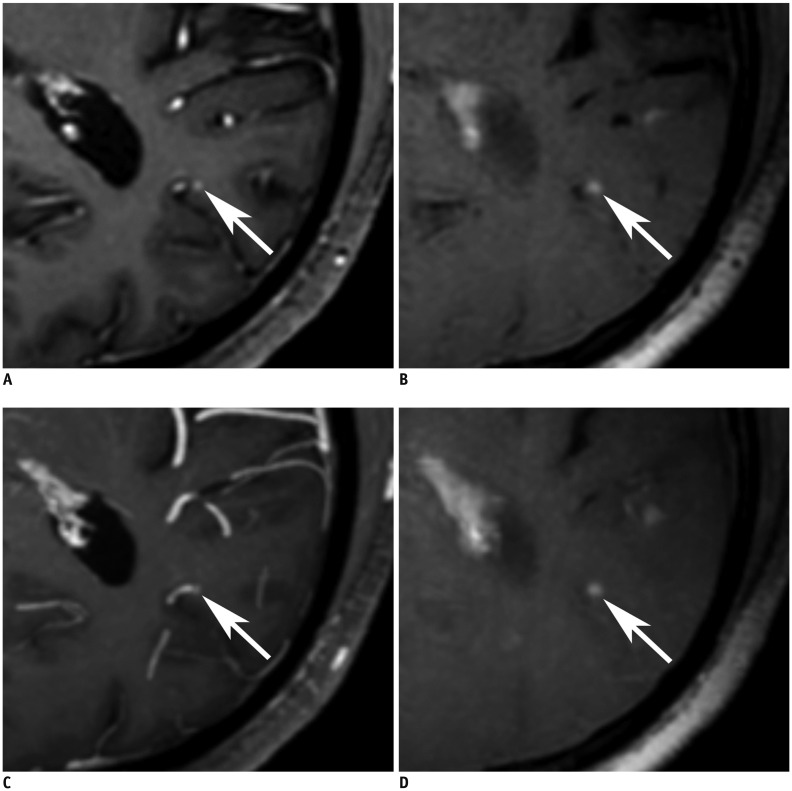
 | Fig. 2
64-year-old male with brain metastases from lung cancer.
Axial image of non-MIP 3D-GRE (A), non-MIP iMSDE-TSE (B), MIP 3D-GRE (C), and MIP iMSDE-TSE (D) shows enhancing metastasis (arrows) of less than 3 mm in left posterior insula. Lesion is evidently visualized in non-MIP and MIP iMSDE-TSE. However, in non-MIP and MIP 3D-GRE, it is difficult to discriminate lesion from adjacent vessel. MIP iMSDE-TSE = maximum intensity projection of improved motion-sensitized driven-equilibrium prepared contrast-enhanced 3D T1-weighted turbo-spin echo imaging, MIP 3D-GRE = maximum intensity projection of contrast-enhanced 3D T1-weighted gradient-echo imaging, non-MIP iMSDE-TSE = 1-mm images of improved motion-sensitized driven-equilibrium prepared contrast-enhanced 3D T1-weighted turbo-spin echo imaging, non-MIP 3D-GRE = 1-mm images of contrast-enhanced 3D T1-weighted gradient-echo imaging

|
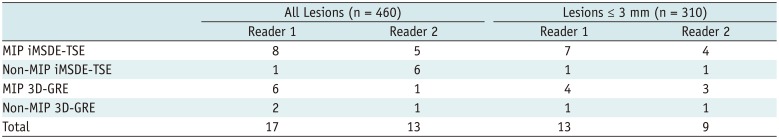
There was a higher incidence of false-positive findings in MIP images (
Table 4). False-positive cases of MIP 3D-GRE mainly included enhancing vessels (
Fig. 3A). On non-MIP 3D-GRE, the reader could trace the vascular structure and differentiate it from true metastasis; however, it was difficult to track the vessel on MIP 3D-GRE. False-positive findings on MIP iMSDE-TSE were attributed to the imperfect suppression of small vessel signals (
Fig. 3B). The number of false-positive findings on non-MIP iMSDE-TSE was much smaller than that reported in a previous study on MSDE techniques (
2). This was because compared to the MSDE preparation in the previous study, iMSDE preparation of this study improved tissue-blood CNR without causing a loss of blood flow (
141618). However, the number of false-positive cases in MIP iMSDE-TSE was slightly greater than that of non-MIP iMSDE-TSE, probably due to the difficulty in differentiating vascular structure on MIP images. Next, extra-axial enhancements in the dura mater or subdural veins appeared as intra-axial lesions on MIP images (
Fig. 3C). We believe this is due to partial volume averaging artifact in MIP reconstruction. Lastly, since the signals from artifacts could be accentuated in both 3D-GRE and iMSDE-TSE images, false-positive findings were obtained in MIP images (
Fig. 3D, E). Therefore, we suggest that MIP iMSDE-TSE should be used in combination with 1-mm sequences for the evaluation of brain metastases.
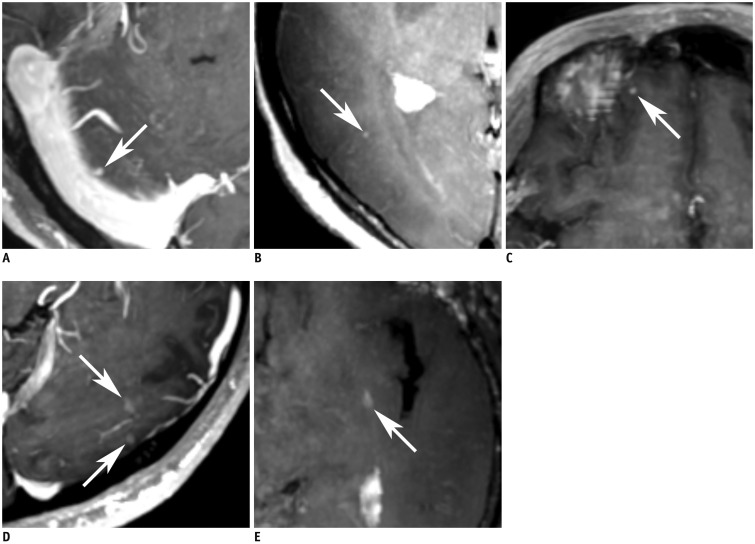 | Fig. 3
Representative false-positive cases.
A. Axial image of MIP 3D-GRE shows nodular enhancing lesion (arrow) in right cerebellum of 62-year-old man. In non-MIP 3D-GRE, enhancing vessel was confirmed (not shown). B. Axial image of MIP iMSDE-TSE shows tiny nodular enhancement (arrow) in right temporo-occipital lobe of 64-year-old woman. It was unsuppressed vascular signal. C. Axial image of MIP 3D-GRE shows focal dural enhancement in form of nodular enhancing lesion (arrow) in right frontal lobe of 60-year-old man. D. Axial image of MIP 3D-GRE probably shows two nodular enhancing lesions (arrows) in left occipital lobe of 26-year-old man. They were confirmed as artifacts in non-MIP 3D-GRE. E. In axial image of MIP iMSDE-TSE, artifactual enhancement is presented as nodular enhancing lesion (arrow) of 75-year-old female. MIP iMSDE-TSE = maximum intensity projection of improved motion-sensitized driven-equilibrium prepared contrast-enhanced 3D T1-weighted turbo-spin echo imaging, MIP 3D-GRE = maximum intensity projection of contrast-enhanced 3D T1-weighted gradient-echo imaging, non-MIP 3D-GRE = 1-mm images of contrast-enhanced 3D T1-weighted gradient-echo imaging
|
Table 4
Numbers of False-Positive Cases According to MRI Techniques
|
All Lesions (n = 460) |
Lesions ≤ 3 mm (n = 310) |
|
Reader 1 |
Reader 2 |
Reader 1 |
Reader 2 |
|
MIP iMSDE-TSE |
8 |
5 |
7 |
4 |
|
Non-MIP iMSDE-TSE |
1 |
6 |
1 |
1 |
|
MIP 3D-GRE |
6 |
1 |
4 |
3 |
|
Non-MIP 3D-GRE |
2 |
1 |
1 |
1 |
|
Total |
17 |
13 |
13 |
9 |

We suggest some modifications in the procedure to improve the differentiation between false-positive and true-positive lesions. First, we can use slice overlapping in MIP reconstruction, because it improves visualization of the lesion and reduces partial volume averaging artifact (
19202129). Next, greater focus is needed to inspect lesions near the skull and to avoid artifacts from dura mater or subdural veins. In addition, we must consider reconstruction of MIP images in a different plane, such as coronal or sagittal. By comparing three plane images, we can increase diagnostic accuracy of the technique.
The diagnostic performance of MIP 3D-GRE was equivalent to that of non-MIP 3D-GRE but was lower than that of MIP and non-MIP iMSDE-TSEs. Since MIP images show only the highest signal voxels along the lines projected in volume data (
29), we speculate that the summation of signals representing enhanced blood vessels may obscure brain metastases (
Fig. 4). Consequently, it would be difficult to identify true lesions on 5-mm thick slice. Due to this difficulty and false-positive findings, MIP 3D-GRE may not be suitable for the detection of brain metastases.
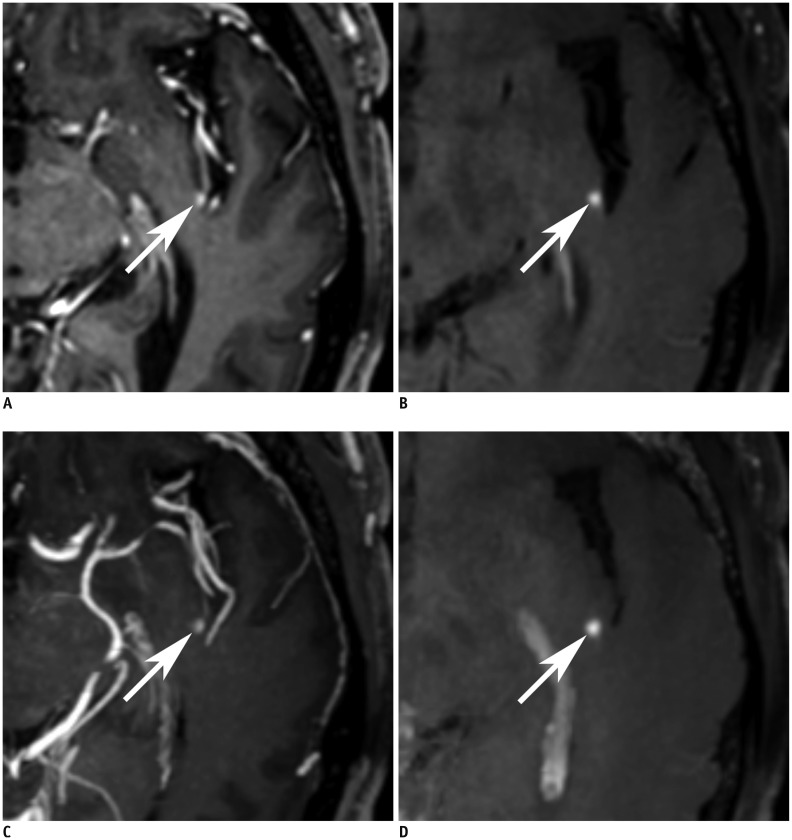
 | Fig. 4
73-year-old male with brain metastases from lung cancer.
Axial image of non-MIP 3D-GRE (A), non-MIP iMSDE-TSE (B), MIP 3D-GRE (C), and MIP iMSDE-TSE (D) shows enhancing metastasis (arrows) of less than 3 mm in left occipital lobe. Lesion is clearly seen in non-MIP and MIP iMSDE-TSE, and it can be distinguished in non-MIP 3D-GRE. On other hand, lesion is masked by summation of vascular enhancement in MIP 3D-GRE. MIP iMSDE-TSE = maximum intensity projection of improved motion-sensitized driven-equilibrium prepared contrast-enhanced 3D T1-weighted turbo-spin echo imaging, MIP 3D-GRE = maximum intensity projection of contrast-enhanced 3D T1-weighted gradient-echo imaging, non-MIP iMSDE-TSE = 1-mm images of improved motion-sensitized driven-equilibrium prepared contrast-enhanced 3D T1-weighted turbo-spin echo imaging, non-MIP 3D-GRE = 1-mm images of contrast-enhanced 3D T1-weighted gradient-echo imaging
|
Our study has some limitations. First, brain metastases were diagnosed by a neuroradiologist using imaging-based criteria, but they were not confirmed pathologically. However, histological confirmation of brain metastases was not possible, because surgical resection is not usually performed on patients with multiple metastases. All the lesions had interval changes in follow-up imaging, and the interobserver agreement between the two neuroradiologists was excellent. Therefore, we believe that the radiological diagnosis of brain metastases in each sequence was quite reliable. Furthermore, the scanning order of iMSDE-TSE and 3D-GRE was not randomized in our study protocol. Therefore, we could not completely prevent the effect of delayed enhancement on the detection rate of enhancing lesions. However, we had 19 patients who underwent 3D-GRE before iMSDE-TSE, and 11 patients who underwent iMSDE-TSE before 3D-GRE. By reversing the scan order on 11 patients, we reduced the bias of delayed enhancement in our study results. Previous studies have already reported that the detection rate of iMSDE-TSE is higher than of 3D-GRE (
213141516). Although we compared the diagnostic performance of iMSDE-TSE and 3D-GRE, the main purpose of our study was to compare the diagnostic efficacy of non-MIP and MIP iMSDE-TSEs. We compared iMSDE-TSE and 3D-GRE images to validate the previously reported diagnostic performance of the two sequences. Then, we used them as a basis for the comparisons between non-MIP and MIP images. Therefore, the time difference in scan delay could not affect this result. Moreover, MIP reconstruction was performed without any overlapping slices. As mentioned earlier, MIP reconstruction must be performed with overlapping slices to reduce partial volume averaging artifact and false-positive findings (
19202129). With this approach, we can further improve the diagnostic performance of MIP iMSDE-TSE. In addition, we believe that further studies must be conducted to develop an optimized reconstruction algorithm based on slab thickness and slice overlapping. Thus, the detection of brain metastases can be improved with this innovative reconstruction algorithm.
In conclusion, we used different imaging techniques to detect brain metastases, including small lesions ≤ 3 mm. We found that the detectability of MIP iMSDE-TSE was comparable to that of non-MIP iMSDE-TSE but was superior to that of non-MIP and MIP 3D-GREs. Moreover, the reading time of MIP iMSDE-TSE was shorter than that of non-MIP images, but the number of false-positive results was greater in MIP iMSDE-TSE. But MIP iMSDE-TSE exhibits high diagnostic accuracy and low false-positive rates provided it is combined with 1-mm sequences.
Go to :


 PDF
PDF ePub
ePub Citation
 Print
Print


 XML Download