

 PDF
PDF ePub
ePub Citation
 Print
Print


INTRODUCTION
Esophageal carcinoma is the eighth most common malignancy in the world. Esophageal squamous cell carcinoma (ESCC) accounts for more than 90% of these, and is the predominant histological subtype (12345). Surgery for stage I esophageal cancers, neoadjuvant chemotherapy (NAC) or chemoradiotherapy (CRT) followed by surgery for stages II/III (except for T4) diseases, and preoperative CRT for inoperable esophageal cancers are considered the current standard treatments for esophageal cancer in clinical settings (678). One study (7) revealed that the survival outcomes were better for patients with stage III resectable esophageal carcinomas who underwent NAC followed by surgery than for those who underwent CRT. However, for stages I, II, and IV disease, the survival outcomes were not significantly different between the treatments. Hence, the accurate staging of esophageal cancer prior to treatment is extremely important for selecting the appropriate treatment strategy (9).
The current practice guidelines for accurately staging esophageal cancer before treatment include computed tomography and endoscopic ultrasonography. However, computed tomography and endoscopic ultrasonography cannot identify the histologic layers of the esophageal wall (1011). Magnetic resonance imaging (MRI) can overcome the limitation of these other modalities and can demonstrate the histologic layers of the esophageal wall. With the development of advanced techniques, such as faster scanning, respiratory and cardiac gating, and use of surface coils, the diagnostic efficacy of MRI for T staging has improved considerably (1213). The relatively new MRI technique of the multi-echo gradient recalled echo (GRE) T2*-weighted imaging (T2*WI) sequence requires a highly uniform magnetic field, and can improve the detection rate of small lesions. Additionally, T2* values can indirectly reflect changes in tissue biochemical components, such as the amounts of oxy- and deoxyhemoglobin in the vessels and their surrounding tissues (1415). The published literatures (161718) have reported that there is a linear relation between the transverse relaxation rate and the deoxyhemoglobin concentration. This technique has been applied to evaluate tissue oxygenation in hepatocellular carcinomas, renal carcinomas, breast cancers and prostate cancers (19202122). Therefore, we hypothesize that T2* values could reflect the contents of oxy- and deoxyhemoglobin in ESCC. To our knowledge, GRE T2*WI has not been used to evaluate tissue oxygenation in esophageal carcinomas. Therefore, this study was conducted to investigate the association of the T2* values of resectable ESCCs with tumor stages.
Go to : 
MATERIALS AND METHODS
Participants
The Institutional Ethics Committee of our hospital approved this prospective study, and written informed consent was obtained from each participant before the study.
From July 2014 to February 2015, 50 patients with endoscopic biopsy-proven ESCCs were enrolled in our study according to the following inclusion criteria: 1) patients had adequate cardiac and pulmonary functions, and could perform breath holding during the GRE T2*WI scans, 2) patients did not receive any tumor-related treatments, such as radiation therapy or chemotherapy, prior to the MRI scans, and 3) patients desired to undergo surgical resection. The initial number of patients with biopsy-confirmed ESCCs was 50. Two of these were excluded from the study because: 1) the tumor was unable to be resected because of the contraindication for surgery (n = 1); or 2) the MR images were of poor quality, or tumors were too small to draw the region of interest (ROI) of 35–45 mm2 when we reviewed the T2*WI data (n = 1). Ultimately, 48 patients (31 males and 17 females; age range, 48–78 years; mean age, 62.5 years) were enrolled in our study.
Additionally, a group of 20 randomly selected, consecutive healthy volunteers (13 males and 7 females; age range, 49–73 years; mean age, 60.9 years) were included in this study. These served as the reference group from which benchmarks were obtained according to the following inclusion criteria: the volunteers had no esophageal diseases, no acute infections, and no histories of malignant cancer. In addition, the patients with ESSCs and the normal volunteers were from the same area where our hospital was located.
All the patients with ESCCs underwent magnetic resonance scans one week before the surgery. The ESCC patients did not receive any tumor-related treatments during the interval between the MRI and their surgery. The healthy volunteers also underwent magnetic resonance scans. Immediately after the ESCC resection surgery, the surgically removed tumor tissues were sent to the pathology department for histological examination. The TNM staging was based on surgical and postoperative pathological staging. According to the current revised TNM system (the depth of primary tumor invasion, the regional lymph node involvement number and distant metastasis), the American Joint Committee on Cancer (AJCC) in 2010 (23), and the seventh edition of the AJCC/Union for International Cancer Control, cancer staging of the esophagus (24) was introduced as the criterion for staging ESCC. The corresponding patient distributions are illustrated in Table 1. All the 10 patients with T1-staged ESCCs plus one case of T2-staged cancer were determined as anatomic stage I as the standard control group to distinguish the anatomic stages. Additionally, the T3-staged ESCCs received adjuvant radiation therapy or chemotherapy after surgery.
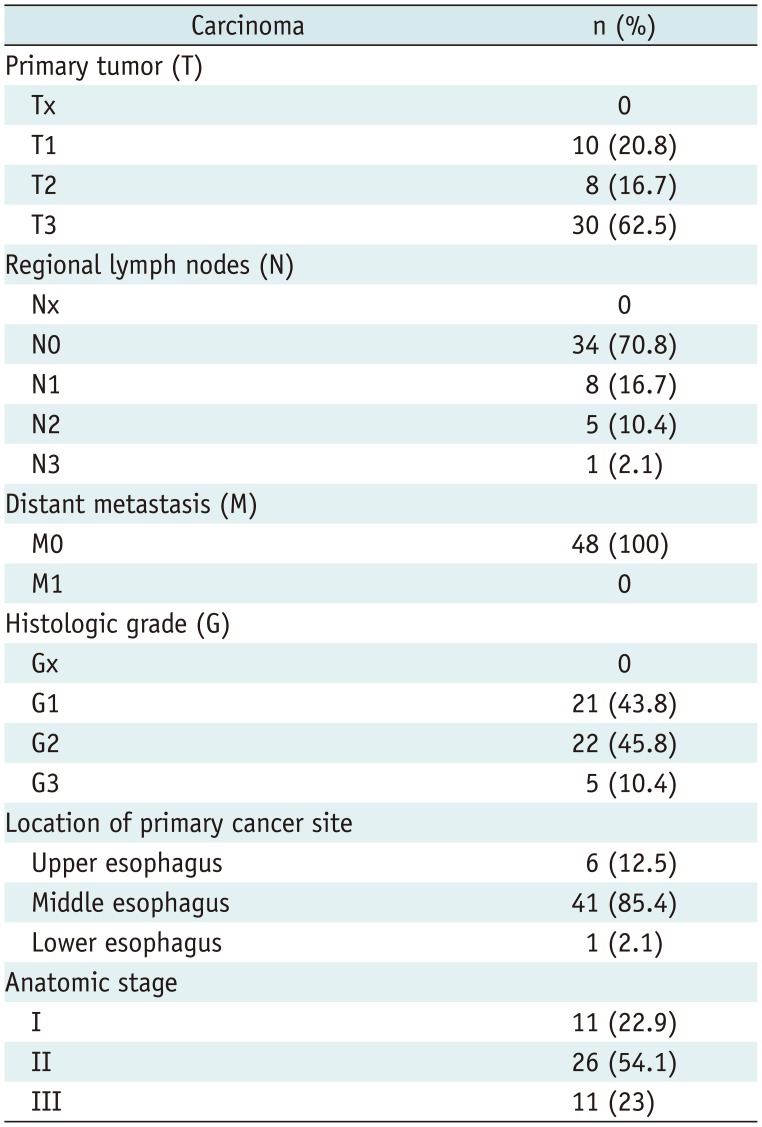
Table 1
Patient Distributions of Esophageal Squamous Cell Carcinoma
![]()
Magnetic Resonance Imaging Protocol
T2*-weighted imaging of ESCCs and normal esophagi was performed with a GE Signal 3T scanner (Discovery MR 750, GE Medical Systems, Milwaukee, WI, USA). To maintain the ratio of the scanning segments of the normal esophagi in the reference group to the anatomic distribution of the ESCCs, 3 healthy participants randomly underwent T2*WI of the upper thoracic portion of the esophagus, 16 healthy participants randomly received T2*WI of the mid-thoracic portion, and the remaining 1 healthy participant underwent T2*WI of lower thoracic portion. MRI was performed on each participant after overnight fasting. The scanning sequences included GRE T2*WI and conventional T1- and T2-weighted imaging. Subsequently, 15 mL gadolinium diethylenetriamine-pentaacetic acid (Gd-DTPA; Magnevist, Bayer Healthcare, Berlin, Germany) was intravenously injected at a dose of 2.5 mL/s for a total of 0.2 mmol per kg of body weight via a pressure injector (Spectris MR Injection System, Medrad, Warrendale, PA, USA). This was followed by a 20-mL saline solution flush for the axial T1WI triphasic dynamic contrast-enhanced scans. The GRE T2*WI sequence was completed with respiratory gating according to the following scanning parameters: repetition time of 41.8 ms, echo time of 1.5–36 ms, flip angle of 30°, acquisition matrix of 256 × 192 mm, pixel size of 1.6 × 1.6 mm, field of view of 420 × 360 mm, slice thickness of 5 mm, and sampling bandwidth of 83.3 kHz. Additionally, conventional T1- and T2-weighted scans were performed to localize the ESCCs to plan for the T2*WI of the tumors, and axial T1-weighted triphasic dynamic contrast-enhanced scans were performed for the subsequent image analysis.
Image Analysis
The original MRI data were used to measure the T2* values of the ESCCs or the normal esophageal walls on the workstation (GE Advantage Workstation Version 4.4–09, Sun Microsystems, Palo Alto, CA, USA). The contrast-enhanced T1WI was analyzed first to identify the hemorrhagic and necrotic regions of the ESCCs. Subsequently, R2* maps were constructed, and the T2* values of ESCCs and the normal esophageal walls were automatically determined by the software. Two experienced radiologists, including an experienced radiologic professor (the corresponding author, who has more than 17 years of experience in abdominal radiology) and a radiology resident (the first author, who has 2 years of experience in radiology), were blinded to the subjects' information and analyzed the MRI images. Three circular ROIs with approximately equal areas were independently and manually outlined in one maximal slice of the ESCC until three consecutive maximal slices of this tumor were covered (3 ROIs per slice, 9 ROIs per patient), and the T2* values of each ROI were recorded independently by the two radiologists. Each ROI of approximately 35–45 mm2 in area was drawn by avoiding the hemorrhagic and necrotic regions as much as possible (Fig. 1). When the tumor was too small to draw a ROI of approximately 35–45 mm2, a ROI was manually drawn as large as possible within the tumor on the magnified image, including images of T1 stage esophageal cancer. The estimate of the T2* value for each slice was obtained from the averaged T2* values of the three ROIs in each slice. The representative T2* values of the three slices were then averaged to obtain a final estimate of the ESCC T2* value for the data analysis. The T2* values of the normal esophageal wall were obtained from the healthy volunteers in a similar manner via the acquisition of the T2* values of the ESCCs except that each ROI drawn on the magnified image was approximately 3–5 mm2 in area.
 | Fig. 1Representative T2* and T2-weighted images of esophageal squamous cell carcinoma.T2* weighted imaging (T2*WI) (A-C) and T2-weighted imaging (D-F) of stages T1, T2, and T3 esophageal squamous cell carcinoma in 62-year-old male, 67-year-old female and 57-year-old male, respectively. Regions of interest are drawn on T2*WI within each tumor to obtain T2* value.
|
Statistical Analysis
All statistical analyses were performed with the SPSS software (version 13.0 for Windows, SPSS Inc., Chicago, IL, USA). Descriptive statistics included the means and standard deviations of the T2* parameters. Differences were considered significant when the p values were below 0.05.
The agreement of each T2* parameter from the two independent observers' measurements was assessed with Bland-Altman statistics. The intraclass correlation coefficients and their 95% confidence intervals were used to assess the levels of agreement. When the intraclass correlation coefficients were greater than 0.99, and the mean differences of the replicated measurements were close to zero, good agreement between the replicated measurements was considered to have been obtained (25). If the intraclass correlation coefficient was less than 0.99 for any participant, the measurement of the T2* parameter was repeated by the observers, and the mean of the four measurements was used as the final result for the further analysis.
Because the T2* parameters were normally distributed, the independent samples Student's t test was used to compare the T2* values between the ESCCs and the normal esophageal walls and between the grouped T-stages. The one-way ANOVA test and the Student-Newman-Keuls test for pairwise multiple comparisons were conducted to determine the associations between the T2* values of the ESCCs and all clinical factors, such as the T and N stages and the anatomic stage of the ESCC. If a significant difference in the T2* values between any two stages was demonstrated based on the results of the one-way ANOVA test together with the Student-Newman-Keuls test for pairwise multiple comparisons, and the independent samples Student's t test, the receiver operating characteristic (ROC) analysis of the T2* value was performed using the MedCalc statistical software (version 13.0 for Windows, SPSS Inc.) for the detection and staging of the ESCCs. In detail, ROC analyses of the T2* parameters with significant differences were performed between the normal esophageal walls and the ESCCs to detect these tumors, between the stages T0–1 and stages T2–3, and between the stages T0–2 and stage T3 to determine the grouped stages, and between stages T1 and T2, and between stages T1 and T3, to aid in the T staging of the ESCCs. Using the anatomic staging system, the significant differences in the T2* parameters between stages I and II or III were also examined by ROC analyses.
Go to :
RESULTS
The Inter-Observer Agreements of the T2* Value Measurements
There were good agreements between the two independent observers in terms of the T2* values for the ESCCs and for normal esophagi (Table 2). The intraclass correlation coefficients were greater than 0.99 in 43 patients with ESCCs and in 18 healthy participants, and the first radiologist's measurements were used as the final results for the data analysis. Additionally, the intraclass correlation coefficient was less than 0.99 in 5 patients with ESCCs and in 2 healthy participants. The measurements of the T2* parameters were repeated by the two observers, and the means of the four measurements were used as the final results for the further analysis.
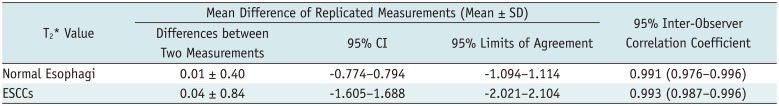
Table 2
Inter-Observer Agreements of T2* Value Measurements
![]()
Analysis of the T2* Values Associated with the T, N and Anatomic Stages
The averaged T2* values of the normal esophageal walls and ESCCs were 17.0 ± 2.9 ms and 25.2 ± 6.2 ms, respectively. There was a significant difference between the normal esophageal walls and the ESCCs (i.e., between stage T0 and stages T1–3, p < 0.001).
The averaged T2* values of the stage T1, T2, and T3 ESCCs were 17.7 ± 3.3 ms, 24.6 ± 2.7 ms, and 27.8 ± 5.6 ms, respectively. Multiple pairwise comparisons revealed that the T2* value aided the differentiation of stage T1 disease from stage T2, and of stage T1 from stage T3 (all ps < 0.001). However, no difference in the T2* values was observed between stages T2 and T3 (p > 0.05). Regarding the grouped T-stages of the ESCCs, there were significance differences in the T2* values between stages T0–1 and T2–3 (17.3 ± 3.0 ms vs. 27.1 ± 5.3 ms, p < 0.001) and between stages T0–2 and T3 (18.8 ± 4.2 ms vs. 27.8 ± 5.6 ms, p < 0.001). In the patients with stage N0–2 ESCC, the averaged T2* values of the stages N0, N1, and N2 of ESCCs were 24.7 ± 6.9 ms, 25.4 ± 4.5 ms, and 26.8 ± 3.9 ms, respectively. The T2* values of N stages were not significantly different (all ps > 0.05).
For the ESCC patients in different anatomic stages, the averaged T2* values of the stage I, II, and III tumors were 18.8 ± 4.8 ms, 26.9 ± 5.9 ms, and 27.3 ± 3.6 ms, respectively. The T2* value aided the differentiations of stage I from stage II and of stage I from stage III (all ps < 0.001). However, the T2* value did not aid the differentiation of stage II from stage III disease (p > 0.05).
ROC Analysis of the T2* Value for the Detection and Staging of ESCCs
Based on the ROC analysis, the sensitivity, specificity, area under the ROC curve (AUC), and the cutoff value of T2* for detecting and staging ESCC are summarized in Table 3. As illustrated in Table 3, the T2* parameters were reliable indicators for detecting ESCCs and aided the ESCC staging.
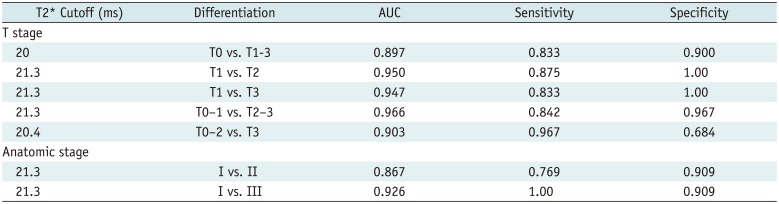
Table 3
Receiver Operating Characteristic Analysis of T2* for Detecting and Staging of Esophageal Squamous Cell Carcinoma
![]()
Go to :
DISCUSSION
In clinical settings, T1- or T2-staged ESCCs can be treated with endoscopic therapy or with esophagectomy, whereas higher stage lesions require neoadjuvant chemoradiation before or after esophagectomy (26). This study was conducted to explore the associations of the T2* values of resectable ESCCs with the stages to determine whether the T2* value can be used to detect and accurately stage esophageal cancer before treatment.
The study found that the averaged T2* value exhibited increasing trends from stage T0 to T1 and from stage T2 to T3. The potential mechanism for this finding might be the blood oxygenation level. Several previous studies reported that angiogenesis, together with rich oxygen (O2) and nutrient supplies play vital roles in tumorigenesis, development and metastasis (27282930). The cyclooxygenase-2 (COX-2) protein is over-expressed in esophageal cancer. The microvascular density in COX-2-positive cases might be significantly higher than in COX-2-negative cases, and follow an ascending order from carcinomas in situ, to tumors invading the lamina propria mucosae, and tumors invading the muscularis mucosa or deeper cancers (3132). The increased number of blood vessels can lead to increased blood flow and blood O2 content, whereas the content of deoxyhemoglobin is decreased. This could cause the phase of local magnetic fields to decrease, which ultimately results in the T2* value increasing with the progress of the T stage (33).
However, there was no significant difference in the T2* values between stages T0 and T1 of the ESCCs due to the overlap of this parameter. The potential mechanism for this finding might be a mechanism similar to that of tumor angiogenesis in early-stage colon cancer (34). During the early stage of tumor angiogenesis, the rich vasculature of the lamina propria is able to cope with the initial transformation because the tumor's organization remains similar to that of the normal esophageal wall. This study revealed that there was no significant difference in the T2* values between stages T2 and T3 of the ESCCs due to the overlap of this parameter. With the progress of an ESCC from stage T2 to T3, the rapid proliferation of malignant tumor cells and abnormal hemodynamics can significantly increase O2 consumption. The above-mentioned increase in O2 content is due to the increased number of blood vessels, and the decrease in O2 content is due to the rapid proliferation of malignant tumor cells. This leads to a significant decrease in deoxyhemoglobin content, which ultimately results in no significant difference between the T2* values of stages T2 and T3 (35363738).
Clinically, the blood oxygenation parameter (T2*) helped to differentiate ESCC stage T1 from T2 or T3, and the grouped T stages between T0–1 and T2–3, and stages between T0–2 and T3. The T2* value was also able to distinguish anatomic stage I disease from stage II or III disease. As demonstrated by the ROC analysis, the same cutoff T2* value (21.3 ms) aided the differentiation between the T1 stage and the T2 or T3 stages, and between the anatomic stages I and II or III. A possible reason for the same cutoff T2* value being reached might be related to the sample size in the standard control group that was used to obtain the threshold T2* value for the previous discrimination. All the 10 patients with T1-staged ESCCs were used as the standard control group to discriminate the above-mentioned T stages of the ESCCs. The same 10 patients with T1-staged ESCCs plus one case of T2-staged cancer were used as the standard control group to distinguish the above anatomic stages. The similar sample sizes of the standard control groups resulted in the same cutoff for the differentiation. However, the AUC, sensitivity and specificity were different for the corresponding differentiations.
This study has a limitation of relatively small sample size. However, in spite of the small sample size, some useful information about the associations of T2* values with the occurrences and stages of ESCCs was obtained. Future studies will expand the sample size to confirm these results.
In conclusion, the T2* values of ESCCs can help detect this cancer and can be an additional quantitative indicator for the preoperative stage of this tumor. The cutoff T2* value of 20 ms aided the detection of ESCCs. The cutoff T2* value of 21.3 ms aided the differentiation of T stages between T1 and T2 or T3, and between the anatomic stages of I and II or III. Regarding the determination of the grouped T-stages of the ESCCs, the cutoff T2* values of 21.3 ms and 20.4 ms aided the discriminations of stage T0–1 from stage T2–3 and of stage T0–2 from stage T3, respectively. This study will be helpful in detecting ESCCs and in staging these tumors for therapeutic decision-making.
Go to :
 XML Download