

 PDF
PDF ePub
ePub Citation
 Print
Print


INTRODUCTION
MATERIALS AND METHODS
Subjects
Table 1
General Characteristics of Enrolled Subjects
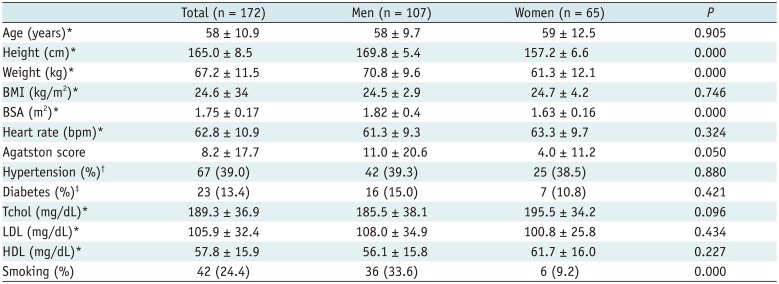
Data are expressed as *Mean ± SD, †Patients were considered as having hypertension if their blood pressure (systolic/diastolic) was persistently higher than 140/90 mm Hg or patients were currently taking antihypertensive medication, ‡Patients were considered as having diabetes mellitus if their fasting glucose level was 126 mg/dL or more as assessed at least once or patients were currently taking oral hypoglycemic agents or insulin. BMI = body mass index, bpm = beats per minute, BSA = body surface area, HDL = high density lipoprotein, LDL = low density lipoprotein, Tchol = total cholesterol
![]()
CT Acquisition and Analysis
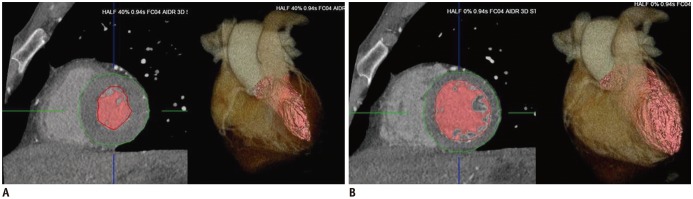 | Fig. 1Measurements of left ventricular (LV) volume and myocardial mass.LV volumes were automatically calculated based on Hounsfield unit thresholding of volumetric dataset by using data from systolic (A) and diastolic (B) phases. LV myocardial mass was calculated on end-diastolic phase by using LV endocardial and epicardial contours that were semi automatically suggested by software.
|
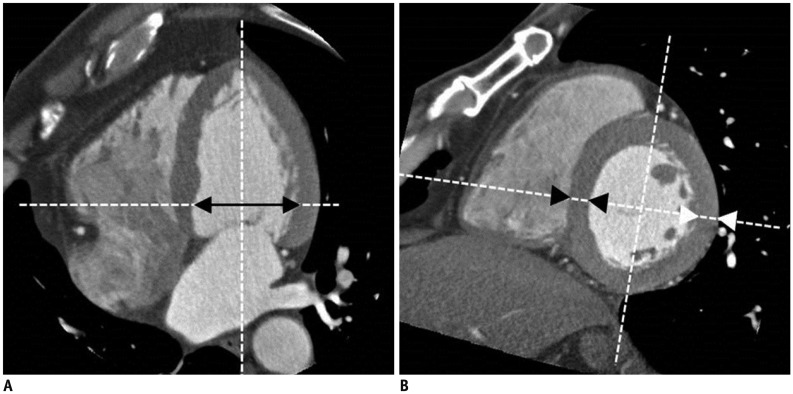 | Fig. 2Measurements of LV dimension and wall thickness at end-diastolic phase.
A. LV inner dimension was measured on 4-chamber MPR at chorda level (black arrow). B. LV wall thickness on septum (SWT, black arrowheads) and posterior wall (PWT, white arrowheads) were measured on short-axis MPR at chorda level. LV = left ventricular, MPR = multiplanar reformation, PWT = posterior wall thickness, SWT = septal wall thickness
|
Statistics
RESULTS
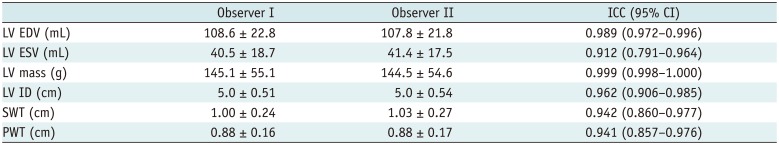
Table 2
Intraclass Correlation Coefficients of 20 Randomly Selected Subjects for Inter-Observer Variability
![]()
Overall Values and Influence of Sex on LV Volume and Functional Parameters
Table 3
Left Ventricular Dimension, Volume and Functional Parameters of Study Subjects
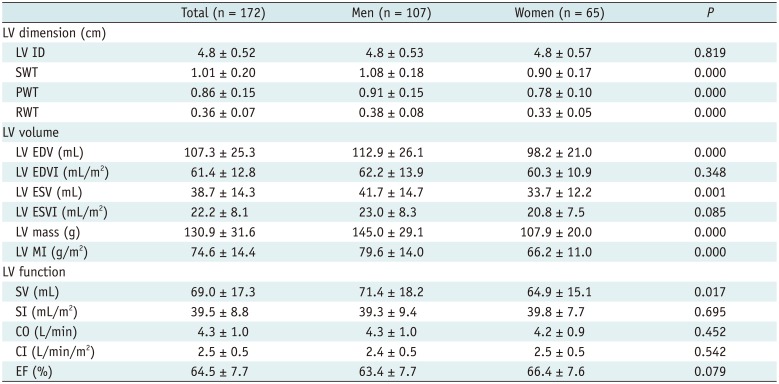
Data are expressed as mean ± SD. CI = cardiac index, CO = cardiac output, EDV = end-diastolic volume, EDVI = end-diastolic volume index, EF = ejection fraction, ESV = end-systolic volume, ESVI = end-systolic volume index, ID = inner diameter, LV = left ventricle, MI = mass index, PWT = posterior wall thickness, RWT = relative wall thickness, SI = stroke index, SV = stroke volume, SWT = septal wall thickness
![]()
Table 4
Percentiles for Left Ventricular Parameters in Men
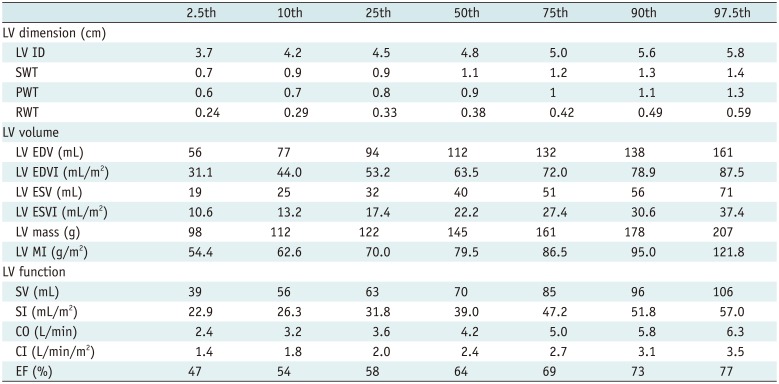
CI = cardiac index, CO = cardiac output, EDV = end-diastolic volume, EDVI = end-diastolic volume index, EF = ejection fraction, ESV = end-systolic volume, ESVI = end-systolic volume index, ID = inner diameter, LV = left ventricle, MI = mass index, PWT = posterior wall thickness, RWT = relative wall thickness, SI = stroke index, SV = stroke volume, SWT = septal wall thickness
![]()
Table 5
Percentiles for Left Ventricular Parameters in Women
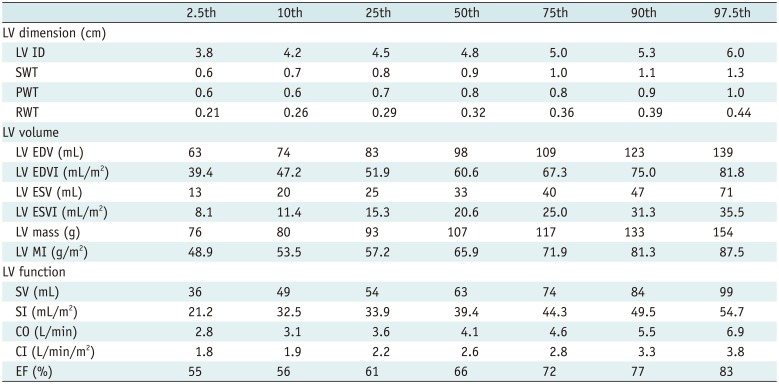
CI = cardiac index, CO = cardiac output, EDV = end-diastolic volume, EDVI = end-diastolic volume index, EF = ejection fraction, ESV = end-systolic volume, ESVI = end-systolic volume index, ID = inner diameter, LV = left ventricle, MI = mass index, PWT = posterior wall thickness, RWT = relative wall thickness, SI = stroke index, SV = stroke volume, SWT = septal wall thickness
![]()
Influence of the Subject's Body Frame on the LV Volume and Functional Parameters
Table 6
Influence of Clinical Characteristics on Left Ventricular Parameters
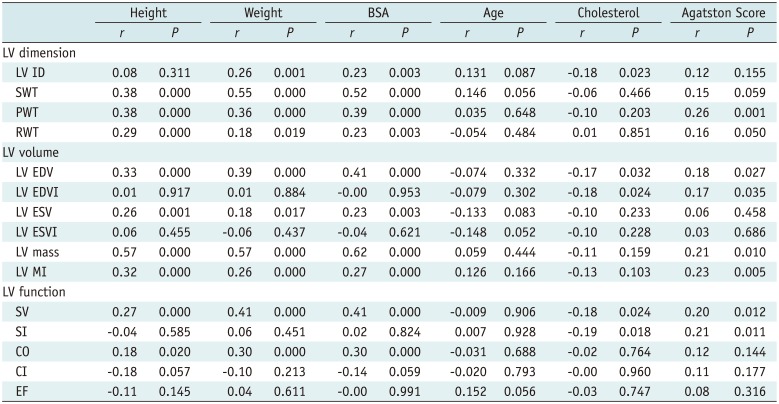
BSA = body surface area, CI = cardiac index, CO = cardiac output, EDV = end-diastolic volume, EDVI = end-diastolic volume index, EF = ejection fraction, ESV = end-systolic volume, ESVI = end-systolic volume index, ID = inner diameter, LV = left ventricle, MI = mass index, PWT = posterior wall thickness, RWT = relative wall thickness, SI = stroke index, SV = stroke volume, SWT = septal wall thickness
![]()
Influence of Clinical Characteristics on LV Volume and Functional Parameters
DISCUSSION
Table 7
Summary Data from Previously Published Manuscripts and from Present Study
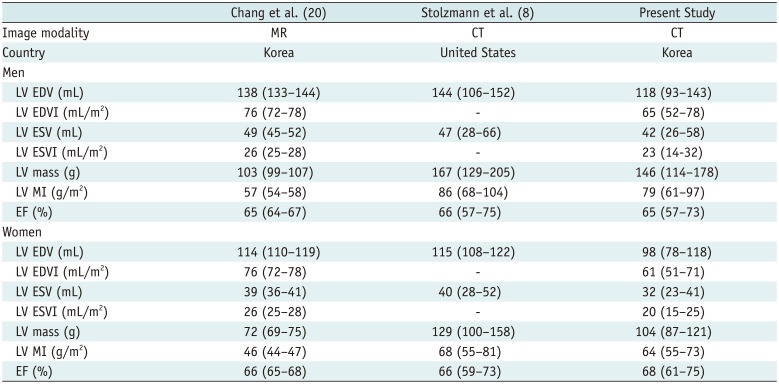
| Chang et al. (20) | Stolzmann et al. (8) | Present Study | |
|---|---|---|---|
| Image modality | MR | CT | CT |
| Country | Korea | United States | Korea |
| Men | |||
| LV EDV (mL) | 138 (133–144) | 144 (106–152) | 118 (93–143) |
| LV EDVI (mL/m2) | 76 (72–78) | - | 65 (52–78) |
| LV ESV (mL) | 49 (45–52) | 47 (28–66) | 42 (26–58) |
| LV ESVI (mL/m2) | 26 (25–28) | - | 23 (14-32) |
| LV mass (g) | 103 (99–107) | 167 (129–205) | 146 (114–178) |
| LV MI (g/m2) | 57 (54–58) | 86 (68–104) | 79 (61–97) |
| EF (%) | 65 (64–67) | 66 (57–75) | 65 (57–73) |
| Women | |||
| LV EDV (mL) | 114 (110–119) | 115 (108–122) | 98 (78–118) |
| LV EDVI (mL/m2) | 76 (72–78) | - | 61 (51–71) |
| LV ESV (mL) | 39 (36–41) | 40 (28–52) | 32 (23–41) |
| LV ESVI (mL/m2) | 26 (25–28) | - | 20 (15–25) |
| LV mass (g) | 72 (69–75) | 129 (100–158) | 104 (87–121) |
| LV MI (g/m2) | 46 (44–47) | 68 (55–81) | 64 (55–73) |
| EF (%) | 66 (65–68) | 66 (59–73) | 68 (61–75) |
![]()
 XML Download