

 PDF
PDF ePub
ePub Citation
 Print
Print


INTRODUCTION
There is a growing interest in the recognition and diagnosis of diastolic heart failure which is characterized by heart failure with a preserved ejection fraction (12). Currently, it comprises more than half of all patients with heart failure (34), and the prognostic importance of a restrictive left ventricular (LV) filling pattern has been documented in patients with atherosclerotic coronary artery disease (CAD) (5). Among the methods for evaluating diastolic function, two-dimensional (2D) echocardiography with tissue Doppler imaging (TDI) has been widely accepted as a non-invasive surrogate of invasive measurement of LV filling pressure for the screening and diagnosis of diastolic dysfunction. Currently, the combination of the early transmitral LV inflow velocity with annular velocity has proven to be the best single Doppler predictor for estimation of the LV filling pressures, although a combined assessment of all available echocardiographic data is recommended (67).
Cardiac CT has been widely used for noninvasive evaluation of CAD with a high level of diagnostic accuracy and a negative predictive value (8). Furthermore, numerous studies have demonstrated that cardiac CT can also provide accurate information on ventricular systolic function, thus enabling the simultaneous analysis of CAD and subsequent functional disturbance in a single study (91011). According to these studies, it has been well established that CT reconstructions for systolic function assessment need not be as detailed as those of dedicated CT coronary angiograms. Systolic LV function can be adequately assessed using reconstructions with relatively thicker slices (up to 5–8 mm) or a low sampling rate at 10% increments throughout the cardiac cycle (9101112131415). In contrast, few data are available on the potential of multidetector CT for the evaluation of diastolic function in spite of early attempts (161718). Promisingly, however, with ongoing technical improvement in spatial and temporal resolution, it has been reported that there is a great potential of cardiac CT in assessment of diastolic function. A recent study by Boogers et al. (18) demonstrated that hemodynamic assessment of transmitral flow velocity and mitral annulus tracking by CT enabled an estimation of myocardial diastolic function comparable to that of 2D echocardiography using TDI. However, optimal reconstruction parameters for the assessment of diastolic function have not been determined yet, despite these promising results. While it is intuitive that image reconstruction with more frequent sampling and thinner slices might provide more accurate measurements, such reconstruction will inevitably generate a great number of images and consequently increase the time required for the evaluation of diastolic function in daily routine practice.
Accordingly, we performed the current investigation to demonstrate the potential of cardiac CT using various reconstruction parameters for estimating LV filling pressure (E / E′) correlated with echocardiography, and then to determine the optimal slice thickness and sampling interval for application to daily cardiac CT studies.
MATERIALS AND METHODS
Patients
We retrospectively included 46 consecutive patients who underwent cardiac CT angiography and 2D echocardiography with TDI, in random order and on the same day, as part of a routine clinical evaluation for suspected CAD. Patients with any arrhythmias, known valvular heart disease, or acute coronary syndrome including unstable angina were excluded from further analysis. The Institutional Review Board approved this study and the retrospective review of this imaging data.
Cardiac CT Acquisition and Data Analysis
Cardiac CT imaging was performed on a 256-slice multidetector CT system (Brilliance iCT, Philips Healthcare, Cleveland, OH, USA). The standardized scanning protocol included collimation of 128 × 0.625 mm, gantry rotation time of 270 ms, and a pitch of 0.2. The patient's electrocardiographic (ECG) signal was recorded simultaneously to allow a retrospective registration of image reconstruction to the desired cardiac phase. The tube voltage ranged between 80 and 120 kVp, and the tube current was 800 mAseff. ECG-dependent tube current modulation was used with the tube current maintained at 100% during a phase between 40–80% RR-interval, and reduced to 20% of maximum during the rest of the cardiac cycle. Biphasic contrast enhancement was achieved by injecting 70–100 mL of a nonionic contrast medium (Ultravist, 370 mg I/mL, Bayer AG, Berlin, Germany), followed by 30 mL of saline, all at 5 mL/s using a dual-syringe injector (Stellant D, Medrad, Indianola, PA, USA). Four different image datasets were reconstructed from raw data with a slice thickness/reconstruction interval of 0.9 mm/0.9 mm at 20 different RR-positions in 5% increments (0–95%, image dataset A), and at 10 different RR-positions in 10% increments (5–95%, dataset B). Image datasets were also reconstructed with a slice thickness and reconstruction interval of 3/3 mm at 20 different RR-positions in 5% increments (0–95%, dataset C) and at 10 different RR-positions in 10% increments (5–95%, dataset D). All four datasets were transferred to a remote workstation equipped with semi-automated post-processing software (Aquarius, TeraRecon, San Mateo, CA, USA) which utilizes a threshold-based region-growing technique to calculate the LV volume for all phases. The papillary muscles were excluded from the volume calculations as is usual with current threshold-based volumetric software applications (1920). The LV diastolic filling pressure was then evaluated based on the calculation of transmitral velocity and mitral septal tissue velocity as described in previous study (18).
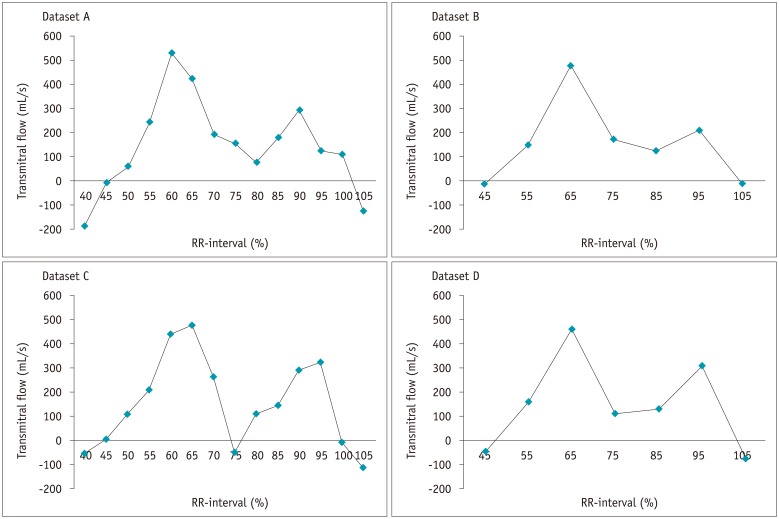
Early Peak Diastolic Transmitral Velocity (E)
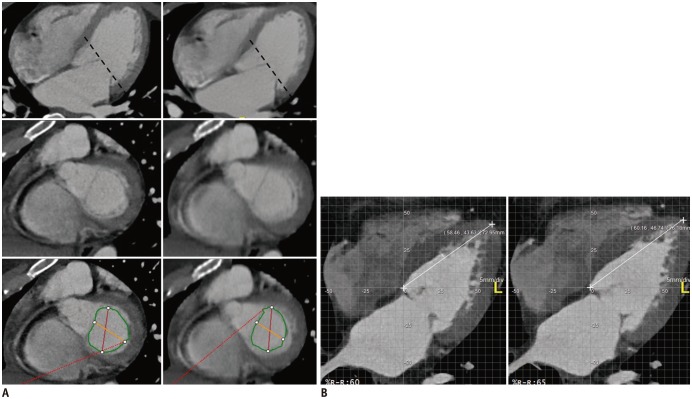
was calculated according to the following steps of image processing and analysis. First, the LV volumes for each phase of the four datasets were obtained. To calculate the transmitral flow (mL/s) per phase, the changes in LV volume (transmitral flow) were divided by the time between two consecutive phases and plotted on the transmitral flow versus time curve (Fig. 1). The early peak transmitral flow was then derived from the curve. Next, the mitral valve area was manually outlined by the same observer for comparison with velocity-based parameters derived from echocardiography (Fig. 2A). The measurement was made at the most distal level of the mitral valve leaflets by the reconstructed short-axis view at peak transmitral flow. Finally, the peak transmitral flow was divided by the corresponding mitral valve area to calculate E (cm/s).
Early Peak Mitral Septal Tissue Velocity (E′)
Several sets of calculations were performed to measure the longitudinal velocities of the mitral annulus. The distance between the medial border of the mitral annulus and the cardiac apex was measured manually in the reconstructed apical four-chamber view at each cardiac phase by an observer. The maximum change in LV length (cm) between 2 consecutive phases at early peak diastolic velocity was then divided by the time interval between 2 consecutive phases to acquire the maximal E′ (cm/s) (Fig. 2B).
Determination of LV Filling Pressure (E / E′)
Early peak diastolic mitral velocity (E) was divided by peak mitral septal tissue velocity (E′) to obtain the estimation of LV filling pressure (E / E′). A cut-off value of E / E′ ≥ 13 for the elevated LV filling pressure was used to evaluate the diagnostic performance of cardiac CT in identification of diastolic dysfunction (2122). The patient population was divided into two groups, normal and elevated LV filling pressure, based upon this cut-off value derived from echocardiography.
Transthoracic 2D Echocardiography Using TDI Acquisition
Transthoracic echocardiography (Vivid-9, General Electric Healthcare, GE Vingmed, Horten, Norway) was performed with the patients positioned in the left lateral decubitus position. Standard parasternal (long- and short-axis) windows and apical (two- and four-chamber) windows were used to obtain images. In addition, a combination of continuous-wave and pulsed-wave Doppler examinations was performed. The TDI of the basal septal mitral annulus was obtained in the color Doppler mode from the apical four-chamber view.
Statistical Analysis
Statistical analysis was performed with commercially available software (SPSS for Windows, version 19, SPSS Inc., Chicago, IL, USA; MedCalc for Windows, version 12.7, MedCalc software, Mariakerke, Belgium). Data are presented as means ± standard deviations. Correlations of E, E′, and estimated LV filling pressures (E / E′) between cardiac CT and echocardiography were determined by Pearson's correlation coefficient for all four CT datasets. Correlation strength was expressed using Evans correlation coefficient classification (23). Then, the significant differences between the correlation coefficients of these early diastolic indices were assessed. The 95% limits of agreement were defined using Bland-Altman analysis. Diagnostic accuracy was defined in terms of the ability of cardiac CT to identify elevated filling pressure, using an echocardiography-derived cut-off value of E / E′ ≥ 13. All CT images were initially analyzed by an experienced cardiac radiologist with 10 years of experience, and blinded to the clinical information. Intraobserver and interobserver reproducibility for determination of the transmitral flow, mitral valvular area, and mitral septal velocity for all four datasets were evaluated in a subset of 15 patients who were randomly selected from the patient population. To determine intraobserver variability, the image analysis was repeated twice, 1 month later by the same investigator in this same subset of 15 patients. A second independent investigator who was blinded to the initial analysis subsequently re-evaluated the images of these 15 patients. The intraclass concordance correlation coefficient (ICC) with 95% confidence interval was used to determine intraobserver and interobserver agreements between the two CT investigators for all four datasets. An excellent agreement was defined as an ICC > 0.8. A p value of < 0.05 was considered significant for all statistical testing.
RESULTS
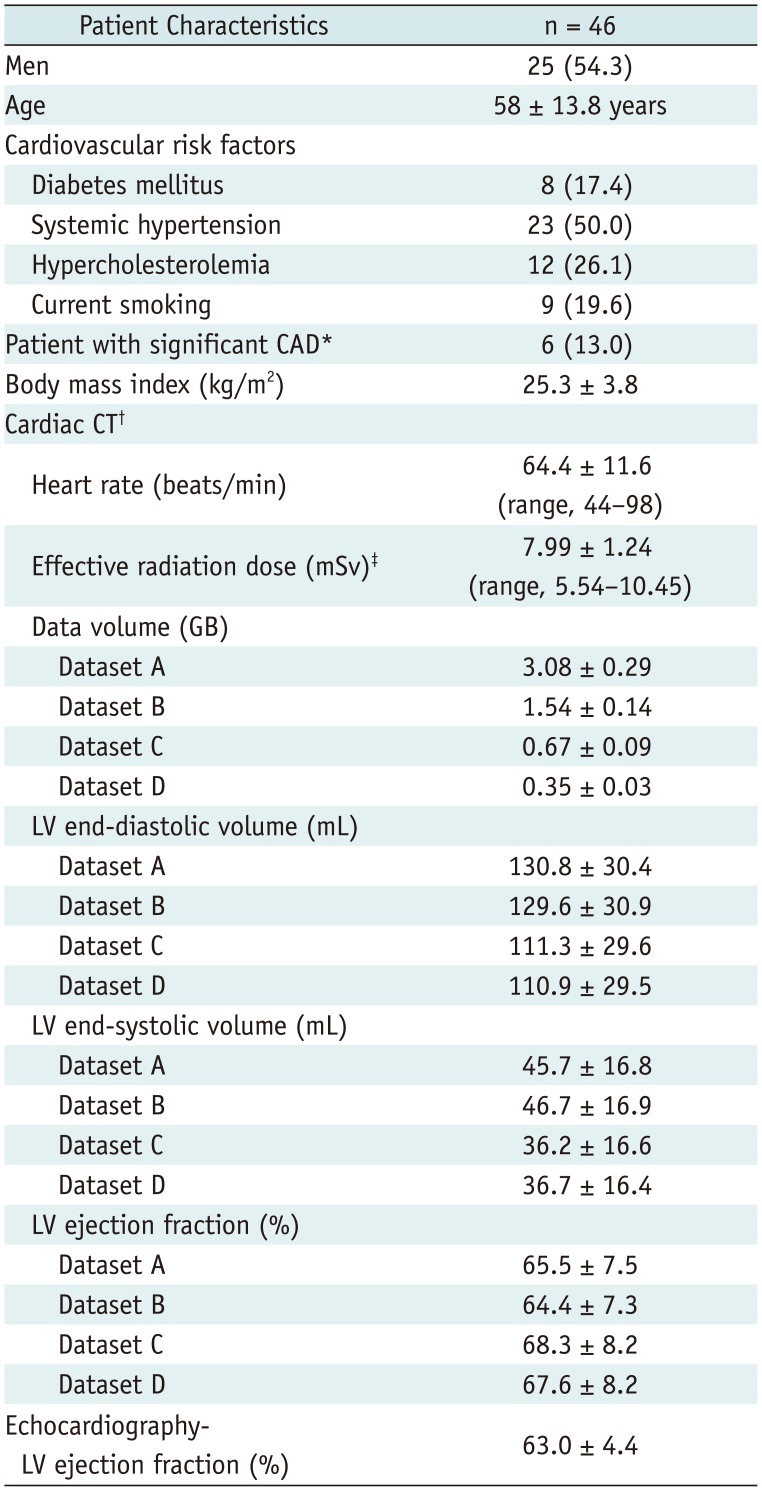
The study group consisted of 46 patients (25 males) with a mean age of 58.9 ± 13.8 years (range, 35–91), who underwent cardiac CT and 2D echocardiography with TDI in a single day. All patients had a regular sinus rhythm with a mean heart rate of 64.4 ± 11.6 bpm (range, 44–98 bpm). Oral beta-blockers were administered to five patients with a heart rate over 75 bpm. The actual CT scan time was less than 10 seconds, and the time for image reconstruction and analysis of all four datasets was approximately 50 minutes using dedicated image analysis software (15 minutes for datasets with 20 RR-intervals and 10 minutes with 10 RR-intervals). The CT data volume per study was 3.08 ± 0.29 gigabytes (GB) in dataset A, 1.54 ± 0.14 GB in dataset B, 0.67 ± 0.09 GB in dataset C, and 0.35 ± 0.03 GB in dataset D. The clinical reasons for referral for cardiac CT were based on suspected CAD. Significant CAD ≥ 50% luminal stenosis was found in six (13.0%) patients. The patient characteristics are described in Table 1.
Transmitral Velocity (E)
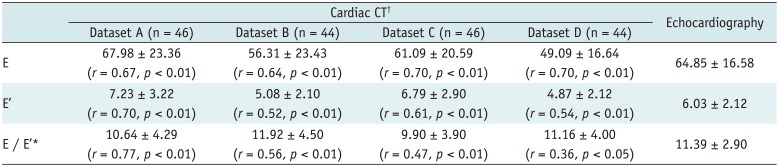
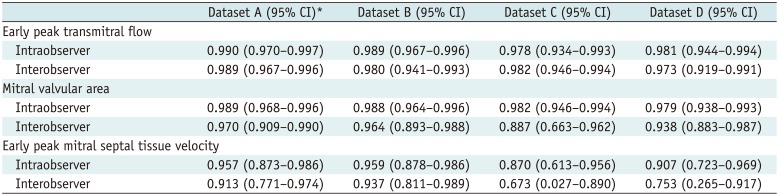
Transmitral flow versus time curves were obtained for the four datasets in all patients (Fig. 1). In two patients, however, early peak transmitral flows could not be properly identified with datasets B and D reconstructed at 10% increments of the cardiac cycle. The mean diastolic transmitral velocities are compared in Table 2. Pearson's correlation showed a strong correlation for E between echocardiography and datasets A (r = 0.67), B (r = 0.64), C (r = 0.70), and D (r = 0.70) (p < 0.01 for all). There were no significant differences among the four correlation coefficients (Table 2). Bland-Altman analysis for E showed a mean difference (echocardiography - cardiac CT) with 95% limits of agreement range as follows; −3.1 ± 17.3 cm/s, with −37.1 to 30.8 cm/s in reconstructed image dataset A, 9.9 ± 18.0 cm/s, with −21.4 to 45.3 cm/s in dataset B, 3.8 ± 14.9 cm/s, with −25.4 to 32.9 cm/s in dataset C, and finally, 17.1 ± 12.5 cm/s, with −7.3 to 41.6 cm/s in dataset D. The differences were proportional to the means (< 0.05) in absolute difference plots of two data sets of group A and B (not shown). Excellent intraobserver and interobserver reproducibility was observed for assessment of early peak transmitral flow and mitral valvular area (Table 3).
Mitral Septal Tissue Velocity (E′)
Velocity versus time curves were obtained for all patients. The mean values for E′ are shown in Table 2. Pearson's correlation showed a strong correlation for E′ between echocardiography and datasets A (r = 0.70) and C (r = 0.61), but moderate correlation between echocardiography and datasets B (r = 0.52) and D (r = 0.54) (p < 0.01 for all). There were no significant differences among the four correlation coefficients (Table 2). Bland-Altman analysis for E′ showed a mean difference (echocardiography - cardiac CT) with 95% limits of agreement range as follows; −1.2 ± 2.3 cm/s, with −5.7 to 3.3 cm/s in dataset A, 1.1 ± 2.0 cm/s, with −2.8 to 5.1 cm/s in dataset B, −0.8 ± 2.3 cm/s, with −5.3 to 3.8 cm/s in dataset C, and finally, 1.3 ± 2.0 cm/s, with −2.6 to 5.2 cm/s in dataset D. The differences were proportional to the means (< 0.05) in absolute difference plots of two datasets of group A and C (not shown). Intraobserver and interobserver variability was 0.673–0.959 for assessment of E′ in image datasets A–D (Table 3).
Velocity versus time curves were obtained for all patients. The mean values for E′ are shown in Table 2. Pearson's correlation showed a strong correlation for E′ between echocardiography and datasets A (r = 0.70) and C (r = 0.61), but moderate correlation between echocardiography and datasets B (r = 0.52) and D (r = 0.54) (p < 0.01 for all). There were no significant differences among the four correlation coefficients (Table 2). Bland-Altman analysis for E′ showed a mean difference (echocardiography - cardiac CT) with 95% limits of agreement range as follows; −1.2 ± 2.3 cm/s, with −5.7 to 3.3 cm/s in dataset A, 1.1 ± 2.0 cm/s, with −2.8 to 5.1 cm/s in dataset B, −0.8 ± 2.3 cm/s, with −5.3 to 3.8 cm/s in dataset C, and finally, 1.3 ± 2.0 cm/s, with −2.6 to 5.2 cm/s in dataset D. The differences were proportional to the means (< 0.05) in absolute difference plots of two datasets of group A and C (not shown). Intraobserver and interobserver variability was 0.673–0.959 for assessment of E′ in image datasets A–D (Table 3).
Estimation of Diastolic Filling Pressure (E / E′)
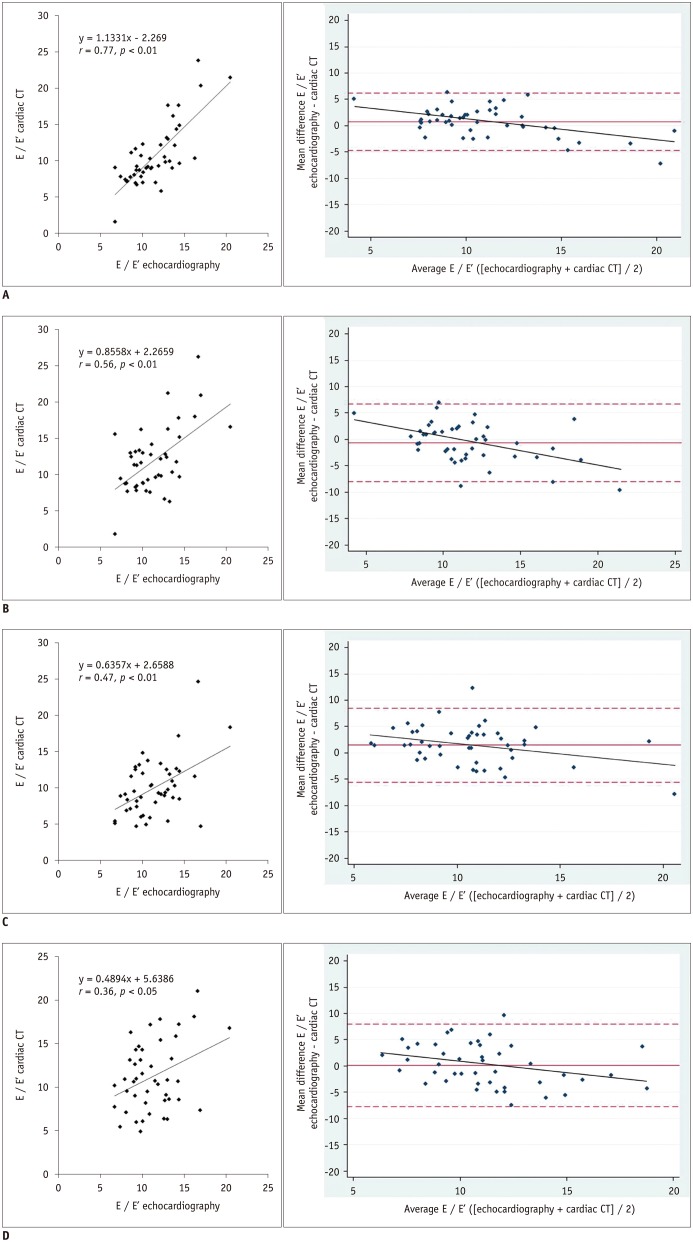
The correlation between CT and echocardiography for the assessment of E / E′ was stronger (p < 0.05) with dataset A (r = 0.77, p < 0.01) than with datasets B (r = 0.56, p < 0.01), C (r = 0.47, p < 0.01), and D (r = 0.36, p < 0.05) (Table 2). Bland-Altman analysis results for E / E′ are shown as a mean difference with 95% limits of agreement range in Figure 3.
Detection of Elevated LV Filling Pressure
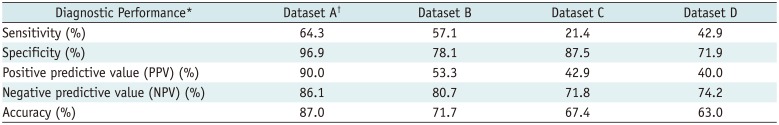
The diagnostic performance of cardiac CT for the prediction of elevated filling pressure was evaluated. A total of 32 patients (69.6%) showed normal E / E′, while 14 (30.4%) showed E / E′ ≥ 13 using echocardiography as the reference standard. The diagnostic performances including sensitivity, specificity, positive and negative predictive value, and accuracy of cardiac CT using four different reconstruction parameters are compared in Table 4. Among them, the diagnostic accuracy of group A (87.0%) for predicting E / E′ ≥13 was better than that of group B (71.7%) (p = 0.123), and was significantly higher than those of groups C (67.4%) and D (63.0%), (p < 0.05), respectively.
DISCUSSION
Our results showed strong correlations between cardiac CT and Doppler echocardiography with TDI for E in all four reconstructions performed with different slice thicknesses and sampling rates. The correlations between CT and echocardiography for E′ were much better when datasets were reconstructed with higher sampling rates at 5% increments than with lower rates at 10% increments, although these were not statistically significant. Lower sampling rates typically underestimated the CT-based E and E′ compared with high sampling rates. The average E and E′ values were low in datasets B and D with a lower sampling rate at 10% increments than their values in datasets A and C at 5% increments. Among datasets with the same sampling rate, however, slice thickness showed a lesser impact on the correlation for E and E′ between echocardiography and CT. Consequently, we believe that the sampling rate may have a greater impact than slice thickness on the calculation of the E and E′. One of the potential explanations for this result could be that images reconstructed at lower sampling rate are more likely to miss the true maximal transmitral flow, maximal mitral septal velocity, or smallest mitral valvular area, such as shown in two patients whose E could not be determined in datasets B and D reconstructed at 10% increments. However, images reconstructed with thick slices may lead to difficulties in accurate delineation of the mitral valve leaflets and precise localization of the mitral septal annulus because of low spatial resolution. This may explain the relatively higher inter and intraobserver variability in the measurement of the mitral septal velocity in datasets C and D with thick slices as shown in the current study (2425). Therefore, although the sampling rate may have a greater impact, slice thickness must also be considered as an important reconstruction parameter for the accurate assessment of diastolic function. In the current study, a significantly stronger correlation (p < 0.05) was demonstrated for the estimation of LV filling pressure (E / E′) in dataset A than in datasets B, C, and D. Furthermore, the diagnostic accuracy for the detection of elevated filling pressure was significantly higher in the reconstructed dataset A with a 0.9 mm slice thickness at every 5% of the RR-interval (87.0%) than that of dataset C with 3 mm slice thickness at every 5% of the RR-interval (67.4%) or dataset D with 10% of the RR-interval (63.0%) (p < 0.05 for all). Therefore, we believe that thinner slices and shorter increments are necessary for more accurate evaluation of diastolic function.
Interestingly, we also found that there were some instances where the between-method variability increased as the measurement increased. As the average measurements increased, cardiac CT had a tendency to overestimate E when reconstructed with thin slices, E′ when reconstructed with a high sampling rate, and E / E′ in all groups (p < 0.05). Although the sources of this proportional overestimation are currently unknown, these results suggest that there could be a complex relationship between multiple factors. e.g., hemodynamic and reconstruction parameters, which may influence the negative trend in Bland-Altman plots.
While patients are not primarily referred for heart function evaluation with cardiac CT (26), our results indicate that cardiac CT may provide additional information about diastolic function when retrospective ECG-gating technique is used, and image data are appropriately reconstructed. Although it increases the number of images to be managed and requires extra time in clinical practice, our findings, if incorporated into the postprocessing software for the practical application, may be used in screening for diastolic dysfunction with higher specificity and diagnostic accuracy in at-risk patients undergoing CT for coronary evaluation, with no additional input in terms of contrast medium or radiation exposure.
We acknowledge the following limitations in our study. First, we divided our patients into two groups with normal or elevated filling pressure using the single Doppler parameter, E / E′ while multiple hemodynamic factors can influence this ratio, and a combined assessment of all available echocardiographic data is, thus, recommended (67). However, the primary goal of this study was to evaluate the effect of reconstruction parameters on diastolic function assessment with cardiac CT. Therefore, standard classification of diastolic dysfunction (grade 1 to 4) was not used, considering the complexity in analysis of four datasets using multiple Doppler parameters. Second, few patients with elevated diastolic filling pressure were included. Patients in this study usually referred for evaluation of atypical chest pain, and underwent cardiac CT and echocardiography for screening of CAD and the evaluation of possible functional abnormalities. Thus, this may explain the low rate of elevated filling pressure and relatively low sensitivity for diastolic dysfunction in our study population. Considering this, we selected the cut-off value of E / E′ ≥ 13. While septal E / E′ > 15 is generally accepted as an indicator of increased LV filling pressure, a number of studies noted that many different ranges can be used, such as average E / E′ from 11–16 and septal E / E′ > 13 (222728). Nevertheless, further validation of the effects of different reconstruction parameters on diagnostic performance may be required in larger populations with various degrees of diastolic dysfunction. Third, E / E′ obtained from cardiac CT were compared with that from echocardiography. Although direct measurement of LV filling pressure has been established as the most accurate approach (29), it is invasive and therefore not suitable as a method for screening, or for repeat evaluations in routine clinical practice. Therefore, while it can be a potential source of error, echocardiography-derived E / E′ has been most widely used as a noninvasive practical alternative for estimation of LV filling pressure in clinical practice. Next, we performed rapid injections of a high dose of contrast medium during CT scans. While these may have caused hemodynamic alterations (2030), the effect of sudden expansion of the circulating volume on diastolic function is presently unknown (31). However, considering that each dataset was reconstructed from the same population, this effect likely had a minor negative effect on the comparison of each dataset with respect to its correlation with echocardiography. Furthermore, including only patients who underwent cardiac CT and echocardiography on the same day would minimize any negative influence of hemodynamic change along this line. Next, while one of the advantages of CT is its isovoxel submillimeter resolution, a major disadvantage may be its lower temporal resolution compared to echocardiography and MR (32). Therefore it is possible to miss the true end-systolic volume in some cases. Nevertheless, in our study, the thin slice reconstructions with 5% instead of 10% step increments demonstrated a fairly high correlation between CT and echocardiography-derived E / E′. However, further studies are warranted in view of on-going advances in CT technique to improve temporal and spatial resolution.
In conclusion, our study showed that assessment of E / E′ with cardiac CT was feasible in all four reconstructions. However, data reconstructed with thin slices and frequent sampling provided better correlation with echocardiography in E, E′, and E / E′, and also showed better diagnostic accuracy for predicting elevated LV filling pressure. While reconstructions for systolic function analysis need not be detailed, our study shows that data reconstructed with thin slices and frequent sampling may be necessary for accurate assessment of LV diastolic function with cardiac CT.
 XML Download