

 PDF
PDF ePub
ePub Citation
 Print
Print


INTRODUCTION
Dynamic contrast-enhanced magnetic resonance imaging (DCE-MRI) is considered a useful tool for evaluating angiogenic alterations in various disease entities. As an advanced analysis technique, pharmacokinetic (PK)-modeling on DCE-MRI can quantify the functional status of vessels, such as transvascular permeability and blood volume. Given this advantage, PK parameters using DCE-MRI are predicted to be promising biomarkers for assessing the response to antiangiogenic treatment (123).
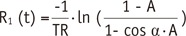
In order to accept the DCE-MRI-derived PK parameters as relevant indicators for predicting treatment response and patient prognosis, their measurement accuracy and reliability must necessarily be satisfied. In this regard, some steps in PK modeling have potential risks for significant misestimating (4). In particular, flip angle (FA) deviation due to a defectively transmitted radiofrequency field results in incorrect quantifications of the pre-contrast R1 and the Gd-driven contrast enhancement ratio (CER). As these two values are crucial elements in converting the DCE-MRI signal to the Gd-concentration for PK modeling (5678), such miscalculation eventually leads to inaccurate and non-reproducible estimation of PK parameters (791011).
Such unfavorable influence of B1-inhomogeneity on PK modeling of DCE-MRI has been demonstrated in many reports (5678). However, the degree of error propagation led by the FA fluctuation in each modeling step has not been evaluated. This detailed information is important for establishing a strategy to minimize the measurement error and for understating the principle of error transfer and/or augmentation between the PK modeling processes. From this perspective, this study was conducted to investigate the actual range of B1-inhomogeneity and its impact on each computational process in PK modeling. Specifically, real FA variation measured on a clinical 3T MRI unit is applied to the Monte Carlo simulation that describes the B1-dependent, erroneous PK parameter estimation. Additionally, the extent of FA inhomogeneity is measured in normal volunteers in order to predict the FA-error-induced inaccuracy of PK parameters in clinical situations. Finally, the strategy to reduce such undesirable effects of B1-inhomogeneity on PK modeling is discussed.
Go to : 
MATERIALS AND METHODS
Measurement of Ex Vivo and In Vivo B1 Error
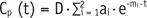
All scans were performed on a Philips Achieva (ex vivo) and Ingenia (in vivo) 3T TX scanner (Philips Healthcare, Best, the Netherlands) that are used clinically and undergo regular equipment maintenance according to the vendor's guidelines. The B1 transmission field was evaluated in a water phantom and in the brains of three normal volunteers, using a brain coil. The ‘actual flip angle imaging’ method, which uses two identical radiofrequency pulses with two different repetition times (TR1 < TR2) (12) was employed for measuring the B1-inhomogeneity. The steady-state gradient echo images were obtained according to the following parameters: TR1 = 30 ms, TR2 = 100 ms, echo time (TE) = 3.74 ms, FA = 30, field of view = 200 × 200, and slice thickness = 5 mm in ex vivo experiments; and TR1 = 30 ms, TR2 = 120 ms, TE = 2.2 ms, FA = 30, field of view = 230 × 180, and slice thickness = 5 mm in in vivo experiments. A FA map was then generated from these images, and the actual FA values were measured across the midline of the phantom and the brain. Finally, the means ± standard deviation (SD) and 95% confidence interval (CI), i.e., means ± 1.96 SD, of the actual FA were calculated.
Monte Carlo Simulation
From the 95% CI of actual FAs measured in the phantom study, 100000 FAs were randomly extracted with the assumption of their Gaussian distribution. These FAs were then applied to measure the actual values of the pre-contrast R1 value, Gd-driven CER and the time-dependent Gd-concentration in the gray matter and blood. The B1-dependent fluctuation of these values resulted in an incorrect estimation of the arterial input function (AIF) and the PK parameters, while the Levenberg-Marquardt method was used for fitting the time-Gd-concentration curve (13). All simulations were performed using MATLAB-based in-house software (The MathWorks, Natick, MA, USA).
For quantifying the B1-dependent error, the % error was calculated using the following equation:
Pre-Contrast R1 Measurement
Flip angle-error-driven actual pre-contrast R1 values for gray matter (reference value, 0.606 sec−1) and blood (reference value, 0.549 sec−1) were simulated using the variable flip angle (VFA) method (414). For measuring the actual R1, two actual FAs corresponding to two nominal FAs of 2° and 14° were used by referring to the Quantitative Imaging Biomarker Alliance (QIBA) guidelines (1516).
The actual MR signal intensity (SI) determined by an erroneous FA was calculated as follows: where SIa = FA-error-dependent actual SI, M0 = proton density, αa = actual FA corresponding to the nominal FA of 2° and 14°, R1 = reference values of longitudinal relaxation rate (1 / T1) of gray matter and blood, and TR (2.5 msec). The actual R1 value was then calculated according to the following equations (17):
where SIa = FA-error-dependent actual SI, αn is nominal FA, and TR (2.5 msec).
Gd-Driven CER
Gd-enhanced SI at a certain time-dependent Gd-concentration was calculated according to the following equation: where S (t) = Gd-enhanced, time-dependent SI, M0 = proton density (10000), R1 = pre-contrast R1 in the gray matter and blood, r1 = relaxivity of the Gd-based contrast agent (3.77 sec−1 mM−1), α = FA, Cn (t) = reference value of the time-dependent Gd-concentration. The Cn (t) was calculated according to the modified Tofts two-compartment model with reference parameter values as described in Eq-12, in which a1 = 3.99 kg/L, a2 = 4.78 kg/L, m1 = 0.144 min−1, m2 = 0.0111 min−1, D = 0.25 mM/kg, Ktrans = 0.05 min−1, ve = 0.21, and vp = 0.01 (61819). In this computation, a TR of 2.5 msec and FA of 30° were applied by referring to the QIBA guidelines (16). An actual S (t) affected by the FA error was calculated by applying the actual FA and pre-contrast R1, which were presented as ranges at each time point. In contrast, the nominal S (t) was also computed from the reference FA and pre-contrast R1. Consequently, the Gd-driven actual and nominal CERs, i.e., SIpost/SIpre, were simulated.
Conversion of SI to Gd-Concentration
MR SI can be converted to the Gd-concentration according to the follow equation:
where C (t) = time-dependent Gd-concentration, CER (t) = Gd-driven CER, α = FA, TR = 2.5 msec, and R1 (t) = time-dependent post-Gd R1 value. The actual Gd-concentration was calculated by applying the actual values of R1pre and CER (t), while the nominal Gd-concentration was calculated using the reference values.
To compare the influence of a deviated pre-contrast R1 and CER on the Gd-concentration measurement, the variation of Gd-concentration was simulated while using the actual value of one parameter and the reference value of the other.
AIF
The time-dependent plasma concentration of Gd, i.e., AIF, was calculated using the following equation: where Cp (t) = time-dependent Gd-concentration in the blood, D = the dose of CA (mmole/kg), ai = normalized for unit dose (kg/L), and mi = rate constant for the plasma curve (min−1). The actual a1, a2, m1, and m2 values were calculated by fitting the actual Cp (t), while the nominal Cp was calculated by applying the above-mentioned reference values.
PK Parameters
The time-dependent concentration of Gd in the gray matter is described by the following equation: where Ct (t) = time-dependent tissue concentration of Gd, Ktrans = volume transfer constant between blood and extravascular extracellular space, ve = volume of extravascular extracellular space per unit volume of tissue, and vp = volume of plasma per unit volume of tissue. The nominal Ct (t) was generated using the above-mentioned reference values of Ktrans, ve, and vp, whereas the actual B1-error-affected PK parameters were calculated by fitting the actual Ct (t).
In order to describe an actual situation of B1-inhomogeneity-driven error in PK modeling of DCE-MRI, a sample condition was simulated. With this process, a target lesion in the image center had a 3% FA deviation, and a feeding vessel in the image periphery had a −10% FA deviation. Under this condition, the measurement error occurring in each calculation step, which finally caused a variation of the PK parameters, was computed.
Go to :
RESULTS
Ex Vivo and In Vivo
B1-Inhomogeneity
The actual FA measured across the phantom and the brain of a normal volunteer is shown in Figure 1. The actual FA demonstrated a location-dependent distribution since it was greater than the nominal FA in the image center, but it was less in the peripheral area. In the phantom, the actual FA corresponding to the nominal FA of 30° was 27.4 ± 2.2° (mean ± SD; range, 23.3–32.1°). The 95% CI of the % error in the actual FA was −23–5% of the nominal FA. In three normal volunteers, the actual FA corresponding to the nominal FA of 30° was 32.5 ± 3.0° (range, 26.7–38.4°) and the 95% CI of the % error as −11–28% of the nominal FA.
Pre-Contrast R1 Value
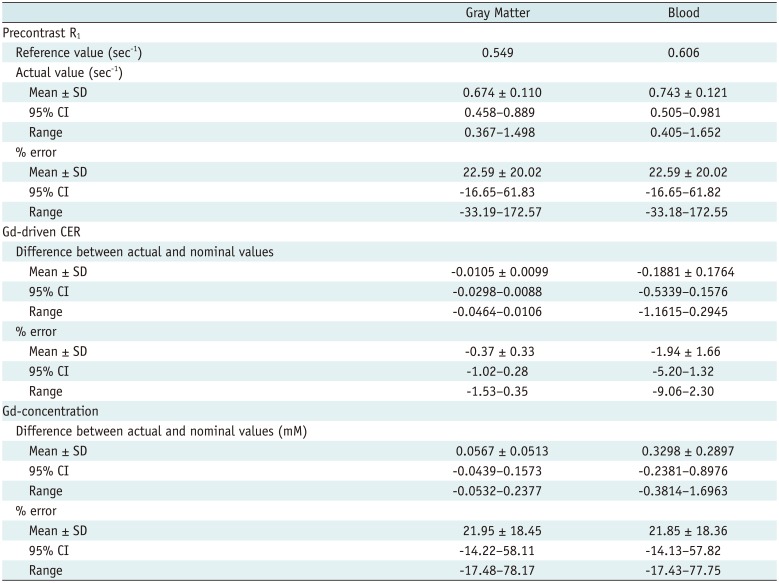
The expected actual FA ranged between 1.54–2.10° for a nominal FA of 2° and 10.8–14.7° for a nominal FA of 14°. By applying 100000 actual FAs within the 95% CI, the B1-error-influenced R1 values showed a variation range as summarized in Table 1 and Figure 2.
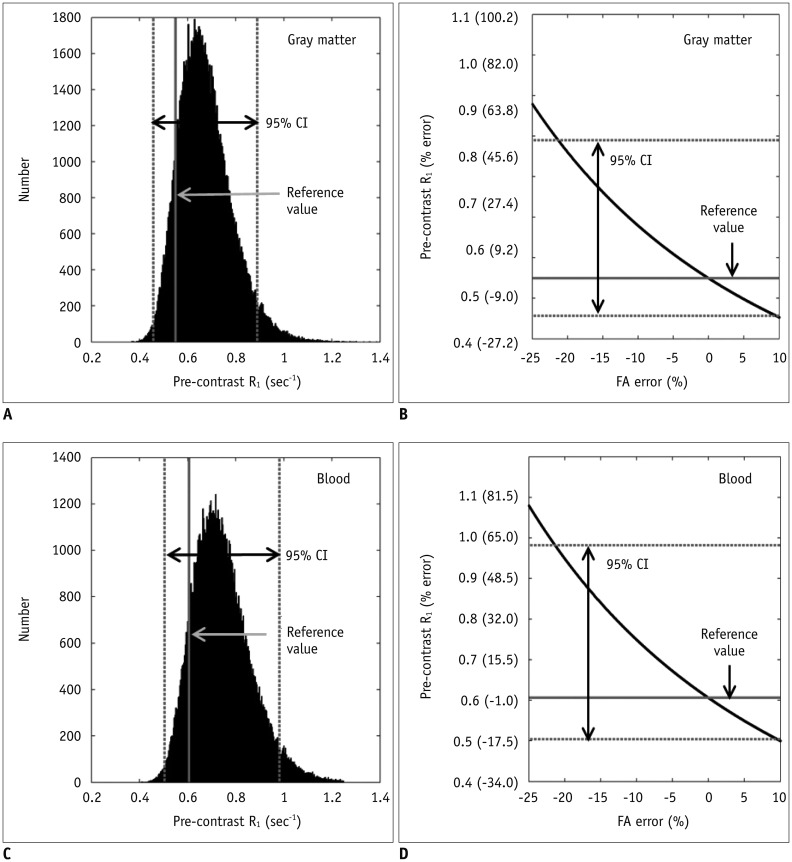 | Fig. 2B1-inhomogeneity-induced variation of pre-contrast R1 in gray matter (reference value, 0.549 sec−1) and blood (reference value, 0.606 sec−1).
A. Distribution of actual values of pre-contrast R1 in gray matter. 95% CI of % error is −16.7–61.8%. B. Negative correlation between % error of FA and that of pre-contrast R1 in gray matter. Actual R1 is greater than reference value when actual FA was less than nominal FA, and vice versa. C. Distribution of actual values of pre-contrast R1 in blood. 95% CI of % error is −16.7–61.8%. D. Negative correlation between % error of FA and that of pre-contrast R1 in blood. Actual R1 is greater than reference value when actual FA was less than nominal FA, and vice versa. CI = confidence interval, FA = flip angle
|
Table 1
Simulation of B1-Error-Influenced Deviation
![]()
Typically, with a −10% FA error, the actual value of ‘m’ in Eq-3 measured in the gray matter was 0.9983 whereas its reference value was 0.9986 (e−R1 reference·TR = e−0.549·0.0025), thereby showing only a −0.03% error. However, according to Eq-4, as the actual R1 was 0.679 sec−1(1TR·In[1m]=10.0025·ln[10.9983]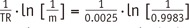 ), the small error of ‘m’ was increased to a 23.6% R1 deviation.
), the small error of ‘m’ was increased to a 23.6% R1 deviation.Gd-Driven CER
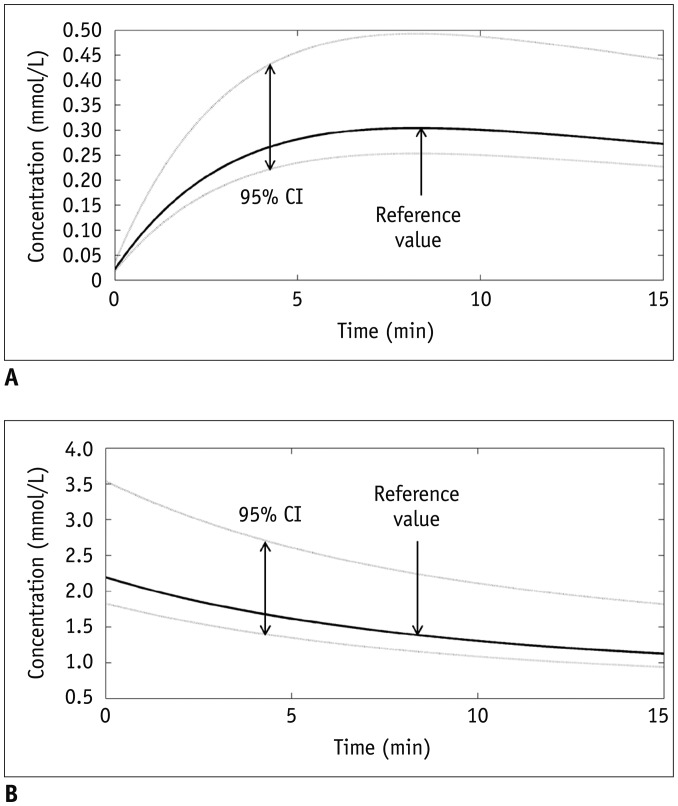
The time-dependent actual Gd-driven CERs are shown in Table 1 and Figure 3. The B1-error-induced deviation of CER was not notably high as the 95% CI of % error was only −1.02–0.28% in the gray matter and −5.20–1.32% in the blood. Typically, −10% FA error resulted in −0.400% error in the gray matter and −2.112% error in the blood.
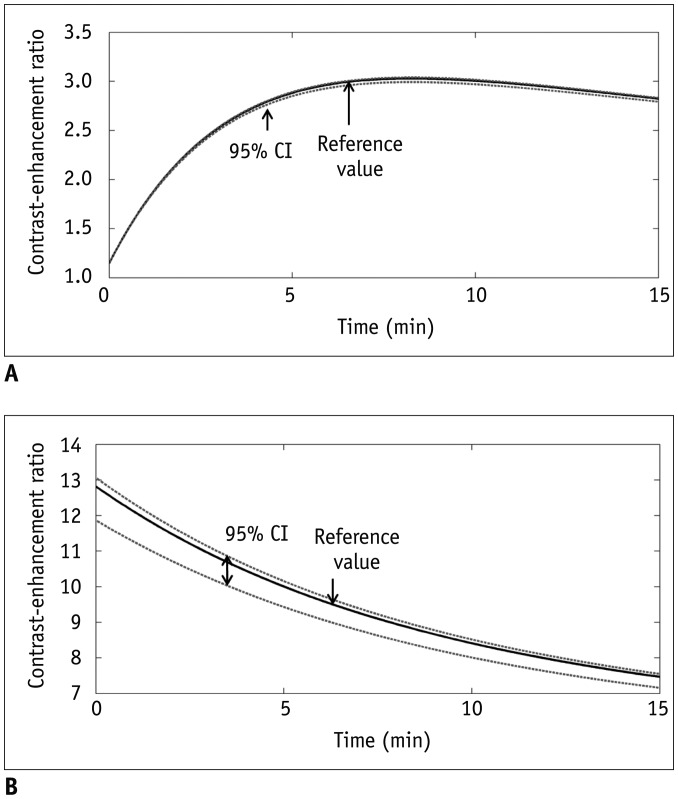 | Fig. 3B1-inhomogeneity-induced variation of contrastenhancement ratio in gray matter and blood.
A. Reference and actual curves of time-dependent contrastenhancement ratio in gray matter. 95% CI of % error is −1.0–0.3%. B. Reference and actual curves of time-dependent contrast-enhancement ratio in blood. 95% CI of % error is −5.2–1.3%. CI = confidence interval
|
The variation range of the actual CER became greater as the CER increased. For example, the range of the actual CER in the gray matter was 1.38–1.39 (95% CI of % error, −0.32–0.26%) at the nominal CER of 1.4, whereas it was 2.98–3.02 (95% CI of % error, −1.20–0.32%) at the nominal CER of 3.
Gd-Concentration
The time-dependent actual Gd-concentrations are shown in Table 1 and Figure 4. Characteristically, a −10% FA deviation induced Gd-concentration errors of 23.6% in the gray matter and 23.5% in the blood.
 | Fig. 4B1-inhomogeneity-induced variation of Gd-concentration in gray matter and blood.
A. Reference and actual curves of time-dependent Gd-concentration in gray matter. 95% CI of % error is −14.2–58.1%. B. Reference and actual curves of time-dependent Gd-concentration in blood. 95% CI of % error is −14.1–57.8%. CI = confidence interval
|
The influence of the R1 and CER errors on the Gd-concentration is compared in Figure 5, in which either of these two parameters was applied as a reference value and the other as an actual value. This simulation demonstrated that the R1 error caused a greater variation in the Gd-concentration than in the CER. This is evident from the 95% CI of the Gd-concentration being wider due to the pre-contrast R1 error than the CER error.
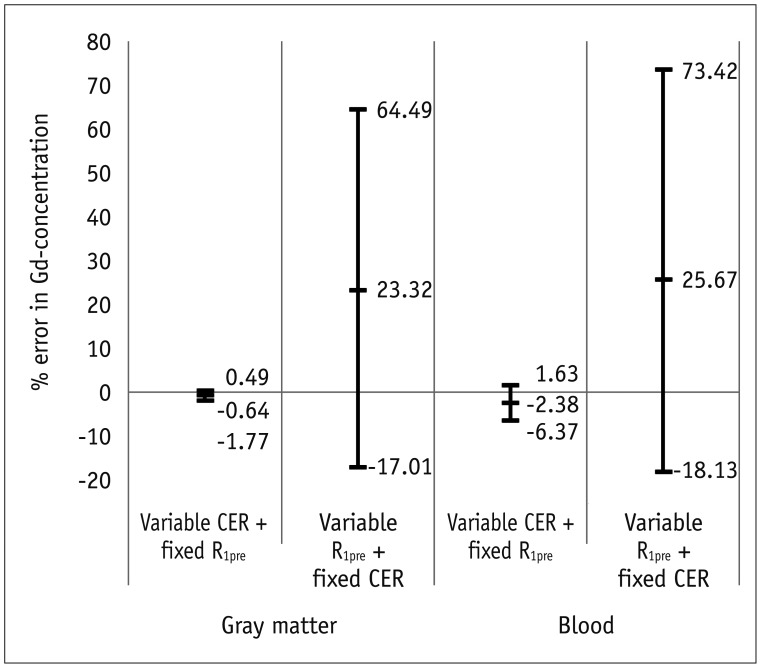 | Fig. 5Influence of erroneous pre-contrast R1 and CER on calculation of Gd-concentration.Simulation was performed while either of these two parameters was applied as reference value and other as actual value. % error range of Gd-concentration is significantly wider by R1 error than by CER error. CER = contrast-enhancement ratio, R1pre = pre-contrat R1
|
The variation width of the actual Gd-concentration became greater as the Gd-concentration increased. For example, in the gray matter, the 95% CI of actual Gd-concentration was 0.047–0.094 (% error, −19.20–63.33%) at a Gd-concentration of 0.058 mM, whereas it was 0.244–0.493 (% error, −19.17–63.25%) at a Gd-concentration of 0.302 mM.
AIF
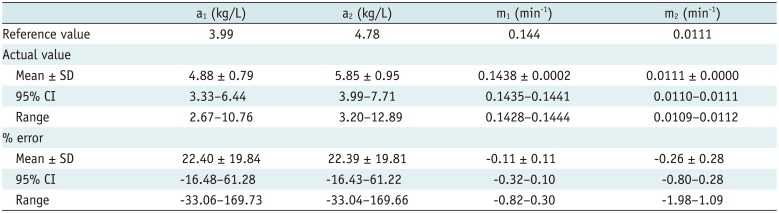
The simulated AIF parameter, calculated by fitting the actual Gd-concentration curve, is presented in Table 2 and Figure 6. Typically, a −10% FA error led to 23.44, 23.43, −0.12, and −0.28% error of a1, a2, m1, and m2, respectively. In these simulations, the a1 and a2 values which characterize the amplitude of the AIF curve showed a greater FA-dependent variation (95% CI of % error, −16.48–61.28%) than m1 and m2 (−0.80–0.28%) which describe the shape of the AIF curve.
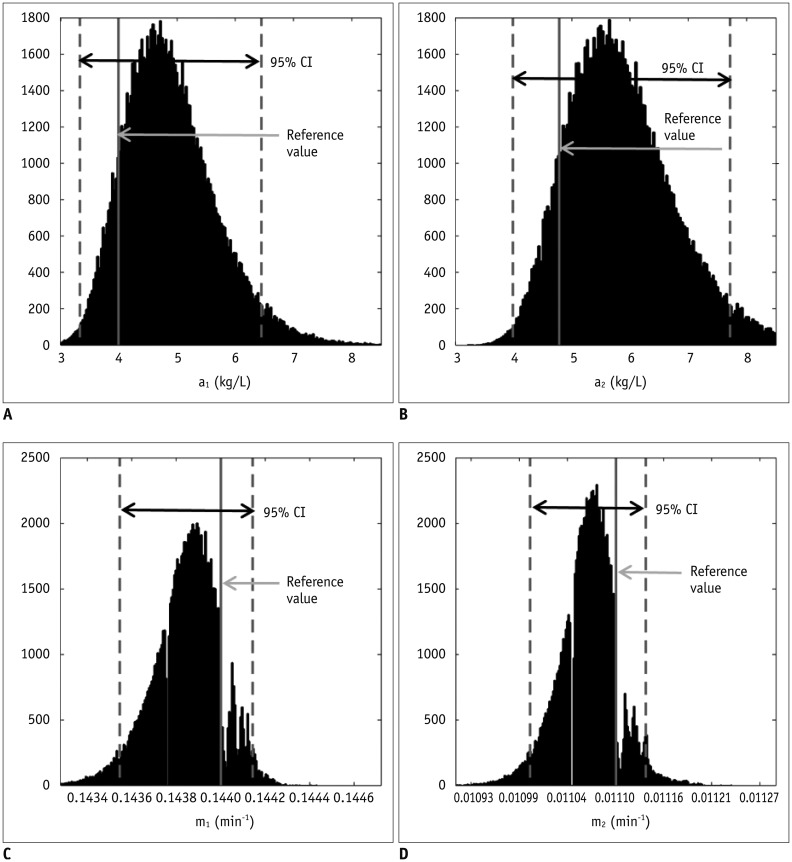 | Fig. 6B1-inhomogeneity-induced variation of four parameters that characterize arterial input function.95% CI of % error are −16.5–61.3% for a1 (A), −16.4–61.2% for a2
(B), −0.3–0.1% for m1
(C), and −0.8–0.3% for m2
(D). CI = confidence interval
|
Table 2
Simulation of Arterial Input Function
![]()
PK Parameters
The distribution of the B1-error-influenced PK parameters is shown in Table 3. The 95% CI of % error was −43.1–48.4% in the Ktrans, −43.2–48.6% in the ve, and −43.2–48.6% in the vp. Characteristically, a −10% FA error led to 17.51% error in the Ktrans, 17.49% in the ve, and 17.58% in the vp.
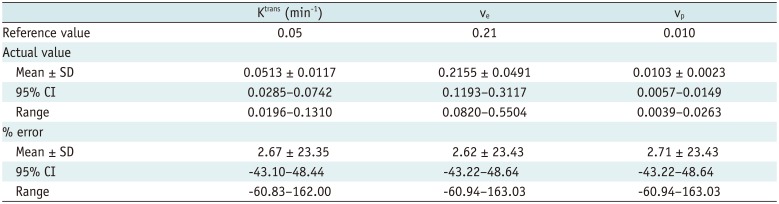
Table 3
Simulation of Pharmacokinetic Parameters
![]()
All of these parameters demonstrated a negative correlation with the % error of FA in that they were higher than the reference values when the actual FA was lower than the nominal FA.
Simulation Example
According to the simulation example, in which the FA error is 3% in a target lesion and −10% in a feeding vessel, the % error of the PK parameter was −23.66% for the Ktrans, −23.71% for the ve, and −23.70% for the vp. Detailed results are given in Figure 7.
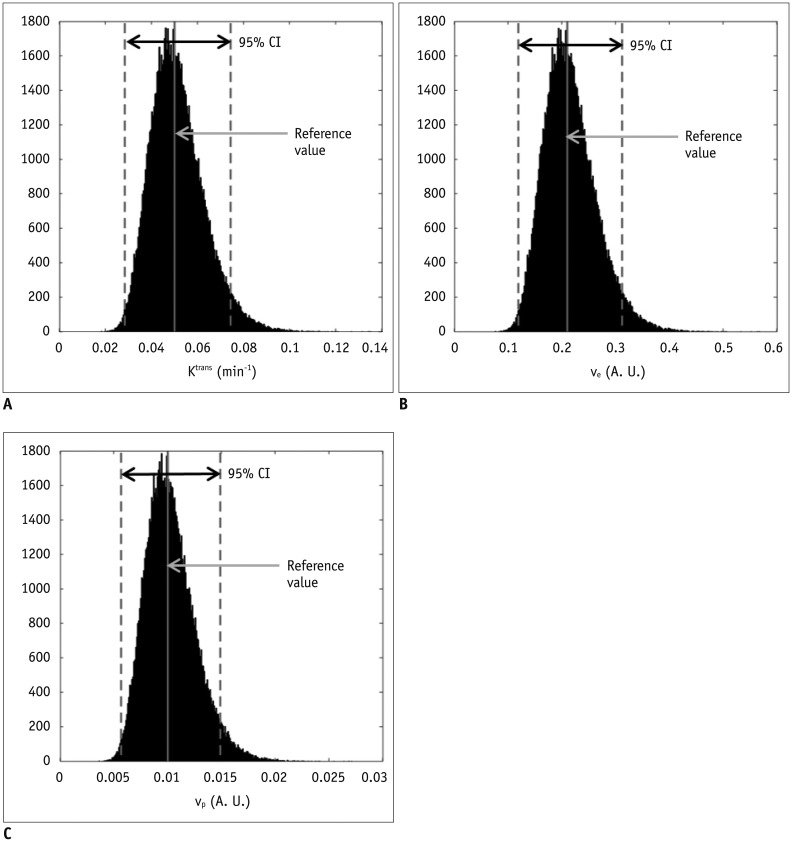 | Fig. 7Example case that simulates actual situation reflecting influence of B1-inhomogeneity on pharmacokinetic modeling of DCE-MRI.In this simulation, target lesion in image center has 3% FA deviation and feeding vessel in image periphery has −10% FA deviation, which leads to measurement error occurring in each calculation step of pharmacokinetic modeling. Finally, % errors for pharmacokinetic parameters were −23.7% for Ktrans
(A), −23.7% for ve
(B), and −23.7% for vp
(C). A. U. = arbitrary unit, CI = confidence interval, DCE-MRI = dynamic contrast-enhanced magnetic resonance imaging
|
Go to :
DISCUSSION
This study analyzed the influence of B1-inhomogeneity on the PK modeling of DCE-MRI. In the phantom experiment on a 3T unit that undergoes regular vendor-guided equipment maintenance, a considerable range was observed in the actual FA (95% CI, −23–5%) with a nominal FA of 30°. Subsequently, Monte Carlo simulation using a similar FA variation demonstrated that the B1-inhomogeneity-induced incorrect measurement of pre-contrast R1 (−17–62%) as well as the Gd-driven CER (−5–1%) led to a substantial deviation of the Gd-concentration (−14–58%). Finally, our simulation demonstrated a significant variation in the PK parameters (−43–49%), which would be beyond a tolerable error range in clinical practice (16).
According to our simulation, the FA variation has a greater effect on the pre-contrast R1 measurement than on the CER. In this respect, a -10% FA deviation caused a 23.6% R1 error but only a −0.4% CER error in the gray matter. We suggest that this strong vulnerability of the pre-contrast R1 to FA inhomogeneity is closely related to the calculation process in the VFA method. According to the Eq-4 and TR of 5 msec, R1=1TR·In(1m)=10.0025·In(1m)=400·In(1m) . As such, multiplication of 1TR
 , i.e., 400, amplifies a small variation of ‘m’ to a substantial error of R1. For example in our simulation, only a −0.03% deviation of ‘m’ led to a 23.6% error of R1. Moreover, as the pre-contrast R1 is used from the first step in converting the DCE-MRI SI to the Gd-concentration, its deviation continuously affects the subsequent calculations in the PK modeling. As shown in our simulation example, a 23.6% deviation of blood pre-contrast R1, which was induced by a −10% FA error, ultimately causes approximately −24% deviations of Ktrans, ve, and vp. Therefore, in order to improve the accuracy and reliability of PK parameter measurements, it is necessary to control the propagation of R1 error throughout a number of steps in the Gd-concentration estimation.
. As such, multiplication of 1TR, i.e., 400, amplifies a small variation of ‘m’ to a substantial error of R1. For example in our simulation, only a −0.03% deviation of ‘m’ led to a 23.6% error of R1. Moreover, as the pre-contrast R1 is used from the first step in converting the DCE-MRI SI to the Gd-concentration, its deviation continuously affects the subsequent calculations in the PK modeling. As shown in our simulation example, a 23.6% deviation of blood pre-contrast R1, which was induced by a −10% FA error, ultimately causes approximately −24% deviations of Ktrans, ve, and vp. Therefore, in order to improve the accuracy and reliability of PK parameter measurements, it is necessary to control the propagation of R1 error throughout a number of steps in the Gd-concentration estimation.In order to reduce the undesirable effect of B1-inhomogeneity on estimation of PK parameters, the application of B1-corrected R1 mapping is the primary recommended solution (2021). In a recent study the B1 field was accurately homogenized by a linear, inverse, distant-weighted interpolation. This study demonstrated that this B1 correction could reduce the difference in the in vivo T1 value, between the inversion recovery and VFA methods, from 58% to 8.1% in the breast coil(21). According to Eq-3 and -4, such an 8.1% R1 error is approximately equivalent to an FA error of 4%. Therefore, the B1 correction can reduce not only the R1 deviation but also the CER error, thereby significantly improving the quality of PK modeling.
Applying a long TR in a condition that satisfies the acceptable scanning time can be another solution for reducing the variation of pre-contrast R1. Our simulation used a TR of 2.5 msec for the VFA method as recommended by the QIBA guidelines when using the same pulse sequence for R1 measurement as used for the DCE-MRI (16). However, as detailed in Eq-4, the use of a longer TR can reduce the effect of deviated ‘m’ while not disturbing the PK modeling. For example, a TR of 5 msec may reduce the effect of deviated ‘ln (1 / m)’ by half compared with a TR of 2.5 msec.
A majority of two-compartment models analyze the shape of the time-concentration curve, and therefore are strongly dependent on the accuracy of the Gd-concentration. Therefore, these methods are inherently affected by the FA-dependent error, as described above. On the other hand, an algorithm that was initially proposed by Brix et al. (22) and then modified by Hoffmann et al. (23) estimates PK parameters directly from the DCE-MRI SI. Therefore, this method has an important advantage to avoid potential errors occurring during the measurement of pre-contrast R1 and Gd-concentration. The feasibility of this simple approach as an alternative to the complex, two-compartment models has been validated in several clinical trials (22242526). Another benefit of this method is that there is no requirement for AIF measurement which has been seriously considered as a major error source in PK modeling (27). However, the usage of this algorithm is acceptable only under specific permeability-limiting conditions (1728), and does not provide the blood volume. Therefore, a larger-scale verification regarding its strength and weakness is necessary, which must be based on a comparison with the concentration-based, two-compartment models.
In the present study, the B1-inhomogeneity was measured using a brain coil. As the B1-inhomogeneity increases in a larger field of view, the FA variation must be greater in the body and breast coils than in the brain coil. Actually, previous breast coil studies showed a wider deviation of FA (median, −40%; and greater than −50% in some cases) than this study (710). Consequently, the variation of FA and the subsequent measurement error of PK parameters may be augmented when using the breast or body coil.
The influence of B1-inhomogeneity on PK parameter estimation from DCE-MRI was also simulated by Di Giovanni et al. (9) who showed a greater variation of the PK parameters than that seen in our study (for example, Ktrans and ve error up to 531% and 233%). For the simulation, they separately employed the deviated pre-contrast R1 and FA for DCE-MRI, which referred to the values seen in the literature reports. In contrast, our simulation applied such parameters originating from a single B1-inhomogeneity condition on the basis of a phantom experiment, and therefore may be more realistic for predicting an error occurring in each MRI unit. Moreover, again comparing with Di Giovanni et al. (9), this simulation included the deviation of AIF induced by FA error, and used the modified Tofts model that measures the vp. Although the etiology and phenomenon of unstable PK modeling are similarly considered, the dissimilar simulation setting seems to be the main cause of such different error ranges in the PK parameters from different studies.
In conclusion, this study demonstrates the influences of B1-inhomogeneity on PK parameter estimation using DCE-MRI. An understanding of the inherent FA error, which occurs even in clinically utilized MR units and its impact on PK modeling, will help to establish strategies for using DCE-MRI to improve the quantification of disease- or treatment-driven vascular alterations.
Go to :
 XML Download