

 PDF
PDF ePub
ePub Citation
 Print
Print


INTRODUCTION
Metal implants are widely used in orthopedic practice. MRI is limited due to the risk of metal dislocation and magnetic susceptibility; hence, CT is now the preferred method for the postoperative assessment of orthopedic metal implants (123). However, the presence of metal implants produces metal artifacts on CT images, resulting in serious deformation, substantial bias of CT attenuation and a marked decrease in image quality, which greatly influences the validity and reliability of the postoperative assessment of orthopedic metal implantation. Therefore, research studies have focused on the identification of effective metal artifact reducing methods for clinical practice, for example, linear interpolation technique (4), spline interpolation technique (5), simultaneous algebraic reconstruction technique (6), and simultaneous iterative reconstruction technique (7), etc.
Orthopedic metal artifact reduction algorithm (O-MAR) is a commercial algorithm (Philips Health System, Cleveland, OH, USA) that is used to eliminate metal artifacts by projection data modification. Multiple iterations make O-MAR suitable for internal fixation of large metal implants such as orthopedic steel plates and artificial prostheses (8). Kidoh et al. (9) confirmed that O-MAR could markedly reduce the metal artifacts caused by dental prostheses or implants. Jeong et al. (10) found O-MAR could help to improve diagnostic performance of abdominal CT by effectively reducing metal artifacts caused by orthopedic metal implants. Li et al. (11) also reported that O-MAR could improve the quality of CT images taken for radiotherapy planning after hip replacement. However, to our best knowledge, there are few reports regarding whether and how much O-MAR could benefit postoperative CT scans for patients with orthopedic metal implants.
The purpose of this study was to evaluate O-MAR in CT orthopedic metal artifact reduction at different tube voltages, identify an appropriate low tube voltage for clinical practice using animal experiments, and investigate its clinical application at a low tube voltage for patients with orthopedic metal implants.
MATERIALS AND METHODS
Animal Experiments
Orthopedic Metal Implantation Procedure and Acquisition of CT Images
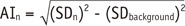
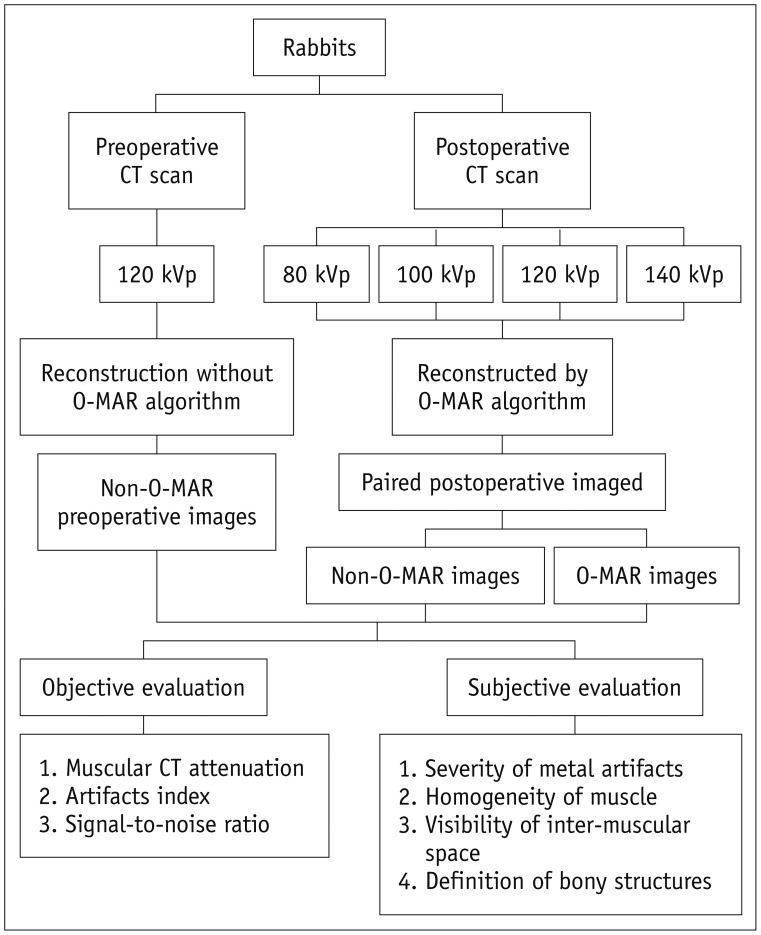
In this study, all procedures involving animals were in accordance with the ethical standards of the institution. Three healthy Japanese white rabbits, weighing 3.0 ± 0.2 kg, were included. Medical stainless-steel plates fixed with four 1.5 mm stainless-steel screws (RenLi Orthopedic Instrument Company, Tianjin, China) were implanted into the femurs of the rabbits' hind limbs. The plate was placed parallel to the femur and the axis of the screw was perpendicular to the femur as much as possible (Fig. 1). Femoral cross-sectional CT scans were performed before and after orthopedic metal implantation. The two femurs were scanned consecutively.
CT scans were performed on a 128-slice CT scanner (Brilliance iCT; Philips Medical Systems, Best, the Netherlands). As shown in Figure 2, preoperative CT scans were performed at 120 kVp, and four tube voltages were set for postoperative CT scans: 80, 100, 120, and 140 kVp. All other scanning parameters were the same, including a tube current 120 mAs, slice thickness 1 mm, slice interval 0.5 mm, matrix 512 × 512, field of view 150 mm, collimation 64 × 0.625 mm, and scan length 100 mm. The Z-axis was set parallel to the femoral axis, as near as possible. The volume CT dose index (CTDIvol) was recorded. In the image-reconstruction step (Fig. 2), O-MAR was only used for postoperative images, which led to paired postoperative O-MAR and non-O-MAR images. Two different CT imaging conditions were adopted: bone window setting (Y-detail [YD] kernel; level, 800 Hounsfield unit [HU]; width, 2000 HU) and soft-tissue window setting (standard [B] kernel; level, 60 HU; width, 360 HU).
Image Quality Evaluation
Image Section Selection
Postoperative images containing full length screws were selected for image assessment. One sectional image per screw and four per femur were chosen. Totally, 24 pairs of postoperative images for six femurs were included for subsequent evaluation. The corresponding preoperative images at the same slice-location were selected based on the anatomy.
Objective Evaluation
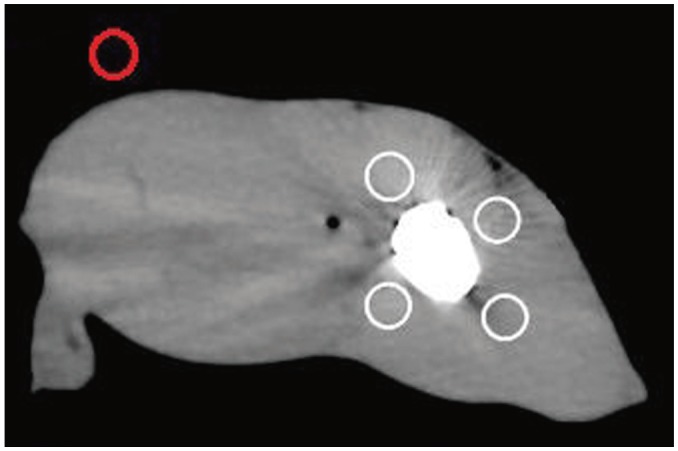
The soft-tissue window that would be more severely affected by metal artifacts was selected for objective evaluation. Regions of interest (ROIs) approximately 25–30 mm2 were drawn on the postoperative O-MAR images, avoiding the inter-muscular space and subcutaneous fat tissue that could influence the homogeneity of CT attenuation. ROIs on corresponding non-O-MAR images were drawn using replication technology. ROIs on preoperative images were drawn at the same position, as near as possible, based on the anatomy.
As illustrated in Figure 3, four ROIs in the muscular area (the white circles) were drawn within a 1–2 cm area around the metal implants, which would be combined to avoid measurement bias. In addition, another ROI (the red circle) was drawn in the background region away from the metals. The mean CT attenuation and its standard deviation (SD) were determined for each ROI.
Objective indices included the mean muscular CT attenuation (CT), the mean artifact index (AI), and the mean signal-to-noise ratio (SNR).

CTn was the mean CT attenuation of each ROI surrounding the metal implants.
Both background noises and metal artifacts could increase the SD of CT attenuation. Therefore, when considering SD as an expression of metal artifacts, the influence of background noises (SDbackground) should be subtracted. AI was calculated by
SDn was SD of each ROI surrounding the metal implants. AIn represented the metal artifacts' intensity.
Subjective Evaluation
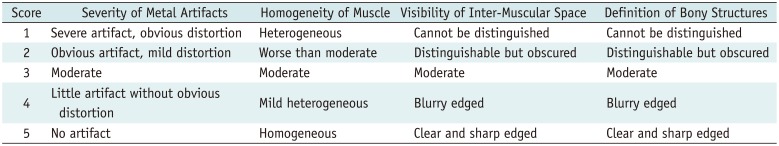
Subjective evaluation was conducted on both bone and soft-tissue window images. Two blinded, independent readers (with > 10 years of experience in radiological diagnosis) conducted the subjective evaluations, including severity of metal artifacts, homogeneity of muscle, visibility of inter-muscular space, and definition of bony structures using a 5-point scale (Table 1). A consensus was reached through discussion. Images that scored ≥ 3 were considered clinically acceptable.
To evaluate the accuracy and reliability of O-MAR, muscular CT attenuation was compared between preoperative and the paired postoperative images using the unpaired t test.
To evaluate the metal artifact reduction effect of O-MAR, comparisons of SNR and AI were carried out between the paired O-MAR and non-O-MAR images at the same tube voltage using the paired Student t test.
It is commonly known that higher tube voltage results in the fewer metal artifacts. Therefore, the effects of tube voltage on AI and SNR were evaluated by comparison of AI and SNR among different kVps for O-MAR and non-O-MAR images respectively, using the repeated measures ANOVA (least-significant difference [LSD]). To assess the reversal effect of O-MAR on the negative effect of tube-voltage reduction, we determined the kVp at which O-MAR images had similar AI/SNR as non-O-MAR images at 140 kVp.
Evaluation of Clinical Cases
Twenty patients with orthopedic metal implants were randomly selected for this study. Three patients had metal implants in the cervical spine, four in the lumbar spine, two in the elbow joint, two in the shoulder joint, one in the hip joint, three in the femur, one in the knee joint, two in the tibia, one in the pelvis, and one in the mandible. Informed consent to participate was obtained from all patients before the CT examinations.
CT scans were performed on a 256-slice CT scanner (Brilliance iCT; Philips Medical Systems). Based on the results of the animal experiments, a lower tube voltage was applied, as compared to 120 kVp that is routinely used. The tube amperes (mAs) were auto-modulated based on the patients' size at 120 kVp. Other parameters were: slice thickness 0.5 mm, slice interval 0.5 mm, matrix 512 × 512, collimation 64 × 0.625 mm, O-MAR reconstruction, and bone window setting (YD kernel, level 800 HU, width 2000 HU). The CTDIvol was also recorded. Severity of metal artifacts and definition of bony structures of O-MAR images were subjectively evaluated by both radiologists based on the criteria used in the animal experiments to determine their diagnostic acceptance. Images that scored ≥ 3 were considered acceptable.
Statistical Analysis
Statistical analysis was only conducted for the animal experiments. The objective indices were expressed as the mean ± SD. The normal distribution was initially determined by the Kolmogorov-Smirnov test. The comparison of muscular CT attenuation between preoperative and postoperative images (including O-MAR and non-O-MAR images) was by the unpaired t test. The paired Student t test was used to compare AI and SNR between the paired O-MAR and non-O-MAR images at the same tube voltage, and the comparison of AI and SNR among four different tube voltages was by the repeated measures ANOVA (LSD).
The subjective scores were expressed as medians. The Wilcoxon rank-sum test was used to compare the paired O-MAR images and non-O-MAR images.
SPSS 19.0 (version 2013, IBM, New York, NY, USA) was used for statistical analysis. A level of p < 0.050 was considered statistically significant and a level of p < 0.010 was considered highly significant.
RESULTS
Animal Experiments
Muscular CT Attenuation
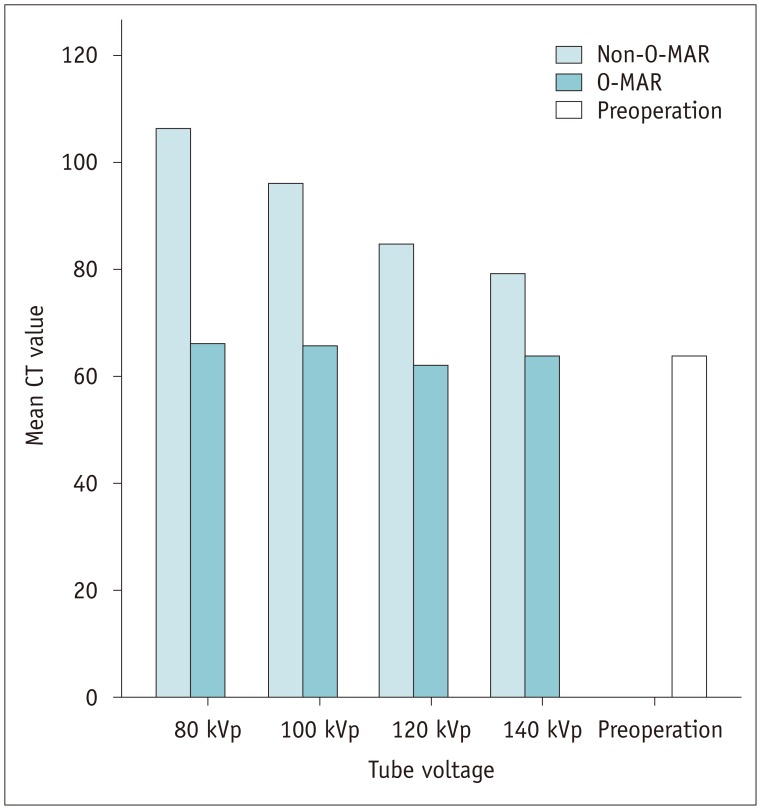
As shown in Figure 4, at all tube voltages, the mean muscular CT attenuation on non-O-MAR images was significantly higher than that on O-MAR images (p < 0.001). Furthermore, the mean muscular CT attenuation on non-O-MAR images was significantly higher than that of the preoperative images (p < 0.010), with no significant difference between O-MAR images and the preoperative images (p > 0.050).
AI
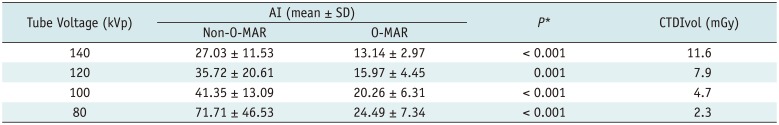
As illustrated in Table 2: 1) the AI of O-MAR images was decreased > 50% by O-MAR at all four tube voltages (p ≤ 0.001); 2) AI tended to decrease with the elevated tube voltage on both O-MAR and non-O-MAR images, and the repeated measures ANOVA (LSD) showed significant differences among four tube voltages on O-MAR images and non-O-MAR images, respectively (all p < 0.050); 3) O-MAR images at 140 kVp and 120 kVp had much lower AI than that of non-O-MAR images at 140 kVp. And 100 kVp; and 80 kVp resulted in almost the same AI, with decrease in the CTDIvol to only 40% and 20% of the value measured at 140 kVp, respectively.
SNR
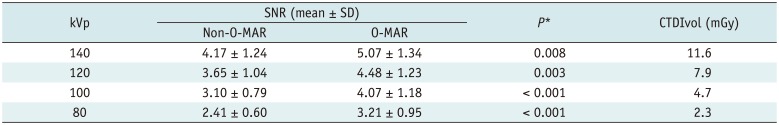
The results are shown in Table 3. In brief, 1) the SNR was significantly improved by O-MAR at all four tube voltages (p < 0.010); 2) SNR tended to increase with the increased tube voltage on O-MAR images and non-O-MAR images, and the repeated measures ANOVA (LSD) showed significant differences in SNR among four tube voltages for O-MAR and non-O-MAR images, respectively (all p < 0.050); 3) compared with the SNR of non-O-MAR images at 140 kVp, O-MAR images at the same tube voltage had a better SNR. When tube voltage decreased to 120 kVp and 100 kVp, the SNR was almost the same and the CTDIvol decreased to 60% and 40% of the value measured at 140 kVp, respectively. The SNR at 80 kVp was lower, although the CTDIvol decreased further.
Subjective Evaluation of Image Quality
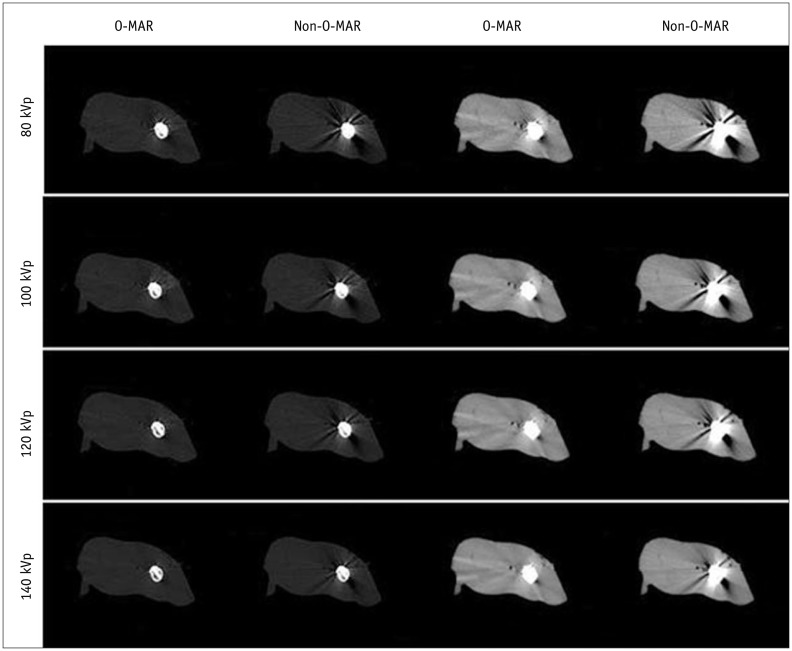
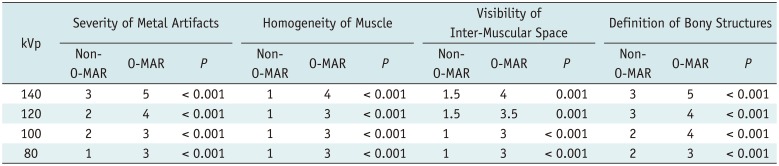
As shown in Table 4, all subjective indices of O-MAR images were scored significantly higher than non-O-MAR images at all four tube voltages (p < 0.001). On O-MAR images, the severity and scope of metal artifacts were reduced, muscles were more homogeneous in density, the interspaces between bone and metal implants were clearer, and the cortex, medullary cavity and inter-muscular space were better visualized (Fig. 5).
Although the image quality worsened with decreasing tube voltage, all O-MAR images at all four tube voltage levels were suitable for diagnosis with scores of ≥ 3. However, almost all indices of non-O-MAR images were scored < 3 and were clinically unacceptable, except for the severity of the metal artifacts index at 140 kVp and the definition of bony structures index at 140 kVp and 120 kVp (Table 4).
Following objective evaluation, O-MAR images at 100 kVp showed the same image quality as non-O-MAR images at 140 kVp; subjective evaluation confirmed the diagnostic acceptance of O-MAR images at 100 kVp. Therefore, we chose 100 kVp as the tube voltage for subsequent clinical use.
Evaluation of Clinical Cases
At 100 kVp for clinical study, the range of CTDIvol was 7.9–14.71 mGy, with a mean value of 10.86 mGy, which was only 60% of that at 120 kVp with the same mAs.
Among the 20 clinical cases in this study, images of 19 (95%) were considered diagnostically acceptable. The score range of severity of metal artifacts was 3 to 4 points, with the median of 4 points; and the range of definition of bony structures was 3 to 5 points, with the median of 4 points. The one unacceptable case (5%) was scored only 1 point for both severity of metal artifacts and definition of bony structures.
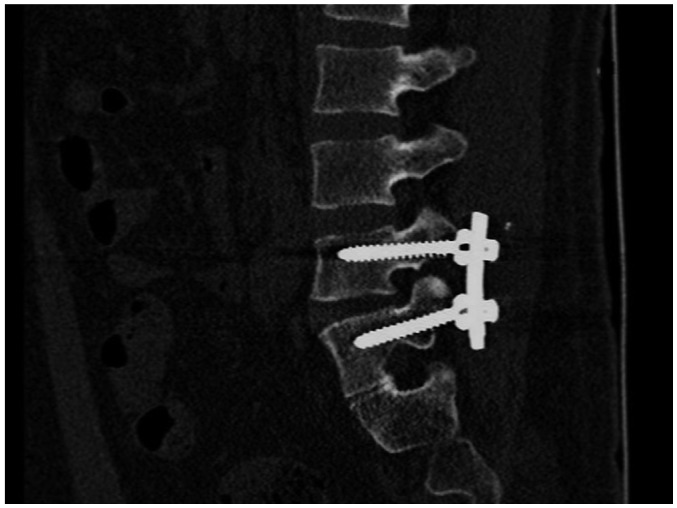
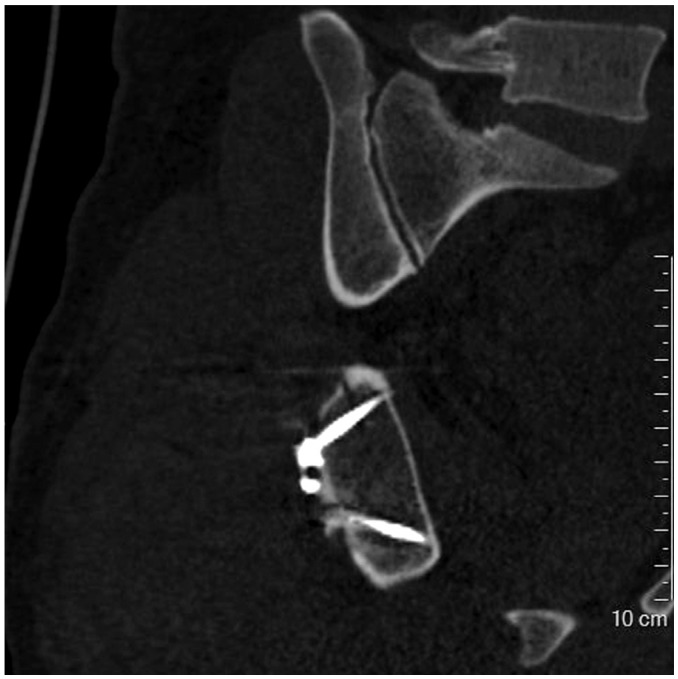
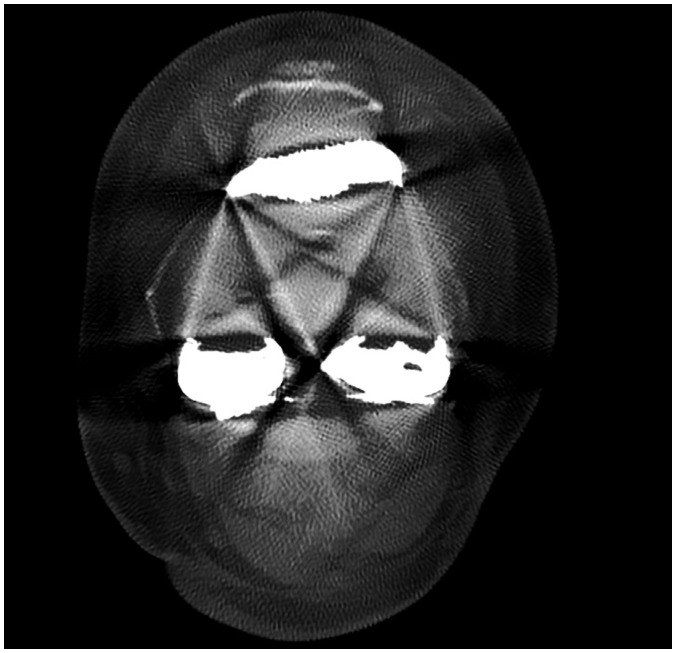
Figure 6 shows an example with subjective scores of 4 points, which was considered clinical acceptable. By this O-MAR image, it could be confirmed that the implants were at appropriate position with no looseness or displacement, and no penetration to the opposite cortex. Figure 7 shows another successful example of O-MAR. CT scan was performed 2 weeks after orthopedic operation. By this O-MAR image with less artifact, osteoporosis of bones surrounding the metal and none-healing of fracture could be evaluated accurately. Figure 8 shows the image of the only case with a knee joint prosthesis with severe metal artifacts. Both bony structures as well as metal implants were obscured and it was deemed unsatisfactory.
DISCUSSION
Orthopedic metal artifact reduction algorithm is a commercial software designed to reduce metal artifacts due to large-sized orthopedic metal implants. In this study, we evaluated O-MAR in CT orthopedic metal artifacts reduction at different tube voltages, identified an appropriate low tube voltage for clinical practice, and investigated its clinical application.
Results from comparing muscular CT attenuation in the animal experiments indicated the accuracy and reliability of O-MAR, with no significant difference between preoperative and postoperative O-MAR images. Furthermore, we confirmed the validity of O-MAR by comparing between postoperative O-MAR and non-O-MAR images. The results showed that the AI of O-MAR images was decreased by > 50%, the SNR was increased by 23–33%, and all O-MAR images were subjectively considered diagnostically acceptable.
The efficacy was attributed to the following characteristics of O-MAR: firstly, O-MAR is a projection data modification method in which, the data modification procedure is performed by an iterative process (8). For removal of metal artifacts using O-MAR, the projection data of the original images, the pure metal images and the tissue classification images were compared and computed continuously until no metal projection data were detected in the original data, and the final images were reconstructed by filtered back projection (FBP). Based on iterative processes, metal artifacts are reduced step by step; hence, O-MAR is more suitable for large-sized metal implants in the field of orthopedics. Secondly, to increase the precision of metal artifact reduction, O-MAR generates a binary pure metal image based on CT attenuation on the original image, with a value of 0 for the metal domain and 1 for the non-metal domain, thus the projection data modification is only aimed at the metal domain with a value of 0. Therefore, theoretically O-MAR has no side effects on the non-metal portion. Thirdly, to increase efficiency, O-MAR involves a special tissue classification image reconstruction procedure. After removal of the metal domain from the original projection data, interpolation is applied to fill the lost projection data to reduce the variation in the acquired projections, by which the tissue classification images are reconstructed. This special procedure may avoid the interference of metal artifacts on tissue segmentation on the original images, increase the accuracy, and facilitate efficient removal of metal artifacts.
In addition, O-MAR showed efficiency even at low tube voltages, possibly due to the accurate pure metal distinction and tissue segmentation at low tube voltages. First, the markedly higher CT attenuation of metal objects than surrounding tissues even at low tube voltages ensured the relatively accurate metal selection and pure metal image reconstruction by O-MAR based on CT attenuation. Secondly, O-MAR performed tissue segmentation on tissue classification images rather than on original images. Increased artifacts on the original images caused by low tube voltage may not influence the accuracy of tissue segmentation. Furthermore, multiple iterations of O-MAR can also guarantee efficient removal of metal artifacts at low tube voltage.
Since O-MAR is valid at low tube voltages, we determined reversal effect of O-MAR on the negative effect of low tube voltage on image quality. By cross comparison of different tube voltages, O-MAR images at 100 kVp were diagnostically acceptable and had the same AI and SNR as non-O-MAR images at the conventional voltage of 140 kVp. Therefore, with O-MAR, CT scan without loss of image quality was possible at 100 kVp rather than the commonly used 120 kVp and 140 kVp; moreover, the radiation dose was decreased by at least 40%. Thus, we used 100 kVp for the subsequent clinical CT scans.
Clinical validation of the feasibility of CT scans at the low tube voltage (100 kVp) using O-MAR was carried out in patients with orthopedic metal implants. To evaluate the general applicability of O-MAR, various parts of the body were randomly chosen for CT scans, including the maxillofacial region, spine, pelvis, and limbs. The metal implants included spine fixation systems, traumatic internal fixation systems and an artificial prosthesis, regardless of the metal type. The results indicated that the images of 19 cases (95%) were subjectively scored ≥ 3 and were diagnostically acceptable, which confirmed the feasibility of O-MAR. As illustrated by Figures 6, 7, the severity of metal artifacts and the definition of bony structures were all evaluated 4 points, indicative of little metal artifacts with no obvious distortion; hence, the surrounding bony structures could be visualized clearly. By these images, orthopedic clinicians could ascertain the relationship among bones and the metal implants (e.g., the appropriate position or depth of metal implants, no penetration of the opposite cortex, no looseness or displacement, etc.), evaluate the status of bones surrounding the metal (e.g., osteoporosis, osteomalacia, or infarction), and observe fracture healing in cases of fractures. Thus, this methodology would facilitate accurate postoperative assessment of patients (3). The failure in only one patient with a knee joint prosthesis in this study could be attributed to the metal being too near the skin, which can lead to erroneous reconstruction by O-MAR (8).
Recently, although advanced metal artifacts reduction techniques have achieved some success, their drawbacks cannot be ignored. For example, increasing tube voltage and current increases radiation exposure and simultaneously decreases the contrast resolution (121314); spectral CT requires special equipment and post-processing software, and scanning dose is also a concern (1516). Projection data modification methods based on FBP (e.g., interpolation) are commonly used in the clinic due to their simple and rapid computation, however, new artifacts are produced due to data bias produced during reconstruction (1718). Although projection-based normalized metal artifact reduction can reduce these artifacts to a certain degree, it is still unsuitable for large-sized metal objects (19). Iterative reconstruction is an encouraging method that can reconstruct images using incomplete projection data (202122). Although a recent study showed that O-MAR may induce artifacts in spinal fixation rods in a thoracic phantom (23), Jeong et al. (10), by both phantom and clinical study, confirmed that abdominal CT could benefit from O-MAR. In this study, O-MAR, a projection data modification method using an iterative procedure, showed accurate reduction in metal artifacts and facilitated low-tube-voltage CT assessment in most clinical cases. However, failure can still occur in certain scenarios.
Our study has some limitations. First, all metal implants were small in volume and simple in structure due to the somatotype of the animal recipients. Although good images were obtained in several clinical applications, the number of clinical cases was small. A large-sample clinical study should be conducted in the future. Second, this study only focused on the evaluation of image quality, without further analysis of the diagnostic efficacy of O-MAR images. Studies based on various diseases of whole body are required to further evaluate the accuracy and specificity of O-MAR. Third, in this study, multiple observations were done in a single subject, i.e., four image sections in each femur, which created clustered data structures. Routine statistical methods as used in this study might ignore the independence of clustered data and exaggerate the statistical significance of differences. Considering the clustered data structure, proper statistical analysis such as generalized estimating equation should ideally be applied in a future study (2425).
In conclusion, we introduced an iterative modification metal artifact reducing algorithm, O-MAR, which restored CT attenuation, markedly reduced AI, increased SNR, and ensured acceptable CT images even at low tube voltages. O-MAR made it possible to perform low-tube-voltage CT scans with lower radiation dose for patients with orthopedic metal implants.
 XML Download