

 PDF
PDF ePub
ePub Citation
 Print
Print


INTRODUCTION
Chronic hepatitis B (CHB) has a high prevalence in Asia. If left untreated, it can lead to serious conditions such as hepatocellular carcinoma (HCC), liver cirrhosis (LC), esophageal varices, or hepatic encephalopathy. In Korea, hepatitis B was the most common cause of the underlying liver diseases in HCC patients (1234). The liver biopsy is a gold-standard modality for evaluating the hepatic fibrosis and its stage. However, repeated liver biopsy for fibrosis evaluation has several limitations, including sampling errors related to the sample size and complications such as pain and hemorrhage (56). As such, there is a need for a noninvasive evaluation of liver fibrosis. Noninvasive assessment methods of liver fibrosis can be divided into three categories: serological markers, fibrosis biomarkers, and imaging techniques. In many previous studies, multiple serological marker-based indices have been proposed, including aspartate aminotransferase (AST)-to-platelet ratio index (APRI), fibrosis-4 (FIB-4) score, age-platelet count index, and AST/alanine aminotransferase (ALT) ratio, and these have exhibited good correlations with the pathology of liver fibrosis (789). These indices are inexpensive and simple, as they incorporate routine laboratory results that are readily available in most of the hospital laboratories. Of the above-mentioned indices, APRI and FIB-4 provide an accurate assessment of liver fibrosis in CHB patients and are used as reference modalities for liver fibrosis (10). Recently, from a meta-analysis study, Xiao et al. (11) reported that APRI and FIB-4 possess moderate diagnostic accuracy for predicting fibrosis in patients with CHB viral infection. Among the serological markers, the two indices still could be considered as options for predicting fibrosis from CHB infection in regions with limited healthcare resources.
Gadolinium ethoxybenzyl diethylenetriaminepentaacetic acid or gadoxetic acid (Gd-EOB-DTPA) is an extracellular, hepatocyte-specific magnetic resonance imaging (MRI) contrast agent used to evaluate focal hepatic lesions such as HCC, cholangiocarcinoma, and hemangioma, as well as for liver perfusion, extracellular diffusion, and bile excretion analysis (11121314). This contrast agent is absorbed by organic anion transporting polypeptides (OATPB1/B3) and metabolized in hepatocytes during the hepatobiliary (HB) phase, which occurs approximately 15–20 minutes after injection (151617). In LC, the expression level and activity of OATPB1/B3 are decreased, and the liver signal intensity in the HB phase is weaker in the cirrhotic portion relative to the normal liver parenchyma, yielding decreased signal intensity and inhomogeneous enhancement during the HB phase. In previous studies, the histogram in HB phase was well correlated with liver fibrosis grade and this notion was supported by the fact that heterogeneity in HB phase may be correlated with liver fibrosis grade (16171819).
We hypothesized that we could suspect the degree of liver fibrosis by calculating liver enhancement heterogeneity in the HB phase, and accordingly, developed new MATLAB (R2012a, MathWorks, Natick, MA, USA)-based software to identify inhomogeneous signal intensities calculated from a coefficient of variation (CV) map to objectively quantify liver parenchymal heterogeneity.
In this paper, we aimed to evaluate the heterogeneity of liver parenchyma on Gd-EOB-DTPA-enhanced MR images, using CV value processed by our MATLAB-based software, and to demonstrate a correlation between the calculated heterogeneity and the calculated serologic markers including APRI and FIB-4, which have been known to have diagnostic accuracy for predicting hepatic fibrosis in CHB patients.
Go to : 
MATERIALS AND METHODS
Study Population
The local Institutional Review Board (IRB) approved this retrospective study and waived the requirement for written informed consent. A computer search identified a total of 138 patients with serologically confirmed CHB who underwent Gd-EOB-DTPA-enhanced MRI from December 1, 2013 to April 1, 2015 at our hospital. The exclusion criteria were inpatients that underwent Gd-EOB-DTPA-enhanced MRI (n = 32), patients who underwent a right lobectomy (n = 10), patient having scans with poor image quality (n = 6), and patients who did not undergo a laboratory study within 7 days from the MR study date (n = 9). Finally, 81 patients were included in the study (Tables 1, 2). Patients were divided into 3 subgroups according to their APRI: ≤ 0.5, non-significant fibrosis group (group I, n = 17); 0.5–1.4, significant fibrosis group (group II, n = 46); and ≥ 1.4, advanced fibrosis group (group III, n = 18) (9, 10). In addition, the patients were divided into control group and three groups based on FIB-4 threshold < 1.45 (group A, n = 29), 1.45–3.25 (group B, n = 42), and > 3.25 (group C, n = 10). Xiao et al. (11) cited this cut-off value in their study. None of the patients with CHB had a viral hepatitis C coinfection, biliary cirrhosis, Wilson disease, or autoimmune hepatitis. In addition, 36 patients without chronic liver disease who underwent Gd-EOB-DTPA-enhanced MRI during the study period were enrolled as the control group; colon cancer with liver metastasis (n = 11), biopsy for solitary hepatic tumor, which was confirmed benign tumor (n = 19).
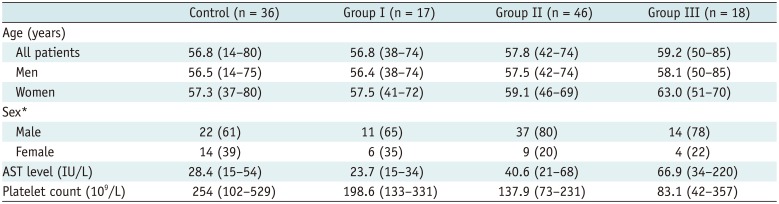
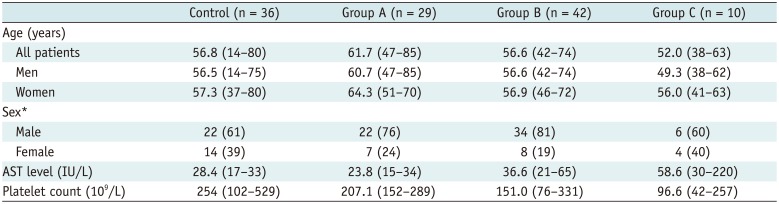
Table 1
Demographic and Biochemical Characteristics of Patients Grouped by APRI Values
![]()
Table 2
Demographic and Biochemical Characteristics of Patients Grouped by FIB-4 Values
![]()
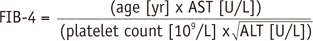
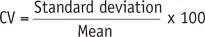
All serologic data were obtained through laboratory studies conducted within 7 days from the Gd-EOB-DTPA-enhanced MRI study date. APRI and FIB-4 were calculated using the following formula:
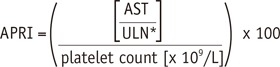
*The upper limit of normal (ULN) AST was 35 in this study.
MRI
Magnetic resonance imaging was performed on a 3T scanner (Achieva; Philips Healthcare, Best, the Netherlands) with a 32-channel receiver body matrix coil. In all subjects, imaging was performed under fasting condition. All MR images were obtained in the axial plane, and T2-weighted images (WI) were additionally acquired in the coronal plane. The Gd-EOB-DTPA-enhanced MRI was performed before and after the administration of Gd-EOB-DTPA (Primovist; Bayer Healthcare, Berlin, Germany) and comprised of T1WI, acquired with a 3-dimensional T1 high-resolution isotropic volume excitation pulse sequence. Gd-EOB-DTPA (0.1 mL/kg body weight) was injected intravenously as a rapid bolus at a rate of 1.5 mL/s via a power injector (Sonic Shot 50; Nemoto Kyorindo Co., Ltd., Tokyo, Japan) while the patient was in the bore of the magnet. This was followed by a 15-mL flush with normal saline (1.5 mL/s). Arterial-phase imaging started after a modified scan delay with visual confirmation of contrast agent arrival in the abdominal aorta using a fluoroscopic triggering injection method. Subsequent contrast-enhanced-MRI was initiated at 50 seconds, 3 minutes, and 20 minutes (or HB phase) after the start of the bolus injection (1320).
Imaging Analysis and Measurement of Hepatic Fibrosis
To measure hepatic fibrosis quantitatively, we developed a MATLAB (R2012a, MathWorks, Natick, MA, USA)-based software to calculate a CV map, as suggested by Li et al. (21). The following procedure was used to calculate the CV map: bias correction of intensity inhomogeneity, followed by calculation of the CV map by dividing the CV value by each pixel value in the circular region of interest (ROI; diameter = 40 pixels) and, finally, calculating the mean value on the CV map (Fig. 1).
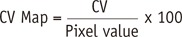
 | Fig. 1Workflow for calculation of coefficients of variation (CV) in control subject (A) and in patient with chronic hepatitis B (B) in hepatobiliary phase of Gd-EOB-DTPA-enhanced MRI.To measure hepatic fibrosis quantitatively, MATLAB-based software was used to calculate CV map. After acquisition of MR images, bias correction and segmentation of liver parenchyma were performed, and then mean value of CV map on region of interest at anterior segment of right lobe of liver was calculated. Gd-EOB-DTPA = gadolinium ethoxybenzyl diethylenetriaminepentaacetic acid or gadoxetic acid, MRI = magnetic resonance imaging
|
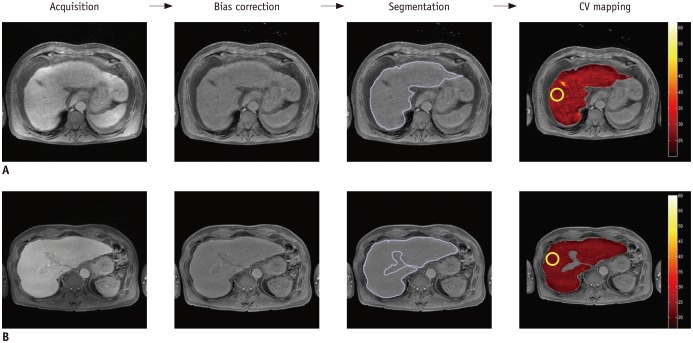
Gd-EOB-DTPA-enhanced axial images obtained during the HB phase MR image were obtained in Digital Imaging and Communications in Medicine format and stored on console containing the MATLAB-based program. For quantitative measurements of liver parenchymal heterogeneity, two abdominal radiologists (with 24 years of experience and with 4 years of experience in abdominal imaging), blinded to clinical information and pathological fibrosis grades, performed the procedure by positioning separate circular ROIs (diameter = 40 pixels) on the selected MR images, which was bias-corrected. In all subjects, ROIs were placed on the anterior segment of the right hepatic lobe with no overlap over large vessels and focal lesions such as cysts or tumors (Fig. 2). Each radiologist measured ROIs 3 times in the selected MR images and calculated the mean.
 | Fig. 2Images show representative CV maps on control and patients with chronic hepatitis B of group I, II, and III on HB phases of Gd-EOB-DTPA-enhanced MRI.CV values are 3.54, 3.58, 5.58, and 6.7 in HB phase, respectively. CV = coefficients of variation, Gd-EOB-DTPA = gadolinium ethoxybenzyl diethylenetriaminepentaacetic acid or gadoxetic acid, HB = hepatobiliary, MRI = magnetic resonance imaging
|
Statistical Analysis
The relationships between the CV values on HB-phase images and APRI and FIB-4 were evaluated using nonparametric Spearman correlation coefficients. Comparisons of CV values between the control group and CHB groups I, II, or III and between the control group and CHB groups A, B, or C were performed using the Kruskal-Wallis test and intergroup comparisons were performed using the Mann-Whitney test. The diagnostic performance of CV with respect to significant liver fibrosis was evaluated using a receiver-operating characteristic (ROC) curve and calculated two times; the first one was for the APRI version (> 0.5) and the second one was for the FIB-4 version (> 1.45). The ROC curve is a plot of the sensitivity versus (100-specificity) values at all possible cut-off values. Optimal cut-off values were selected using a common optimization step that maximized the Youden index for predicting significant fibrosis; sensitivity and specificity were calculated from the same data without further adjustments. The inter-observer agreement was performed based on the intraclass correlation coefficient. The Kruskal-Wallis test, Mann-Whitney test, Spearman correlation coefficients, and intraclass correlation coefficient were conducted using SPSS version 18.0 (SPSS Inc., Chicago, IL, USA) and ROC, sensitivity, and specificity were analyzed with MedCalc version 15.6 (MedCalc, Mariakerke, Belgium).
Go to :
RESULTS
The mean CV and APRI values for the control and CHB groups are listed in Table 3. In the HB phase of enhanced T1WI, the mean CV values of control and patients in groups I, II, and III by APRI were 4.08 ± 0.92, 4.24 ± 0.80, 5.64 ± 1.11, and 5.73 ± 1.28, respectively (p < 0.001) and the mean CV values of control and patients in groups A, B, and C by FIB-4 were 4.08 ± 0.92, 4.22 ± 0.95, 5.40 ± 1.19, and 5.71 ± 1.17, respectively (p < 0.001). The CV values in groups II and III were significantly higher than the values in the control group and group I (p < 0.001). The comparative analysis of CV values among the control group and CHB groups revealed higher mean CV values in CHB group III/C, followed by those in CHB group II/B, CHB group I/A, and the control group, and these differences were significant (p < 0.001) (Table 3). Pairwise comparisons of CHB groups I/A and II/B with respect to HB phase MR images revealed very significant results (p < 0.001).
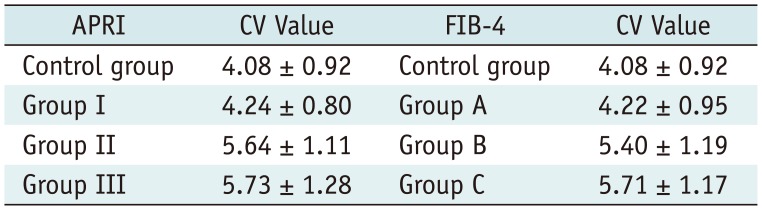
Table 3
Mean Values of Coefficients of Variation (CV) in Liver Parenchyma in Hepatobiliary Phase Images among Control and Chronic Hepatitis B Groups by Using APRI and FIB-4
![]()
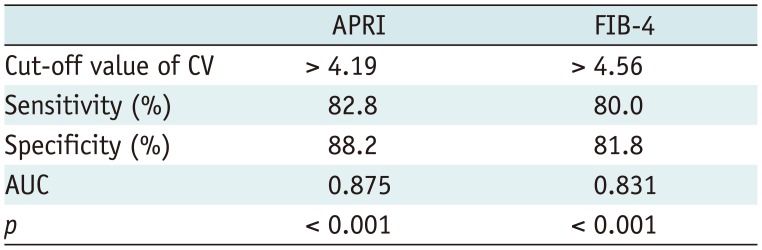
An analysis of the relationship between the CV with the APRI and FIB-4 among patients with CHB revealed moderate correlations; r value for APRI and FIB-4 was 0.392 and 0.294, respectively (Fig. 3). ROC curves for the CVs in CHB patients with or without significant fibrosis are described in Figure 4 and Table 4. The area under the curve (AUC) was 0.875 in APRI version with an optimal cut-off value of 4.19 for predicting significant fibrosis in the HB phase. The sensitivity and specificity at the optimal cut-off values of the HB phase were 82.8 and 88.2%, respectively. Secondly, the AUC was 0.831 in FIB-4 version with an optimal cut-off value of 4.56. The sensitivity and specificity at the optimal cut-off values were, 80.0 and 81.8%, respectively on the HB phase. The intraclass correlation coefficient between the two radiologists was 0.947 (95% CI, 0.918–0.966) in HB phase image.
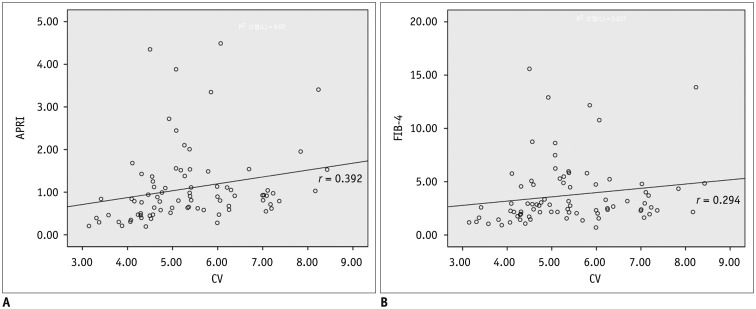 | Fig. 3Correlation of CV with APRI and FIB-4.
A. Shows correlation between aspartate aminotransferase-to-platelet ratio and coefficient of variation (CV) (r = 0.392, p < 0.001). B. Shows correlation between FIB-4 and CV values (r = 0.294, p < 0.001) in HB phases of Gd-EOB-DTPA-enhanced MRI. FIB-4 = fibrosis-4, Gd-EOB-DTPA = gadolinium ethoxybenzyl diethylenetriaminepentaacetic acid or gadoxetic acid, HB = hepatobiliary, MRI = magnetic resonance imaging
|
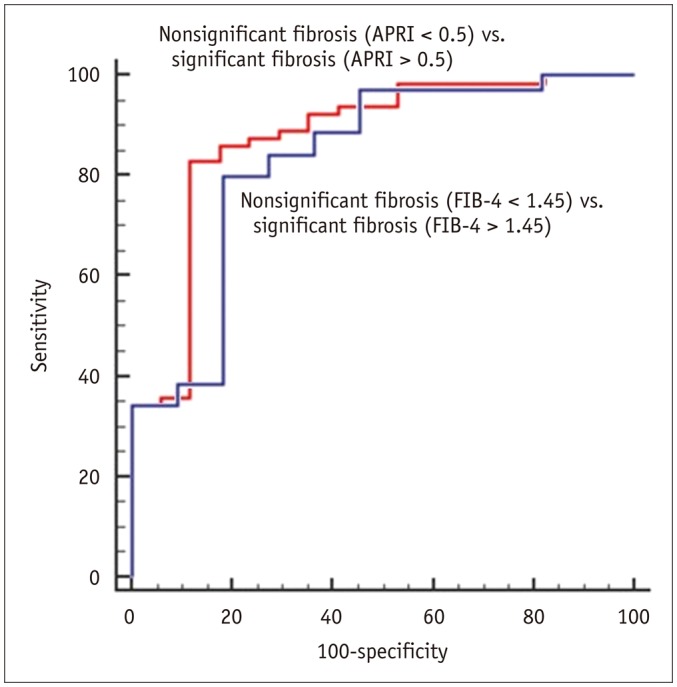 | Fig. 4Receiver operating characteristic curves of coefficient of variation used for diagnosis in patient with significant fibrosis (aspartate aminotransferase-to-platelet ratio > 0.5 and FIB-4 score > 1.45).AUC was 0.875 in APRI version with optimal cut-off values of 4.1866 (red line). AUC was 0.831 in FIB-4 version with optimal cut-off values of 4.5642 (blue line). APRI = aspartate aminotransferase to platelet ratio index, AUC = area under the curve, FIB-4 = fibrosis-4
|
Go to :
DISCUSSION
Gd-EOB-DTPA is a liver-specific contrast agent. Gd-EOB-DTPA transport from the sinusoids to hepatocytes is mostly mediated by OATPB1/B3, and its excretion into the bile duct is mediated by the multidrug resistance protein 2 (MRP2) (212223242526). Progressive liver fibrosis has been reported to reduce OATPB1/B3 activity and features the activation of collagen-producing hepatic stellate cells, collagen deposition in the subendothelial space of Disse, and all of which may promote the development of a fibrotic barrier in the liver parenchyma and reduced Gd-EOB-DTPA uptake (272829). It was also supported by another literature. In a study by Tsuda and Matsui (29), higher levels of MRP2 activity were observed in cirrhotic rats, indicating that advanced liver fibrosis may lead to earlier Gd-EOB-DTPA excretion. Therefore, the absence of even distribution of Gd-EOB-DTPA in all liver parenchymal compartments and hepatocytes has been observed after administration of the contrast agent to CHB patients, thus leading to inhomogeneous enhancement of the liver parenchyma.
Our results revealed a significant difference in mean CV values between CHB groups I/A and II/B. This finding indicates that heterogeneous liver parenchymal enhancement is helpful in determining the presence of significant fibrosis in patients with CHB. We found the diagnostic accuracy of CV value, which is comparable to APRI and FIB-4 for predicting CHB-related fibrosis. The results showed that CV had ROC values of 0.875 in APRI version and 0.831 in FIB-4 version. The results suggested that the CV value had modest accuracy for detecting significant fibrosis. The AUC results from another previous study on quantification of liver fibrosis in CHB by imaging modality were similar to our results. For example, in a meta-analysis of the fibroscan in CHB, the AUC for the diagnosis of significant fibrosis (F2) was 0.859 (30). In a study by Shi et al. (31), MR elastography demonstrated good diagnostic performance for ≥ F2 (AUC values was 0.986) and the value was higher than our results.
The CV measurements of liver fibrosis are associated with many advantages. First, this type of liver fibrosis assessment is very simple and does not require new imaging equipment. Recently, MR elastography, ultrasonographic elastography, and fibroscan were developed for liver fibrosis evaluation. However, all of these techniques require new imaging equipment, thus placing a restriction on access (3233). Second, CV mapping does not require any additional MR scanning. This technique is mediated by software and objectively quantifies liver parenchymal heterogeneity. Third, heterogeneity measurements require only Gd-EOB-DTPA-enhanced MRI, which includes information about the liver function and simultaneously facilitates HCC screening. Fourth, measurement using CV mapping is highly reproducible, which is revealed by a high inter-observer agreement of 0.947 between the most experienced radiologist and one with less experience. Any radiologist or clinician can use the CV value on HB phase MR image by following simple instructions using this software.
Nowadays, Gd-EOB-DTPA enhanced MRI has become popular and has revealed high diagnostic accuracy for HCC surveillance. Based on our results, it is hypothesized that the CV values would impart an additional value for Gd-EOB-DTPA-enhanced MR in predicting advanced hepatic fibrosis or cirrhosis, and a radiologist or clinician could pay attention to the patients with high CV values. Further study is needed for analyzing the correlation between CV values and pathologic fibrosis grades.
When this study was designed, only outpatients were enrolled as laboratory data are influenced by the patient's general condition. Moreover, many patients with CHB and advanced LC had comorbid HCC, ascites, or portal hypertension and were treated with various drugs, including chemotherapeutic agents. These drugs are metabolized in the liver and cause liver toxicity. Accordingly, we wanted to exclude other potential influences on AST or platelet levels and therefore included only outpatients in our study.
This study has several limitations. First, LC and normal liver parenchyma were not histologically confirmed in our patient population, as the patients were followed up using noninvasive evaluations such as blood tests or imaging modalities, and only a few patients with CHB who had special indications underwent liver biopsy at our hospital. As a result, we depended on clinical data to obtain a reference degree of liver fibrosis and evaluated the heterogeneity of liver enhancement effects based on APRI and FIB-4, rather than on the histological grading of fibrosis. Second, we positioned the ROI at the right anterior or posterior segment of the liver (segments 5/6 and 7/8) because this area does not contain major vessels and is far from the heart, thus reducing the incidence of cardiac motion artifacts. However, the CV of the ROI area is not representative of the whole liver, and thus some selection bias might have occurred. Third, this was a retrospective study and the APRI and FIB-4 values were used for a reference liver fibrosis assessment; accordingly, we included laboratory data obtained within 7 days from the Gd-EOB-DTPA-enhanced MRI study date to minimize the influence of factors other than liver fibrosis on the AST and platelet levels. However, this effort could not remove all bias.
In conclusion, this study was the first study to evaluate liver fibrosis by calculating CV values in liver parenchyma. CV values were well correlated with APRI and FIB-4 index. Among patients with CHB, the CV values differed significantly between those with non-significant and significant liver fibrosis. As such, a CV map on gadoxetic acid-enhanced MRI could render the possibility of quantitatively measuring hepatic fibrosis in patients with CHB.
Go to :
 XML Download