

 PDF
PDF ePub
ePub Citation
 Print
Print


INTRODUCTION
Atherosclerosis of intracranial arteries is one of the major causes of acute ischemic stroke (12). Intracranial atherosclerosis could result in two types of ischemic stroke (345). The first is a parent artery disease (PAD) or a large vessel disease, which is due to the atherosclerosis in large arteries. The second, a small artery disease (SAD), results from an occlusion of small perforator arteries containing atherosclerotic plaques (6). For middle cerebral artery (MCA), MCA territorial infarcts and striatocapsular infarcts including proximal subcortical infarcts correspond to PAD (7). Conversely, acute distal subcortical infarcts or acute lacunar infarcts on a MCA perforator territory can be categorized as SAD (8). Therefore, detection of offending intracranial arteries could help elucidate pathophysiology of acute ischemic stroke associated with intracranial arterial atherosclerosis. Localization of offending arteries could be used for proper treatment guidelines, e.g., choosing between stenting and medical therapy (91011). Recently, several reports describe visualizing intracranial arterial walls using a high-resolution magnetic resonance imaging (MRI) (121314). Some studies demonstrated that the enhancement of intracranial arterial walls was a marker for active diseases and a potential marker for culprit atherosclerotic lesions (1315). However, their methods of analyses were in general subjective and qualitative. A previously used quantitative measurement of vessel wall enhancement used a region-of-interest (ROI) method (15). Locating ROIs within tiny and thin intracranial arterial wall is not convenient and can be affected by errors and partial volume averaging effects. A recent study suggested that histogram analysis was an objective way to quantify measurements over a ROI method (16). We hypothesized that PAD and SAD in MCA territories had different degrees of enhancement in the M1 segment of MCA due to different locations of offending arteries. We used a histogram analysis, as well as a qualitative analysis as the method of interpretation. The purpose of this study was to compare the histogram analysis results with the visual analysis results in the assessment of MCA wall enhancement in patients with acute stroke.
MATERIALS AND METHODS
Subjects and Diagnostic Categorization
The study design was a retrospective diagnostic accuracy study. Our Institutional Review Board waived the patients' informed consents. From January 2013 to December 2013, 82 consecutive stroke patients were identified by reviewing the stroke registry at a tertiary hospital. They were treated for acute ischemic stroke within 3 days of symptom onset and underwent 3T MRI scans with a 3-dimensional contrast-enhanced T1-weighted turbo spin echo image (3D CE T1-TSE) with a black blood preparation. We excluded patients who met the following criteria: 1) acute ischemic stroke, other than MCA diseases, such as diseases involving carotid bulb, distal internal carotid artery and posterior circulation (n = 19); 2) cardioembolic stroke (n = 13); 3) patients with unknown origins of stroke or other causes such as vasculitis and Moyamoya diseases (n = 11); 4) final diagnosis of transient ischemic attack after stroke workup (n = 9), and 5) the loss of 3D CE T1-TSE raw data or with the poor image quality (n = 5). Therefore, a total of 25 patients of acute infarction in MCA territories were included in this study. Two stroke-specialized neurologists reviewed medical records, relevant clinical findings, and stroke images including diffusion-weighted images (DWI), fluid attenuation inversion recovery (FLAIR) images, and magnetic resonance angiography (MRA). However, they were blinded to the findings in the 3D CE T1-TSE images. PAD and SAD were classified based on lesion patterns (17). In short, PAD included MCA territorial lobar and cortical infarcts, and proximal subcortical infarcts corresponded to PAD (7). SAD included acute distal subcortical infarcts on the ipsilateral MCA perforator territories (8). A single acute lacunar infarction (less than 2 cm in diameter) in an ipsilateral MCA perforator territory was also considered as SAD. Finally, 15 patients were classified as PAD, and the remaining 10 patients were classified as SAD.
Clinical Data
The age, sex, time of the symptom onset, and risk factor information of the patients were collected. The risk factors including hypertension (defined as receiving medication for hypertension or blood pressure > 140/90 mm Hg on repeated measurements), diabetes (defined as receiving medication for diabetes mellitus, fasting blood sugar ≥ 126 mg/dL, or two-hour postprandial blood sugar ≥ 200 mg/dL), previous history of ischemic stroke, smoking history (current smoker or a patient who had quit smoking < 6 months previously), history of alcohol use, and hyperlipidemia (defined as receiving cholesterol-reducing agents or an overnight fasting cholesterol level > 200 mg/dL or low-density lipoprotein ≥ 130 mg/dL), were collected from the stroke registry and medical records. The National Institute of Health Stroke Scale (NIHSS) scores were measured by neurologists at admission.
MR Acquisitions
The MRI and MRA scans were acquired using a 3T MRI machine (Verio; Siemens AG, Erlangen, Germany) with a 16-channel head and neck coil. A routine MRI for stroke patients included DWI, FLAIR, time-of-flight (TOF) MRA for cerebral arteries, contrast-enhanced MRA of supra-aortic arteries, and 3D CE T1-TSE. Intrinsic characteristics of a turbo-spin echo sequence and an applied motion-sensitizing magnetization preparation formed black-blood images of 3D CE T1-TSE (18). 3D CE T1-TSE were acquired 5 minutes after an intravenous injection of 0.1 mmol/kg of gadobutrol (Gadovist; Bayer Healthcare, Germany) at a rate of 1.5 mL/s. The parameters of the 3D CE T1-TSE with black blood preparation were a single slab with 192 sagittal slices; voxel size of 0.9 × 0.9 × 0.9 mm without inter-slice gaps; field of view 173 × 250 × 250 mm; repetition time/echo time/flip angle/echo train length = 700 ms/12 ms/120°/42; a number of excitation of 1; and the parallel imaging parameter of 2. The acquisition time of the 3D CE T1-TSE was 6 minutes and 3 seconds.
Qualitative Analysis of 3D CE T1-TSE Images
Two neuroradiologists (with 8-year and 4-year experienced, respectively) reviewed the 3D CE T1-TSE images for visual enhancement scores of the M1 segments in MCA. They were blinded to the patients' clinical and other MR imaging findings. Three orthogonal plane images (axial, coronal, and sagittal images) of the 3D CE T1-TSE images were reviewed to assess the enhancement of MCA walls. A visual analysis of enhancement was based on a three-point scale of the previously suggested grading system (1519): grade 0, enhancement similar to or less than that of the intracranial arterial walls without plaque; grade 1, enhancement greater than that of grade 0, but less than that of the pituitary infundibulum; and grade 2, enhancement similar to or greater than that of the pituitary infundibulum. For each patient, the M1 segments of the lesion side and contralateral side of MCA to the relevant stroke were evaluated. Cases with discrepancies between raters were discussed until a consensus was reached.
Quantitative Analysis of TOF-MRA and 3D CE T1-TSE
Subsequently, a 4-year experienced neuroradiologist performed a histogram analysis of 3D CE T1-TSE images two weeks after the qualitative analysis. After reviewing the maximum intensity projection images of TOF-MRA, the rater measured the degree of MCA stenosis. A diameter of the proximal normal M1 segment (M1n) and the most severe stenotic portion of the M1 segment (M1s) were measured. The degree of stenosis was defined using the equation: Degree of stenosis (%) = (M1n - M1s) / M1n (20).
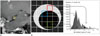
To compare the stenosis and enhancement degree for markers of offending arteries, five consecutive sagittal source images (3D CE T1-TSE) containing the most severe MCA stenosis were used for drawing ROIs after reviewing the TOF-MRA images (Fig. 1A). The ROIs were drawn on the outer margin of MCA, which included the MCA wall and lumen (Fig. 1A). Therefore, the volume of interest (VOI) was a summation of five consecutive ROIs including the arterial walls and lumens, and the voxel data was displayed on a histogram (Fig. 1B). The signal intensities of all voxels in VOIs were normalized by a mean signal intensity of the genu of corpus callosum, which was located out of the MCA territory (21). We analyzed two different metrics representing VOIs i.e., geometric means (GM) and percentile values (Fig. 1B). Because the distributions of histograms were right-side skewed, GM was a better representative value than the arithmetic mean (22). The GM of a VOI, which was a center of histogram mass, was calculated using a log-transformation. We compared 20 different percentile values of VOIs from the 5th to 100th percentiles with increments of five percentiles. Then, the 90th percentile (90P) was chosen as an optimal discriminator and used for analyses. The measurements of a quantitative analysis were performed by ImageJ (ver 1.47, U. S. National Institutes of Health, Bethesda, MD, USA; http://imagej.nih.gov/ij/) and by a commercially available software (Excel 2007, Microsoft).
Statistical Analysis
The differences of demographics, risk factors, and NIHSS scores between the two groups were analyzed by a chi-square and Mann-Whitney U test. Measurements of the degree of stenosis, visual enhancement score, GM and 90P values of the VOIs between two groups were compared using a Mann-Whitney U test. A diagnostic performance was analyzed by a receiver operating characteristic (ROC) curve: the volume of VOI, the degree of stenosis, the enhancement score, GM and the 90P value of VOI. The cut-off values with the greatest Youden's J index were chosen for determining sensitivity and specificity. Comparisons of the areas under the ROC curves (AUCs) were performed by Delong's test, with corrections for multiple comparisons by a Bonferroni correction.
A commercially available software (MedCalc for Windows, Version 13.0.0.0; MedCalc Software, Mariakerke, Belgium) was used for analysis. The statistical significance was set to be two-tailed p value < 0.05.
RESULTS
Qualitative Analysis
Baseline characteristics of the 15 PAD patients and 10 SAD patients were presented in Table 1. Demographics and risk factors showed no significant group-wise differences. The NIHSS score was significantly higher in PAD than in SAD (Table 1). The visual enhancement scores of the PAD group were statistically higher than those of the SAD group. In the PAD group, The visual enhancement scores of the lesion side were significantly higher than those of the contralateral side in the PAD group, as compared to patients with SAD (Table 2). The PAD group also showed a higher stenosis degree of M1 segment in the lesion side than in the contralateral side. On the other hand, the mean stenosis degree of the lesion and contralateral sides in SAD were minimal (< 11 %).
Quantitative and Histogram Analysis
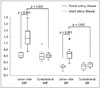
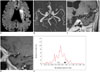
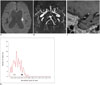
The degree of the lesion side MCA stenosis was significantly higher in PAD than in SAD. In the PAD group, the MCA stenosis in the ipsilateral side was significantly higher than that in the contralateral side (Table 2). The enhancement of the ipsilateral MCA measured by GM and 90P were higher in PAD than in SAD. Moreover, the GM and 90P of the ipsilateral MCA were higher than those of the contralateral side in the PAD patients (Fig. 2); whereas, the GM and 90P were not different between lesion and contralateral sides in the SAD patients (Table 2, Fig. 2). The different shapes in the histograms were found between PAD and SAD groups (Figs. 3, 4). The histogram from the PAD patients was more right-side skewed than that from the SAD patients.
ROC Curve Analysis
The ROC curve analysis (Table 3) results suggested that both GM and 90P of MCA enhancement were excellent discriminators in differentiating PAD from SAD, with both sensitivity and specificity of 100%. The AUC values for GM and 90P in our study sample were greater than that of stenosis of the lesion side M1 but showed no statistical significance after multiple-comparison corrections (p = 0.274). The AUCs of GM and 90P were also not significantly different from that of visual enhancement score (p = 0.914).
DISCUSSION
In this study, both quantitative and qualitative assessments of M1 segment of MCA showed stenosis and wall enhancement in PAD, which was presumed to be an offending artery of the PAD patients; these changes were not evident for SAD patients and the differences were significant. Our study showed a substantial diagnostic performance of these parameters to differentiate PAD from SAD. Especially, the quantitative metrics such as GM and 90P showed excellent sensitivity (100%) and specificity (100%) in diagnosis of PAD over SAD. This finding was concordant with previous studies, which have suggested that the contrast enhancement could be a marker for active diseases in intracranial arteries (1215). However, no previous studies have compared the enhancement between groups with different causes of stroke.
Imaging of intracranial atherosclerosis is still challenging because of the small dimensions of intracranial arterial walls and limited contrast-to-noise ratio (23). Currently, enhancement of vessel walls is a widely-accepted marker of culprit lesions, which is considered an active atherosclerotic lesion (1315). For assessing the intracranial arterial wall enhancement, black-blood images and high spatial resolution should be achieved. Although we used a submillimeter-sized voxel, even pathologic MCA wall thickness could be far smaller than the voxel size. In this case, the partial volume averaging effects among the vascular walls, lumen and the surrounding tissues are inevitable. In addition, locating ROIs within the vessel wall was challenging. To overcome this problem, we drew VOIs to include both the MCA lumen and walls instead of drawing small ROIs within the arterial walls (Fig. 1). Subsequently, we analyzed the whole voxels within the identified VOIs using a histogram analysis. Qiao et al. (15) quantified the degree of intracranial arterial wall enhancement using ROIs within the vessel walls. They quantified the degree of enhancement by obtaining both non-enhanced and contrast-enhanced images. Their method was straightforward for quantifying the degree of the intracranial artery enhancement. However, potential problems include longer acquisition times, delicacy of selecting ROIs for subtle enhancement of the vessel walls, and the mis-registration problem due to the repeated manual-drawing of ROIs on the two different images. Therefore, we used a histogram analysis method to avoid these problems.
Our results showed that the MCA enhancement was an accurate discriminator of PAD from SAD as the stenosis of M1 segment. A study based on autopsy suggested that intracranial atherosclerosis and the resultant stenosis could be associated with acute ischemic stroke (24). The following studies with MR images suggested that the atherosclerotic lesions of the intracranial arteries showed not only stenosis of the affected arteries but also the wall enhancement (51325). Stenosis and enhancement were major findings of the intracranial arterial atherosclerotic lesions. Our results from comparing the lesion and the contralateral sides revealed a significantly different enhancement in PAD. This result also suggests the clinical significance of intracranial artery enhancement, which may serve as a marker for an active inflammation of culprit arteries. A previous study showed that the enhancement score or the degree of enhancement were more suggestive of a culprit atherosclerotic lesion than the intracranial artery stenosis (15). Another recent study reported the value of plaque eccentricity for symptomatic atherosclerotic lesions of intracranial arteries over the plaque enhancement (26). In this study, the diagnostic performance of GM and 90P was not significantly different from that of stenosis. Future study is needed to resolve these controversial observations.
Atherosclerotic changes in intracranial arteries could induce acute lacunar infarctions if they involved perforator artery ostia (5). Yoon et al. (8) suggested that small subcortical infarcts in MCA territory comprised two different entities according to its relative distance from MCA. Their study suggested that the characteristics of the atherosclerotic plaques in M1 of MCA were different between the two entities. It is possible that PAD and SAD were in a spectrum of the MCA diseases, which had a range of severity and extent of the active inflammatory atherosclerotic changes in M1 of MCA and in its branches. Future studies would be needed to prove the variable features of the MCA atherosclerosis.
This study had several limitations. First, due to the retrospective nature of the study, an uncontrolled bias could have been introduced. However, we systematically reviewed the clinical and imaging findings to include and exclude patients who strictly met our criteria. Therefore, more homogeneous populations representing PAD and SAD could be enrolled in this study. Second, the number of the included patients was relatively small, although previous studies also had similar patient numbers. Third, a pathologic correlation of the M1 segment enhancement was not established. Fourth, the MR sequences used for our study were not specifically designed for vessel wall imaging. Therefore, the set echo time was not adequate (relatively short, 12 ms), which may have introduced slow flow artifacts resulting in pseudo-enhancement (27). Also, the vessel walls were not very clear or well delineated from the surroundings. Additionally, our routine MR protocol did not include any non-enhanced 3D T1-weighted TSE images. It was thus difficult to identify the source of true vessel wall enhancement before contrast administration, whether an effect of slow flow or hyper-intense plaques. Further studies on the comparison of histogram analyses between the pre- and post-contrast images are required. Lastly, we did not measure the degree of enhancement of offending artery of SAD. The luminal diameter and wall thickness of lenticulostriate arteries were beyond the resolution of current MR images. Instead, we observed loss of enhancement at the M1 segment of SAD patients, which could be another source of an offending artery.
In conclusion, our qualitative and quantitative analyses revealed higher M1 segment enhancement in PAD than in SAD. Our study also showed that the intracranial wall enhancement was another important discriminator of PAD from SAD, as well as the presence of stenosis. The histogram analysis is an objective method for quantifying the intracranial artery enhancement.


 XML Download