

 PDF
PDF ePub
ePub Citation
 Print
Print


INTRODUCTION
Osteoarthritis is the most common joint disorder (1) and is an important health concern with rising prevalence, resulting in significant functional impairment, economic loss and excess mortality (2).
The traditional imaging tool for osteoarthritis is plain radiography, with joint space narrowing offering an indirect measure of cartilage loss and meniscal tears. However, MRI is now widely used for the evaluation of osteoarthritis because it allows the visualization of intraarticular pathologies that are not evident on plain radiography. Recently, more advanced cartilage MR imaging techniques have been introduced, allowing biochemical characterization and quantification necessary for evaluation of alternative biological treatments including osteochondral grafting, autologous cell implantation, and growth factor injection, as well as the detection of early osteoarthritis. Among biochemical MRI, T1rho (T1ρ) and T2 mapping are promising quantitative MRI techniques for non-invasive assessment of cartilage. Previous studies have shown that both T1ρ and T2 relaxation times are positively associated with the severity of knee osteoarthritis (3456). However, T1ρ and T2 have different relaxation mechanisms regarding biochemical composition. T1ρ relaxation time (TR) is sensitive to changes in proteoglycan content in the articular cartilage (7), while T2 relaxation is more associated with water content, collagen content, and orientation of collagen fibrils (89). Furthermore, there have been contradictory results on the magic angle effect on T2 and T1ρ values in knee cartilage. Some studies have reported strong orientation dependence of T2 TR (1011), while others have shown substantially less orientation effect on in vivo asymptomatic knee cartilage (12). Likewise, there have been inconsistent results for T1ρ, with some reports of elimination of laminar appearance at the magic angle orientation due to reduced dipolar interaction with spin-lock technique (13), while other reports have suggested the magic angle effect to be one of the causes of higher T1ρ values in the medial and lateral facets of the patella (14).
To the best of our knowledge, there have been a limited number of studies investigating subregional T1ρ and T2 relaxation values and their correlation (34), and comparing the angular dependence of T1ρ and T2 TRs under the influence of the magic angle effect.
Therefore, the purpose of this study was to analyze subregional differences in T1ρ and T2 values and their correlation in asymptomatic knee cartilage, and to evaluate angular dependence with magic angles.
MATERIALS AND METHODS
Subjects
This prospective study was approved by the institutional review board of our institution and informed consent was obtained from all individual participants in the study. In June 2014, we recruited six healthy adult volunteers (four males and two females; mean age, 32.3 years; range, 26–45 years) without a previous history of knee trauma, pain or surgery. All subjects underwent unilateral knee MRI including T1ρ and T2 mapping sequences.
MR Image Acquisition and Mapping
MRI was performed using 3.0-Tesla MR scanner (Magnetom Trio, A Tim, Siemens Medical Solutions, Erlangen, Germany). Sagittal proton density (PD)-weighted turbo spin echo images were acquired using the following parameters: TR/echo time (TE) = 4000/34 ms, signal averaging = 2, slice thickness = 3.0 mm, matrix = 320 × 192, field of view (FOV) = 160 × 160 mm, and flip angle (FA) = 147°. MRI was performed in supine position with a slight knee flexion without exercise or loading.
T1ρ-weighted images were acquired using a trueFISP-based 2D T1ρ pulse sequence with time of spin lock (TSL) = 0, 10, 20, 30, 40 ms, spin lock frequency = 500 Hz, TR/TE = 8/3.9 ms, bandwidth = 370 Hz, signal averaging = 5, slice thickness = 3.0 mm, matrix = 320 × 192, FOV = 160 × 160 mm, and FA = 10°. Acquisition time was 2:05 minutes.
For T2 mapping, sagittal multi-echo spin echo sequence with TR = 2000 ms, TE = 9.9, 19.8, 29.7, 39.6, 49.5, 59.4, 69.3, 79.2, 89.1 ms, bandwidth = 269 Hz, signal averaging = 1, slice thickness = 3.0 mm, matrix = 320 × 192, FOV = 160 × 160 mm, and FA = 180° was used. Acquisition time was 5:40 minutes.
For both T1ρ and T2 mapping, one mid-sagittal image of the medial femoral condyle (MFC) and one mid-sagittal image of the patella were acquired. For subjects whose mid-sagittal images of the MFC and patella overlapped, only one slice was obtained.
Images for T1ρ mapping were transferred in DICOM (Digital imaging and Communications in Medicine) format and T1ρ maps were calculated using MATLAB program (MathWorks, Natick, MA, USA) on a personal computer by nonlinear curve fitting each pixel's intensity to a mono-exponential decay model, using the following equation:
SI (TSL)=M (0)* , (SI [TSL]: T1ρ-weighted signal intensity at each TSL, M (0): equilibrium magnetization)
, (SI [TSL]: T1ρ-weighted signal intensity at each TSL, M (0): equilibrium magnetization)Subsequently, T1ρ maps were transferred to the picture archiving and communication systems (PACS) (G3, Infinitt Healthcare, Seoul, Korea) for quantification.
Inline calculation software (MapIt; Siemens Medical Solutions, Erlangen, Germany) was used to generate T2 maps, with mono-exponential nonlinear curve fitting using the following equation:
SI (TE)=M (0)* , (SI [TE]: signal intensity at each TE, M (0): equilibrium magnetization).
, (SI [TE]: signal intensity at each TE, M (0): equilibrium magnetization).T2 maps were automatically transferred from the MRI scanner to the PACS system.
Image Analysis
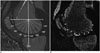
Two musculoskeletal radiologists (9 and 20 years of experience) independently measured T1ρ and T2 TRs on a PACS monitor. T1ρ and T2 TRs were measured at nine anatomical subregions in the mid-sagittal image of the MFC and two locations in the mid-sagittal patella. Nine anatomical subregions in the MFC were selected at angles of ± 0, 15, 35, 55, 75 degrees respective to a vertical line (B0) bisecting the width of the distal femur, which was perpendicular to a horizontal line crossing the posterior margin of the MFC cartilage (Fig. 1). Two locations in the patella were designated in the center of the upper and lower half of the mid-sagittal patellar cartilage. In order to place the regions of interest (ROIs) in the same locations on both T1ρ and T2 maps, ROIs with an area of about 2–3 mm2 were drawn manually on the PD-weighted images of same pixel size on the PACS monitor and copy-pasted onto the T2 and T1ρ maps, which were generated via pixel-by-pixel fitting. Mean values from two independent measurements were used for statistical analyses.
Statistical Analysis
Statistical analysis was performed using the SPSS 18.0 software package (SPSS Inc., Chicago, IL, USA).
Inter-reader agreement was assessed with intraclass correlation coefficients (ICC). Degree of agreement was categorized as follows: 0.00–0.20 (poor), 0.21–0.4 (fair), 0.41–0.60 (moderate), 0.61–0.80 (substantial), and 0.81–1.00 (almost perfect).
Kruskal-Wallis test and post-hoc Tukey's test using ranks were performed to evaluate statistically significant differences in T1ρ and T2 values in three divided MFC portions (anterior: -75°, -55°, -35°, central: -15°, 0°, 15°, 35°, and posterior: 55°, 75°). Segmentation was made analogous to nomenclature proposed for MRI-based measures of articular cartilage by Eckstein et al. (15). Central portion was defined as the cartilage that was in contact with meniscus, around -15° to 35°. Posterior portion was defined as areas posterior to the central portion as 55° and 75° in the present study. Areas anterior to central portion or medial trochlea of the femur were named as anterior.
Pearson's correlation analysis was performed to evaluate the correlation between T1ρ and T2 values in the MFC and patellar cartilage.
In order to evaluate angular dependence with the magic angles, Wilcoxon signed-rank test was performed between values of seven anatomical subregions in the MFC and values at ± 55°, which are approximate magic angles with respect to the main magnetic field. P values < 0.05 were considered significant.
RESULTS
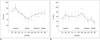
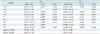
For the reason that interobserver agreement was almost perfect for both T1ρ and T2 maps with average means of the ICC as 0.922 (p = 0.000) for T1ρ and 0.939 (p = 0.000) for T2, mean values from two independent measurements were used for statistical analyses. Mean T1ρ and T2 relaxation values are summarized in Table 1 and Figure 2, respectively. Mean T1ρ relaxation values were lowest at +15° (41.71 ± 7.23 ms) and highest at -55° (82.90 ± 7.96 ms). Mean T2 relaxation values were lowest at +75° (44.09 ± 9.04 ms) and highest at +35° (75.83 ± 15.43 ms). Mean values were higher in superior patella than inferior patella for both T1ρ (63.08 ± 7.52 and 62.26 ± 7.19 ms, respectively) and T2 (50.71 ± 7.86 and 35.24 ± 5.20 ms, respectively). When the MFC was divided into three portions (anterior, central and posterior), mean T1ρ values were lowest in the central portion (50.42 ± 9.81 ms) and T2 values were lowest in the posterior portion (51.09 ± 13.38 ms). And T1ρ values were highest in the anterior portion (73.04 ± 10.51 ms) and T2 values were highest in the central portion (65.08 ± 14.94 ms). Kruskal-Wallis test showed statistically significant differences in the three divided portions of the MFC for T1ρ and T2 (p = 0.000 and p = 0.035, respectively). Post-hoc Tukey's test using ranks showed significant differences between each of the three divided portions for T1ρ (anterior-central, p = 0.000; anterior-posterior, p = 0.002; central-posterior, p = 0.028). However, significant difference in T2 values were found only between central and posterior portions (p = 0.024), not between anterior and central (p = 0.609) and between anterior and posterior (p = 0.226) portions.
Pearson's correlation analysis showed a weak correlation, which was not statistically significant (r = 0.217, p = 0.127), between T1ρ and T2 values of the MFC and patellar cartilage.
Wilcoxon signed-rank test showed minimal angular dependence with the magic angles in T2 mapping with statistically significant differences in T2 values between -55° and (-35°, +75°) (p < 0.05). T1ρ mapping showed more angular dependence than T2 mapping, with statistically significant differences between -55° and (-35°, -15°, 0°, +15°, +35°, +55°, 75°), and between +55° and (0°, +15°) (p < 0.05). Results from the Wilcoxon signed-rank test are summarized in Table 1.
DISCUSSION
In this study, T1ρ value was lowest in the central portion of the MFC, which corresponds to weight bearing (WB) portion. A prior study on glycosaminoglycan concentration in the cartilage showed that there was 1.78 times higher glycosaminoglycan content in WB articular cartilage compared with non-weight-bearing cartilage and suggested that local loading leads to modification of extracellular matrix and proteoglycan biosynthesis (16). Moreover, Nozaki et al. (17) demonstrated similar result with lower T1ρ values in the WB portion of the medial and lateral condyles. We theorized that since T1ρ value is sensitive to changes in proteoglycan content and is inversely related to it, cartilage of asymptomatic volunteers would show the lowest T1ρ value in WB region of the MFC, where glycosaminoglycan content would be highest (16).
T2 values showed significant differences between central and posterior portions, with the central WB region covered by meniscus showing the highest T2 values. This finding is in accordance with results from previous studies by Shiomi et al. (18) and Hannila et al. (19), stating higher cartilage T2 values in load-bearing areas. Even within the central WB region, we observed regional differences in T2 values, with higher T2 values at +35°, which is consistent with a prior study by Yoon et al. (20). These findings may indicate spatial variations in biochemical compositions and biomechanics within the articular cartilage. In the anterior portion, which corresponds to medial trochlea and anterior femoral condyle which is uncovered by meniscus, we observed slightly lower T2 values than in central portion, but higher T2 values than in posterior portion. This finding is slightly different from a report by Kaneko et al. (21), which states the highest T2 values in trochlea region. However, several studies have shown lower interobserver and intraobserver reliabilities of T2 quantification in trochlea region (1921). In agreement with the prior studies, we experienced difficulties in placing ROIs in anterior portion, because of thinner cartilage thickness and prominent partial volume effect in trochlea region, compared to femoral condyle. Therefore, T2 values in trochlea region may need further validation in larger subject cohorts and in combination with other imaging planes.
One explanation for the low correlation between T1ρ and T2 in our study may be the difference in sensitivity of T1ρ and T2 in stages of very early osteoarthritis. T1ρ is more sensitive to loss of proteoglycan (47), while T2 is more sensitive to collagen orientation/concentration and water content (89). Since the first step in the osteoarthritic process is loss of proteoglycans with minimal change in collagen content and orientation (22), there is less alteration in T2 values in early osteoarthritis. Because of the relatively wide range in age in our subjects, we believe that some of our asymptomatic volunteers with morphologically normal cartilage could have had very early biochemical changes of osteoarthritis. Li et al. (3) reported a large range of correlation between T1ρ and T2 (r = 0.2–0.7) in both controls and patients with knee osteoarthritis. However, higher correlation was observed in subcompartments with more advanced degeneration that is affected by both proteoglycan loss and changes in collagen (3). Theoretically, therefore, there may be low correlation between T1ρ and T2 values in very early osteoarthritis, because of a disproportionate increase in T1ρ. In advanced osteoarthritis, there may be a higher correlation due to a correlative increase in T1ρ and T2 values.
We initially hypothesized that if there were to be angular dependence with the magic angles, the values of the angles other than the magic angle in the MFC would be significantly different from those of the magic angles, which were approximately -55° and +55°. We observed more angular dependence of T1ρ with multiple angles showing significantly different values from those at -55° and +55°. As expected at magic angles, the T1ρ value -55° was one of the highest observed in the MFC, although the +55° value was not high. In a previous study on T1ρ profiles of the femoral cartilage, Nozaki et al. (17) observed a nonspecific peak in the medial condyle between +55° and +75°, but did not observe a definite peak at ± 55°. In agreement with study by Nozaki et al. (17), we believe that there may be multiple confounding factors accounting for the higher values of the femoral cartilage at approximately ± 55°, including magic angle effects and site-specific differences in proteoglycan content at each angle.
In the present study, we observed minimal angular dependence in T2 mapping. With respect to earlier findings, we observed higher T2 values at -55° (12, 2123). However, statistically significant difference was observed only between -55° and +75° and we did not observe a well-defined peak at +55°. Reduced orientation dependence of radial zone in cartilage T2 (11, 2123) by obtaining full thickness cartilage values without stratifying cartilage zones could be one of the explanations for this observation. Secondly, as Mosher et al. (12) demonstrated, degree of magic angle effect may be attenuated in in vivo femoral cartilage. Therefore, other factors such as differences in degree of cartilage compression (12) or regional variations in biochemical compositions of cartilage could have more substantial effects on cartilage T2.
Our study has several limitations. First, we were able to recruit only six healthy volunteers during the study, whose ages ranged from 26 to 45 years. We also measured limited subregions of the MFC. More extensive study of the entire femoral condyle in a large number of asymptomatic populations may be needed. Second, we investigated full thickness cartilage values and did not consider zonal variation. Different biochemical compositions and orientation of collagen fibrils in different layers may yield different results. It was difficult to macroscopically differentiate each layer and manually obtain values due to the limited spatial resolution and thinner cartilage thickness. However, it is hypothesized that values of full thickness cartilage obtained using the ROI measurement method may be more practical and accessible in clinical use.
In conclusion, T1ρ and T2 values showed subregional variations in asymptomatic MFC and patellar cartilage. T1ρ showed significant differences between each of the three divided portions of the MFC, while T2 showed significant differences only between central and posterior portions. Among the three portions, T1ρ was lowest in the central and highest in the anterior portion of the MFC and T2 was lowest in the posterior and highest in the central portion. There was a weak correlation between T1ρ and T2. Moreover, T1ρ showed more angular dependence than T2 with multiple angles showing significant differences from the values at ± 55°. It is proposed that awareness of these differences between T1ρ and T2 in asymptomatic knee will aid in assessment of cartilage in a specific subregion of the knee.
 XML Download