

 PDF
PDF ePub
ePub Citation
 Print
Print


INTRODUCTION
Intervertebral disc degeneration (IDD) is the leading cause of low back pain worldwide (1). It is a complex multi-systemic disease with unclear etiology (2). The early changes in IDD are primarily associated with the loss of proteoglycan in the nucleus pulposus; the reduction in their water-binding capacity can cause alterations in the water content, leading to the loss of hydration and osmotic pressure (3). Currently, early detection of IDD has been an important issue for appropriate medical or surgical management of the disease in order to prevent further progression (45). Therefore, a reliable quantitative parameter for the detection of early biochemical changes in IDD has been necessitated.
Magnetic resonance imaging (MRI) has been the most important noninvasive diagnostic tool for the assessment of IDD. Although T2-weighted MRI has been considered a well-established method for the semi-quantitative evaluation of disc degeneration according to the morphological grading system (6), conventional MRI technique has limited abilities in the quantification of early changes in IDD. Therefore, researchers have been focusing on the development of quantitative MRI techniques that can analyze the biochemical composition of intervertebral discs (7).
More recently, several noninvasive quantitative MRI techniques such as T1ρ and T2 mapping sequences have emerged, which meet the expectations for detection of early biochemical changes in IDD; however, the targets of focus of these two techniques are different from each other. While quantitative T1ρ mapping (8) is sensitive to the proteoglycan content, quantitative T2 mapping (9) is sensitive to the water content and collagen fiber network of the intervertebral discs. However, the acquisition of accurate and clinically valuable quantitative data using T1ρ and T2 mapping sequences has been considered to be challenging. Therefore, the reproducibility of these two quantitative mapping techniques requires evaluation before application (10). To the best of our knowledge, there have been no studies on the evaluation of both interobserver and test-retest reproducibility of T1ρ and T2 measurements in lumbar IDD by 3T MRI. Therefore, the purpose of our study was to investigate the interobserver and test-retest reproducibility of T1ρ and T2 measurements of lumbar intervertebral discs measured from the corresponding mapping sequences using 3T MR Imaging.
MATERIALS AND METHODS
Study Participants
This prospective study was approved by our institutional review board prior to patient recruitment, and written informed consent was obtained from each patient before enrollment in the study. A total of 51 patients (female, 26; male, 25; mean age, 54 ± 16.3 years; age range, 27–76 years) were enrolled in this study between December 2013 and February 2015. The inclusion criteria were: 1) complaints of low back pain for more than 2 months and 2) agreement to participate in the study. The exclusion criteria were: 1) previous surgical history that might affect image quality, 2) claustrophobia, and 3) scoliosis of lumbar spine, which might cause geometrical variability during image acquisition. Intervertebral lumbar discs from L1–2 through L5–S1 levels were assessed in all the patients. A total of 51 patients underwent MR imaging with the T1ρ and T2 mapping sequences in the first scanning session, as detailed below. Of the 51 subjects, 40 patients who also agreed to undergo repeat imaging with the T1ρ and T2 mapping sequences for the evaluation of the test-retest reproducibility, underwent the repeat scanning session immediately after the first scanning session.
Magnetic Resonance Imaging Acquisition
All MR images were acquired using a 3.0 T MRI scanner (Discovery MR750, General Electric Healthcare, Milwaukee, WI, USA) with a spine matrix coil. Images of the lumbar spine including levels L1–2 through L5–S1 were acquired in the supine position between 10 A.M. and 2 P.M., considering diurnal variation (11). The study MRI protocol included the procedures followed in both the first and second scanning sessions.
The MR protocol for the first scanning session included three different MR sequences: two-dimensional (2D) fast spin-echo (FSE) T2-weighted images were acquired in the sagittal plane; three-dimensional (3D) FSE pulse sequence with parallel imaging and long echo train, low flip angle, and low specific absorption rate acquisition (3D-CUBE) T1-weighted images were acquired in the sagittal plane for T1ρ mapping; and, finally, 2D-multisection FSE images were acquired in the sagittal plane for T2 mapping. The second scanning session involved image acquisition using just the two mapping sequences mentioned above, with the same parameters.
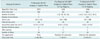
The details of imaging parameters are as follows; 2D FSE protocol (Field of view [FOV] = 38 cm, repetition time [TR]/echo time [TE] = 3973 ms/102 ms, acquisition matrix = 320 × 512, slice thickness; 3 mm, slice spacing; 4 mm, number of excitations [NEX] = 1, scan time = 1 minute 59 seconds). T1ρ protocol (Fat-saturated 3D CUBE, spin-lock pulse amplitude = 440 Hz [w1 = rB1/2], spin-lock pulse length [TSL] = 1, 10, 30, 60 ms, FOV = 28 cm, TR/TE = 1263 ms/60 ms, acquisition matrix = 192 × 288, bandwidth = 0.7 kHz/pixel, slice thickness = 4 mm, NEX = 1, scan time = 7 minutes 6 seconds) and T2 map protocol (2D FSE protocol, FOV = 28 cm, TR = 1836 ms and TEs = 6.0, 12.4, 25.3, 38.1 ms, acquisition matrix = 192 × 288, slice thickness; 4 mm, slice spacing; 2 mm, NEX = 0.5, scan time = 5 minutes 34 seconds). The total scan time for first scanning session was 14 minutes 39 seconds and for second scanning session was 12 minutes 40 seconds. The imaging parameters are summarized in Table 1.
Post-Processing of Magnetic Resonance Images
The MR images were transferred to the Advantage Workstation (Version 4.5; General Electric Healthcare, Milwaukee, WI, USA) for the calculation of the T1ρ and T2 relaxation times of the intervertebral discs using the Functool software (Version 9.3.02e). Digital Imaging and Communications in Medicine images of each series were calculated pixel by pixel. The case-by-case threshold parameter was applied for each scan to remove trailing echoes that are of sufficiently low amplitude to be classified as noise. Subsequently, T1ρ maps were reconstructed by fitting the image intensity, pixel-by-pixel, to the equation below, using a mono-exponential non-negative least square fitting algorithm; S (TSL) = S0* exp (-TSL/T1ρ), where TSL is Time of spin-lock, and S is the signal intensity of T1ρ-weighted image with a given TSL. In the same manner, the mono-exponential fitting algorithm used in Functool iteratively estimated the relaxation parameter with a confidence level of 0.01. The following equation was used for the reconstruction of T2 maps: S (TE) = S0* exp (-TE/T2).
Image Analysis and Region of Interest Measurement
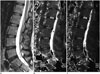
After the acquisition of mapping sequences, all image evaluations were performed by two radiologists, respectively. On the basis of the sagittal T2-weighted MR imaging findings, rectangular regions of interests were placed at the nuclei pulposi of lumbar discs from L1–2 through L5–S1 levels in the T1ρ mapping images of the discs excluding the annulus fibrosus (Fig. 1). Once region of interest (ROI) placement in the T1ρ mapping images was done for a nucleus pulposus of intervertebral disc, simultaneous ROI placement at the corresponding disc portion in the T2 mapping images was automatically obtained, except in the cases with geometry mismatch; in such cases (7 out of 51 patients), the ROIs were manually placed at the most identical location as possible and simultaneously compared with the corresponding images. After randomization of the subjects, two radiologists placed the entire ROI measurements independently, blinded to clinical information as well as the result of Pfirrmann grading session. Rectangular ROIs were used for computing the average T1ρ and T2 relaxation times. The mean area of the ROIs was 23.3 ± 4.4 (range, 14.4–34.3) mm2. Thus, two ROI measurements for each of the mapping sequences were obtained for every pixel location at each level of lumbar discs from L1–2 through L5–S1. Discs classified as grade 5 based on the Pfirrmann grading system, as described below, were excluded because of the difficulty in accurate ROI placement within their nuclei pulposi owing to severely decreased disc height (12). In order to obviate bias due to recall memory, the observers analyzed the retest mapping images 2 weeks after the analysis of the first set of images (13).
Lumbar intervertebral discs from L1–2 through L5–S1 levels were graded according to the Pfirrmann grading system (6) by a single observer, who did not participate in the T1ρ and T2 measurements. The discs were graded on the basis of the sagittal T2-weighted MR images, which provide MR-based semi-quantitative evaluations of the discs. The discs were assigned into one of the two groups based on the grading — non-degenerated (Pfirrmann grades 1, 2) or degenerated (Pfirrmann grades 3, 4) disc groups, in order to evaluate the significance of the differences between the normal/early and later stages of disc degeneration in terms of the T1ρ and T2 measurements (1415).
Statistical Analysis
All statistical analyses were performed using statistical software (SAS Institute, version 9.2, Cary, NC, USA and MedCalc Software, version 12.7.0, Ostend, Belgium). A total of 255 ROI measurements of 51 patients from the first scanning session and 200 ROI measurements of 40 patients from the second scanning session were assessed.
To investigate the interobserver reproducibility between observer A and B in T1ρ and T2 measurements from each mapping sequence, we used the intraclass correlation coefficient (ICC) with a two-way random model of absolute agreement. This evaluation included 371 measurements, including the entire data from the first (255 measurements from 51 patients) and second (200 measurements from 40 patients) scanning sessions and excluded the data concerning grade 5 discs (n = 84).
To determine the test-retest reproducibility of T1ρ and T2 measurements from each mapping sequence for both observer A and B, we used ICC using 163 measurements from 40 patients who underwent both the first and second scan sessions, excluding grade 5 discs (n = 37). Values of ICC < 0.40 were considered as indicating poor reproducibility, those within the range of 0.40–0.75 as indicating fair to good reproducibility, and those > 0.75 as indicating excellent reproducibility (16). Comparison of the ICC values were done using Z test after acquisition of ICC values of T1ρ and T2 measurements based on Fischer's method (17).
The mean T1ρ and T2 measurements of the lumbar intervertebral discs were compared between the degenerative and non-degenerative discs according to Pfirrmann grading system. Student t test was used to assess whether there was a significant difference in the mean measurements between degenerative and non-degenerative discs from each mapping sequences. Values of p < 0.05 were considered as indicating statistical significance. The entire continuous data were expressed as the mean ± standard deviation (SD), along with the range of the values.
RESULTS
Evaluation of the ICC values for interobserver reproducibility of both measurements from the first and second scanning sessions indicated excellent reproducibility in the T1ρ measurements (ICC = 0.951) and fair to good reproducibility in the T2 measurements (ICC = 0.672; Table 2). The overall ICC values for test-retest reproducibility of the T1ρ measurements indicated excellent reproducibility in the measurements of both observers A (ICC = 0.922) and B (ICC = 0.914), while those of the T2 measurements indicated fair to good reproducibility in the measurements of both observers A (ICC = 0.672) and B (ICC = 0.628). ICCs of interobserver and test-retest reproducibility for T1ρ mapping were significantly higher than T2 mapping (p < 0.001).
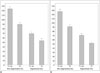
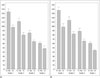
Overall, a total of 255 discs of 51 patients from the first scanning session and 200 discs of 40 patients from the second scanning session were assessed (grade 1 = 87, grade 2 = 81, grade 3 = 77, grade 4 = 126, and grade 5 = 84). Since the T1ρ and T2 values for each disc were inherently different, we considered the number of discs for correlation analysis of the T1ρ and T2 measurements according to the Pfirrmann's grade as 455 (255 and 200 measurements from the first and second scanning sessions, respectively). Among the 455 intervertebral discs from the images, after excluding grade 5 discs (n = 84), the discs were categorized into degenerative disc group (grades 3, 4, n = 168) and non-degenerative disc group (grades 1, 2, n = 203). There were significant differences between the mean values of the T1ρ and T2 measurements, with the mean values of the degenerative intervertebral disc group (mean T1ρ; 94.6 ± 40.1 ms, mean T2; 70.0 ± 33.1 ms) being significantly lower as compared to those of the non-degenerative disc group (mean T1ρ; 105.2 ± 41.6 ms, mean T2; 77.4 ± 35.0 ms) (p < 0.001) (Fig. 2). In addition, we could observe inverse correlation between the T1ρ and T2 values of the discs and Pfirrmann grades of the corresponding discs (Fig. 3, Table 3).
DISCUSSION
The main goal of this study was to evaluate the reproducibility of MRI-based quantitative measurements of the lumbar intervertebral discs using T1ρ and T2 mapping sequences with 3T MRI. Our results showed excellent reproducibility of T1ρ measurement in the assessment of the IDD using 3T MRI, which was significantly higher than the reproducibility of T2 measurement in terms of both interobserver and test-retest reproducibility. Several studies have explored the reproducibility of T1ρ and T2 measurements obtained from the images acquired using the corresponding mapping sequences in the assessment of IDD (181920). One such study reported excellent reproducibility of T1ρ and T2 measurements in the intervertebral discs, with higher ICC values as compared to those obtained in our study (20). However, the results of the previous study were based on ROI measurements in the axial plane using a 1.5 T scanner; additionally, there was no indication whether diurnal variation was considered in their evaluation. Another report recently revealed excellent ICC value for T1ρ and T2* measurements in nuclei pulposi of the intervertebral discs by 3T MRI; however, the results of this study were based on single-observer measurement (19). In addition, the prior reproducibility studies in articular cartilage of knee (2122) revealed excellent short-term reproducibility for T1ρ and T2 quantification on 3T MRI employing health volunteers. However, to the best of our knowledge, our study is the first to assess both interobserver and test-retest reproducibility of T1ρ and T2 measurements obtained from images acquired using each of the mapping sequences with 3T MRI in patients with IDD.
In this study, the T1ρ measurements exhibited superior reproducibility than the T2 measurements, which was consistent with previously reported results in the meniscus (23), hip cartilage (24), and knee cartilage (21,22) using 3T MRI. Several previous reports have noted that, the wider dynamic range of T1ρ than T2 could be a possible explanation for higher reproducibility of T1ρ measurements as compared to that of T2 (2223).
Meanwhile, the reproducibility of the T2 measurements was found to be fair to good in terms of both interobserver and test-retest reproducibility. Previous studies on intervertebral discs reported high levels of reproducibility for T2 measurements comparable to that of T1ρ measurements (20). In contrast, relatively low ICC values of T2 measurements were observed in our study, which may be due to several reasons as follows: to achieve higher reproducibility, patient immobilization is important along with proper image acquisition (24); since the T2 mapping images were acquired after the acquisition of the T1ρ mapping images in the present study, it is hypothesized that higher chances of motion artifacts might have influenced the reproducibility of the T2 values; in this context, since image acquisition was performed using a 3T MRI scanner, the increased noise, greater SD of T2 values, and/or possible greater magnetization transfer effects that might have been produced, could have made the motion-related loss of reproducibility (2425,26); and another plausible explanation is that the TE for T2 mapping might not have been long enough for acquisition of long-TE images, which would have resulted in the underestimation of the T2 values, thus potentially affecting reproducibility.
Since this study focused on the evaluation of reproducibility of T1ρ and T2 measurements, we excluded the annulus fibrosus from the ROI measurement for the acquisition of reliable quantitative data due to the reason that in the degenerated disc groups (Pfirrmann grades 3, 4) it can be hard to distinguish the nucleus pulposus from the annulus fibrosus, which might affect precise ROI placement. For the same reason, we did not include Pfirrmann grade 5 intervertebral discs for evaluation in the present study. Considering the technical challenges involved in ROI placement in the nuclei pulposi of severely degenerated discs, the quantitative measurements in the present study are less likely to have been affected by noise.
In addition, we have demonstrated that both T1ρ and T2 measurements in patients with IDD differed significantly between the degenerated and non-degenerated disc groups, which are in accordance with the results of previous studies (27). The T1ρ and T2 measurements obtained in our study were consistent with previously reported values (1127) in the intervertebral discs. We have also shown that measurements obtained from both T1ρ and T2 mapping sequences were significantly and inversely correlated with the Pfirrmann grades of intervertebral discs (7). There are several limitations to this study. First, there were variations in the sizes of the individual ROIs. However, considering the variations in disc height, the placement of ROIs of variable sizes at the nuclei pulposi of intervertebral discs appears to be a more precise way of evaluation. Second, we did not correlate our study results of T1ρ and T2 measurements with glycosaminoglycan or collagen water content of the intervertebral disc, since we focused only on the reproducibility of T1ρ and T2 measurements. Further research supported by histological and biochemical findings will be helpful for the validation of the T1ρ and T2 measurements of intervertebral discs in patients with IDD.
In conclusion, T1ρ mapping was significantly higher than T2 mapping in terms of interobserver and test-retest reproducibility in the quantitative assessment of the nuclei pulposi of lumbar intervertebral discs. Therefore, we consider T1ρ mapping as a more reliable tool than T2 mapping for the detection of early changes as well as for monitoring degenerative changes in the nucleus pulposus in IDD by 3T MRI.


 XML Download