

 PDF
PDF ePub
ePub Citation
 Print
Print


INTRODUCTION
Coronary microembolization secondary to atherosclerotic plaque rupture occurs clinically in ischemic heart disease, spontaneously in patients with unstable angina or acute coronary syndromes (123), as well as artificially during coronary interventions (456). The pathophysiological significance and typical consequences include perfusion-contraction mismatch, notable arrhythmias, myocardial ischemia, microinfarction, and contractile dysfunction (789). Several noninvasive methods are developed to aid in the detection of microvascular obstruction, including positron emission tomography, contrast material-enhanced echocardiography and contrast-enhanced magnetic resonance (MR) imaging (1011121314). MR imaging (MRI) permits an integrated examination of cardiac morphology and function, myocardial perfusion, myocardial viability and coronary artery anatomy (1516171819). Several reports indicate the usefulness of first-pass perfusion and delayed contrast enhancement, as well as serial MR imaging, for the assessment of effects of microembolization created with intracoronary injection of relatively large embolic agents that lead to visually detectable myocardial microinfarcts on gross specimen (20212223). However, the effects of microembolization may be related to the size of embolized microvessels (20212223242526). Furthermore, small-sized microemboli, which may escape the protective devices placed distal to atherosclerotic lesions during percutaneous coronary interventions, may cause myocardial infarcts invisible on gross specimen. We aimed to evaluate the acute and subacute effects of coronary microembolization in a swine model induced by small-sized microemboli using cardiac MR imaging. In addition, evaluation of coronary angiography after microembolization in animal studies is rarely reported (202122232526); hence, we aimed to assess the immediate effect of microembolization on coronary arteries with coronary angiography pre- and post-microembolization.
MATERIALS AND METHODS
Experimental Preparation and Protocols
All experimental protocols were approved by the institutional committee on animal research, and the study was performed in accordance with the Guide for the Care and Use of Laboratory Animals (NIH Publication No. 85-23, Revised 1996). Twelve pigs (23.2 ± 1.5 kg) were premedicated with a combination of ketamine (5-10 orgmg/kg) and diazepam (5-10 mg/kg). Anesthesia was induced and maintained by 3% pentobarbital sodium intravenously. Anticoagulation was induced with an intravenous bolus injection of 5000 IU heparin sodium, and additional doses of 100 IU/kg heparin sodium per hour were given to maintain heparinization. After establishing femoral artery access, coronary angiography of the left coronary artery was performed with a 6-Fr XB 3.5 guiding catheter. A 2.8-Fr infusion catheter (Cordis Inc., Johnson & Johnson, New Brunswick, NJ, USA) was deployed in the left anterior descending coronary artery (LAD) distal to the second diagonal branch. One pig died during coronary catheterization because of ventricular fibrillation. Microembolization was created with slow injection of 120000 microspheres (42 µm Dynospheres; Dyno Particles; Lillestrøm, Norway) through the coronary catheter. After the delivery of the embolic agent, coronary angiography was performed repeatedly in order to assess the immediate effect of microembolization on coronary arteries. Cine-angiograms were evaluated off line by consensus of 2 cardiologists with no microembolization status provided on the images.
MR Imaging
MR examinations were performed on a 1.5T MR imaging unit (Magnetom Avanto; Siemens Medical Solutions, Erlangen, Germany) equipped with high-performance gradients (maximum strength, 45 mT/m; slew rate, 200 T/m/s) and a phased-array total imaging matrix coil. Six (anterior/posterior) coil elements positioned close to the heart were activated for signal reception. Cardiac MRI protocol and parameters in the current study were based on previous study on microembolization in the swine model and coronary microcirculatory impairment in patients (20212627) as well as our previous experience in cardiac MR imaging. MRI was carried out before (baseline), 6 hours (acute), and 1 week (subacute) after the selective injection of the microspheres. Scout images were obtained to determine the exact position and standard orientations-long-axis, four-chamber, and short-axis views of the left ventricle.
Cine MR images encompassing the whole left ventricle (LV) in the short-axis view for quantification of regional function, were obtained by using a steady-state free precession sequence applied along with parallel imaging technique i.e., repetition time (TR)/echo time (TE), 2.6/1.3 ms; flip angle, 80°; slice thickness, 8 mm; field of view, 34 × 26 cm; matrix size, 192 × 154, 20 cardiac phases.
First-pass perfusion MRI was performed to detect the hypoperfused region using an intravenous injection of 0.05 mmol/kg gadolinium-based contrast material (Gd-DTPA, [Magnevist], Bayer Healthcare, Berlin, Germany) in 4 short-axis slices spaced to encompass the microembolized territory. The images were registered using anatomical landmarks such as the anterior right ventricular and papillary muscle insertion points, as well as the distance measurements from the apex. The contrast material was delivered by a power injector at 3 mL/s followed by 10-15 mL saline. First-pass perfusion MR images were acquired using a saturation-recovery gradient-echo sequence, and imaging parameters were as follows: TR/TE, 2.4/1.1 ms; flip angle, 12°; slice thickness, 10 mm; field of view, 34 × 26 cm; matrix size, 192 × 126; acquisition time, 2 R-R intervals per dynamic acquisition.
Delayed contrast enhancement magnetic resonance imaging (DE-MRI) was performed 10 minutes after intravenous injection of an additional 0.15 mmol/kg Gd-DTPA in short-axis views covering the entire LV with a segmented T1-weighted inversion-recovery spoiled gradient-echo sequence. The imaging parameters were as follows: TR/TE, 7.6/3.4 ms; flip angle, 25°; slice thickness, 5 mm; field of view, 34 × 26 cm; matrix size, 256 × 192. The optimal inversion time (TI) to null the signal of normal myocardium was determined by using an inversion-recovery steady-state free precession sequence. Phase-sensitive reconstruction method may reduce the variation in apparent infarct size that is observed in the magnitude images as TI is changed (28); hence, DE-MRI pulse sequence uses both magnitude and phase-sensitive reconstruction to generate 2 images per slice representing the magnitude and phase-sensitive component, respectively.
MR Image Analysis
MR images were reviewed and analyzed in a blinded and random fashion using Argus software on an independent workstation (Leonardo; Siemens Medical Solutions) and Segment, version 1.8, software (29). The visual assessments (presence vs. absence) of myocardial contractile dysfunction, perfusion defect and delayed-enhancement were performed independently by 2 radiologists. The disagreement was settled by a consensus reading.
Systolic wall thickening was analysed using 3 short-axis slices of cine MRI distal to LAD microembolization (8 mm slice thickness, starting at 16 mm from the apex) from each animal at baseline, 6 hours and 1 week after microembolization. Each LV slice was divided into 8 circumferential segments 45° apart with segment 1 beginning at the posterior insertion of the right ventricle and the numbering of the remaining 7 segments proceeding in a clockwise fashion (21). The observers were requested to exclude the papillary muscles during semi-automatic tracing of the endocardium contour for systolic wall thickening analysis. Semiautomatic regional systolic wall thickening was quantified in 8 segments of each slice by using the software. The averages of microembolized (segments 2-5) and remote (segments 1, 6-8) myocardium systolic wall thickening values, derived from 3 short-axis sections were used for statistical analysis. Cine images were also used to calculate the ejection fraction (EF) by delineation of the endocardium on all short-axis images at end diastole and end systole.
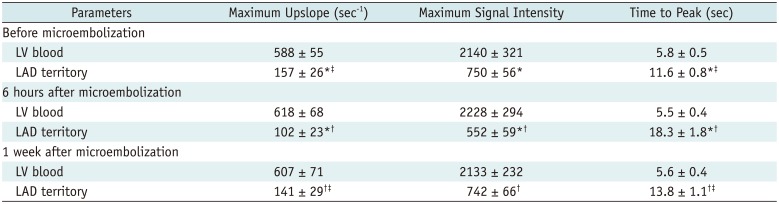
The first-pass MR perfusion images obtained at the baseline, 6 hours, and 1 week after microembolization were pooled and randomized, with no time-point information provided on the images. These were subsequently presented to the 2 radiologists for visual analysis. Semi-quantitative parameters of perfusion, namely max upslope, peak signal intensity (SI) and time to peak were determined in the LV blood pool and LAD territory using first-pass perfusion images at the baseline, 6 hours, and 1 week after microembolization. DE-MR images obtained at 6 hours and 1 week after microembolization were evaluated visually by 2 radiologists independently in a blinded and random fashion and the disagreement was settled by consensus of the 2 readers.
Measurement of Cardiac Troponin T (cTnT)
Blood samples were taken at baseline, 6 hours, and 1 week after microembolization. The serum level of cardiac troponin T (cTnT) was quantitatively measured by electrochemiluminescence.
Histopathology
After completion of the MRI examinations, the animals were euthanized with 40 mL of saturated potassium chloride solution. The hearts were excised rapidly, cut into 10-mm-thick slices parallel to the plane of the atrioventricular groove, and soaked for up to 20 minutes in 1.0% nitrobluetetrazolium chloride (NBT) to detect microinfarcts. Representative tissue samples were obtained from the microembolized and remote regions for histopathologic analysis. The samples were dehydrated and embedded in paraffin in accordance with the standard procedure, sliced into 5-µm slices, and stained with hematoxylin-eosin (HE) for microscopic analysis.
Statistical Analysis
All continuous variables were presented as means ± standard deviation. Eleven animals were used for statistical analysis. The interobserver agreement of the visual evaluation (presence vs. absence) of perfusion defect, myocardial contractile dysfunction and delayed-enhancement between 2 radiologists was performed using Cohen's kappa coefficient, and kappa values were interpreted using a commonly cited scale (30). Values of 0.81-0.99 indicated almost perfect agreement; 0.61-0.80, substantial agreement; 0.41-0.60, moderate agreement; 0.21-0.40, fair agreement; and 0.01-0.20, slight agreement. Comparisons of systolic wall thickening, the semi-quantitative perfusion parameters (max upslope, time to peak and peak enhancement) and the serum level of cTnT between time points were performed with repeated measures analysis of variance followed by the post-hoc test using the least significant difference (LSD) method. A p value < 0.05 was considered significant.
RESULTS
Coronary Angiography
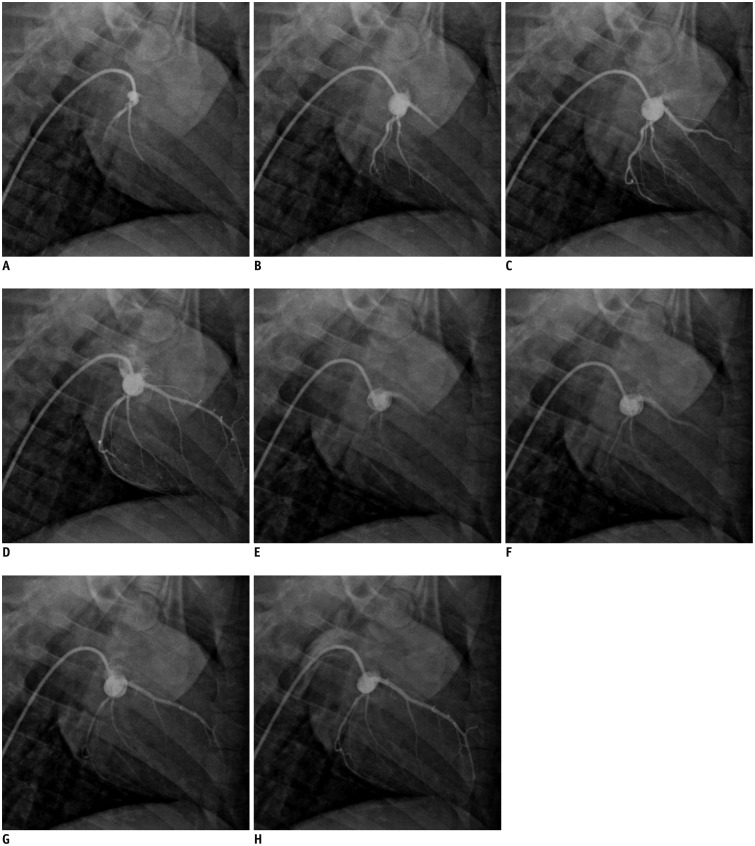
Coronary angiography pre- and post-microembolization showed normal-appearing epicardial arteries. Coronary flow of the Thrombolysis In Myocardial Infarction grade 3 remained in all animals after the administration of microspheres (Fig. 1). All the side branches were well visualized and no occlusion was observed after microembolization.
Myocardial and Global LV Function
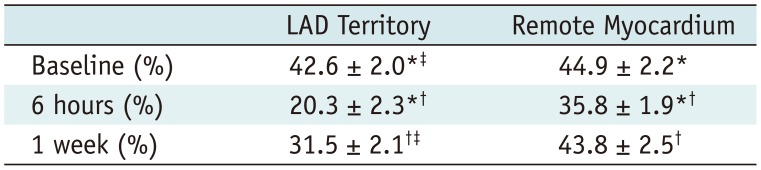
Six hours after delivery of the embolic agent, a significant decline in the systolic wall thickening was observed in the embolized territory and quantitative analysis further demonstrated the myocardial dysfunction (baseline, 42.6 ± 2.0% vs. 6 hours, 20.3 ± 2.3%; p < 0.001). At 1 week, myocardial contraction improved partially (1 week, 31.5 ± 2.1% vs. 6 hours, 20.3 ± 2.3%; p < 0.001) but did not recover to basal values in the embolized region (baseline, 42.6 ± 2.0% vs. 1 week, 31.5 ± 2.1%; p < 0.001). The systolic wall thickening of remote myocardium decreased significantly at 6 hours after delivery of the embolic agent (baseline, 44.9 ± 2.2% vs. 6 hours, 35.8 ± 1.9%; p < 0.001), but recovered completely at 1 week (1 week, 43.8 ± 2.5% vs. 6 hours, 35.8 ± 1.9%; p < 0.001 and baseline, 44.9 ± 2.2%; p = 0.132). Details were summarized in Table 1. The LVEF declined from 52 ± 4% at baseline to 35 ± 4% at 6 hours (p < 0.001) and recovered partially to 44 ± 3% at 1 week (p < 0.001 for both the comparison to baseline and 6 hours) after microembolization. Interobserver agreement was excellent (κ = 0.812) for the visual analysis of cine MR images.
Myocardial Perfusion and DE-MR imaging
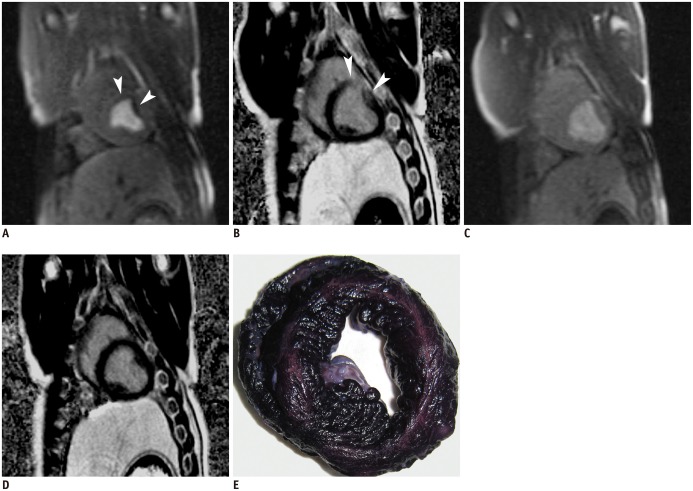
First-pass perfusion imaging showed perfusion defect within the embolized territory at 6 hours, but the extent of perfusion defect was largely decreased at 1 week. At 6 hours, the maximum SI in the LAD coronary artery territory was lower (552 ± 59) in comparison with the baseline (750 ± 56; p < 0.001), the maximum upslope was lower (6 hours, 102 ± 23 s-1 vs. baseline, 157 ± 26 s-1; p < 0.001) and the time to peak was longer (6 hours, 18.3 ± 1.8 seconds vs. baseline, 11.6 ± 0.8 seconds; p < 0.001). At 1 week after microembolization, all the MR perfusion parameters improved, as compared with those at 6 hours (p < 0.05 for all the comparisons). MR estimates of perfusion in the LAD territory differed between the baseline and 1 week after microembolization for maximum upslope (1 week, 141 ± 29 s-1 vs. baseline, 157 ± 26 s-1; p = 0.004) and time to peak (1 week, 13.8 ± 1.1 seconds vs. baseline, 11.6 ± 0.8 seconds; p = 0.001) but not for the maximum SI (1 week, 742 ± 66 vs. baseline, 750 ± 56; p = 0.728). Maximum SI, time to peak, and peak slope were not significantly different between 3 time-points (the baseline, 6 hours, and 1 week after microembolization) in the blood pool (p > 0.05 for all). Patchy hyperenhanced regions were visualized on DE-MRI in all animals at 6 hours after microembolization. Hyperenhancement from microembolization at early acute phase was distributed within the transmural extent of the targeted myocardium, rather than confined to the subendocardium region. However, hyperenhanced regions could hardly be observed visually on DE-MRI at 1 week. Semi-quantitative perfusion parameters were listed in Table 2 and the examples of the MR perfusion and DE images were shown in Figure 2A-D. Interobserver agreement was excellent (κ = 0.864) for the evaluation of DE-MRI and substantial (κ = 0.756) for the assessment of MR perfusion images.
The Serum Level of cTnT
The serum level of cTnT was obtained in 8 of 11 pigs and significantly increased at 6 hours after coronary microembolization (baseline, < 0.01 ng/mL vs. 6 hours, 0.481 ± 0.194 ng/mL; p < 0.001). It was still higher at 1 week (0.181 ± 0.161 ng/mL), as compared to baseline (p = 0.02). The serum level of cTnT was set as 0.01 ng/mL at baseline, for statistical analyses.
Histopathologic Results
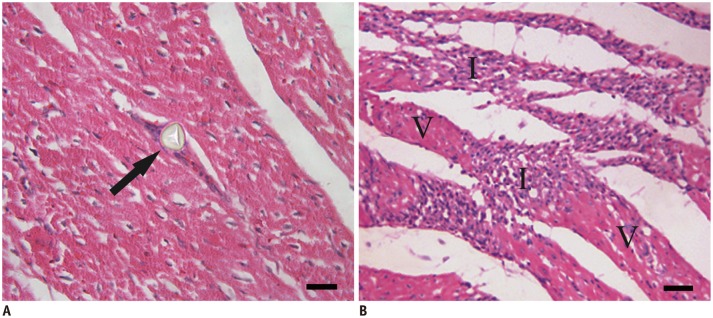
At 1 week after microembolization, the microinfarcts were invisible to the naked eye on gross NBT specimen in all animals. However, microscopic examination demonstrated the embolic agent in coronary arterioles and the patchy microinfarcts in the embolized areas. The remote myocardium appeared histologically normal. Examples of NBT and HE staining images were shown in Figures 2E and 3.
DISCUSSION
The major findings of the current study can be summarized as follows: a certain load of small-sized microemboli, which may escape the distal protective devices during percutaneous coronary interventions, may cause normal-appearing epicardial coronary arteries on coronary angiography and result in myocardial infarcts invisible to the naked eye; even small-sized microemboli can cause a persistent decline in the systolic wall thickening of the embolized region; first-pass myocardial perfusion MRI can demonstrate acute myocardial ischemia after microembolization; small-sized microemboli may cause regional hyperenhancement of the target area on DE-MRI at 6 hours, but not 1 week; regional assessment of myocardial contractility and perfusion by cine and first-pass perfusion MRI may be better than DE-MRI in the evaluation of the ischemic cascade due to coronary microembolization.
In the current study, DE-MRI revealed hyperenhancement within the target areas at 6 hours after coronary microembolization, but the hyperenhancement disappeared at 1 week. There was no evidence of myocardial infarction on gross NBT specimen at 1 week after microembolization; however, the results of cTnT supported the diagnosis of myocardial infarction in the current study. Several previous MRI studies (20212223) on coronary microembolization using relatively large microemboli, such as 100-300 µm and a mean of 80 µm diameter of 40-120 µm microemboli, have reported hyperenhancement areas on DE-MRI at 1 week and 7-8 weeks and the myocardial microinfarcts could be detected visually on gross specimen using TTC. However, it is likely that different definitions of microinfarcts were used. Pathologists have used the term microinfarcts for microscopically detectable myocardial necrosis but not for infarcts visually detectable on gross specimen, and the term heterogeneous infarcts for areas of non-uniform early myocardial necrosis and scar (3). Previous MRI studies (2021222325) with relatively large microemboli have used the term microinfarcts for heterogeneous and multifocal small areas of infarcts within the territory undergoing microembolization and the infarction could be observed on gross specimen. In the current study, the microinfarcts due to a certain load of small-sized microemboli (42 µm) were undetectable visually on gross specimen at 1 week. Thus, visualization of such microinfarcts directly with DE-MRI could be challenging, due to the very small areas of myocardial infarction, inadequate brightness because of partial volume effects, and lower contrast material concentration in cases of incomplete myocardial necrosis. Importantly, delayed-enhancement is not specific for myocardial infarction. Contrast enhancement may occur in a variety of other disorders, such as tumor, myocarditis, and hypertrophic cardiomyopathy (31). The tumor necrosis factor-alpha (TNF-α-mediated inflammatory response plays an important role in the myocardial damage following microembolization (9). Therefore, the inflammatory reactions as well as focal microinfarcts secondary to microembolization, which result in an increased distribution volume of MR contrast agents, could be the pathophysiologic mechanism for delayed-enhancement at 6 hours in the current study. The disappearance of hyperenhancement at 1 week can be attributed to the disappearance of interstitial edema accompanied by the decreased distribution volume of MR contrast agents (2632).
In magnitude image reconstruction, the performance of inversion recovery DE-MRI is highly sensitive to the choice of TI (31). Phase-sensitive reconstruction may reduce the variation in apparent size of hyperenhanced myocardium observed on magnitude images and render DE-MRI less sensitive to the choice of TI. Phase-sensitive reconstruction is also superior to magnitude reconstruction in terms of contrast-to-noise ratio, since phase-sensitive reconstruction can preserve the signal polarity and avoid decrease in contrast due to loss of polarity in magnitude images (2833). However, the background noise looks pixelated for phase-sensitive reconstruction because of the random phase and this may be a disadvantage.
Cine MRI showed a significant and persistent decline in the systolic wall thickening of the embolized region after microembolization in the current study. Our findings of persistent contractile dysfunction in the embolized region are generally in line with findings at 1 week and 7-8 weeks after embolization in pigs using larger embolic agents (2122). However, another study in dogs (32) using ultrasonic crystals embedded in the myocardium showed that profound contractile dysfunction occurred within hours after injection of small embolic agent (42 µm) and recovered spontaneously to basal values within 5-6 days after microembolization. The different responses to microembolization between studies may be attributed to the following factors: the size and number of the embolic agent used; the poor collateral circulation of humans and swines in comparison with that of dogs; and noninvasive vs. invasive approaches to acquire data. In the current study, the microvessel impairment is not expected to be severe, because of no grossly visible myocardial infarction and therefore, myocardial hibernation or stunning cannot be excluded (21). The persistent myocardial contractile dysfunction following microembolization may also be attributed to TNF-α-mediated inflammatory response, possible myocyte ongoing apoptosis, and progressive loss of cell integrity (9323435).
Microvessel impairment could affect coronary circulation in patients with coronary artery disease, despite no visible obstruction in the conduit epicardial arteries at coronary angiography (22736). This was also demonstrated in the current study using a swine model of coronary microembolization. Although normal-appearing epicardial arteries were observed immediately after the injection of microspheres, existing coronary microcirculation impairment could be detectable through MR perfusion imaging. Large decreases in the perfusion defect at the subacute stage may be attributed to the resorption of interstitial edema associated with microembolization and the complicated perfusion response to microembolic events. Experiments in the dog model (73738) show that coronary blood flow undergoes a transient decrease immediately after microembolization, followed by a more prolonged increase, which is explained by release of adenosine from the patchy microembolized regions. Dörge et al. (7) suggest that a decrease of blood flow in microregions supplied by embolized microvessels is probably counterbalanced by reactive hyperemia in adjacent regions. However, species variation, such as the presence of extensive collateralization in dogs but not in humans or pigs may play an essential role in the different perfusion responses to microembolization.
There were some insufficiencies and limitations in our study. To our knowledge, an ideal animal model of spontaneous plaque rupture with subsequent microembolization does not exist currently. The microspheres used in this study were chemically inert and the pathophysiological effect may differ from that of plaque and thrombus microembolization in patients. Therefore, the swine model used in this study could only partly mimic the in vivo situation of coronary microembolization; in addition, the current study was only designed to assess the acute and subacute effect of defined size and load of coronary small-sized microemboli. Another limitation is that pathological analysis was only performed at 1 week but not at 6 hours after microembolization.
In conclusion, coronary microembolization induced by a certain load of small-sized microemboli may cause normal-appearing epicardial coronary arteries on catheter coronary angiography and result in myocardial infarcts invisible to the naked eye. MRI characterization of myocardial impairments due to such microembolization includes the decline in myocardial dysfunction and perfusion at cine and first-pass perfusion imaging, and transient hyperenhancement at DE-MRI. Regional evaluation of myocardial contractility and perfusion by cine and first-pass perfusion MRI may be better than DE-MRI for evaluating the ischemic cascade due to coronary microembolization. It has potential clinical benefit in explaining the mismatch between epicardial arterial blood flow and myocardial dysfunction, and follow-up examinations.
 XML Download