

 PDF
PDF ePub
ePub Citation
 Print
Print


INTRODUCTION
Transarterial chemoembolization (TACE), first introduced in Japan, is now well established for managing unresectable hepatocellular carcinomas (HCC) showing prominent hypervascular staining on angiography due to rich arterial blood supply (1). The purpose of TACE is to deliver high concentrations of drug to the tumor, while preserving the surrounding liver parenchyma. Various embolization methods are used to increase drug delivery to tumor, including gelatin sponges and drug eluting beads (2, 3). The principal of TACE is selective delivery of chemotherapeutic agents to the tumor to achieve better outcomes (4, 5).
Two-dimensional (2D) digital subtraction angiography (DSA) is traditionally used to identify tumor-feeding arteries and serves as a roadmap to guide the microcatheter to the desired injection point. Recent improvements in imaging capabilities, such as cone-beam CT angiography (CBCTA) allow interventional radiologists (IRs) to detect smaller and less hypervascular HCC (6, 7). However, CBCTA with subsequent analysis for superselective or ultraselective TACE requires more lengthy analysis of complex vascular anatomy than DSA, as the operator is required to analyze multiplanar trace of the fine arteries repeatedly, even if only single injection of the contrast medium is required (8). In practice, the IR needs to leave the sterile angiographic room to manipulate the dedicated workstation for CBCTA data analysis. Several reports indicate that the use of automated software decreases required time while maintaining accuracy (9, 10) in CBCTA analysis. Software performance is affected by various factors, such as the tumor vascularity and diameter, and the vessels visibility in CBCTA images.
Although a palliative treatment, the ability to achieve initial higher local tumor response rate by superselective or ultraselective TACE that initially targets all feeding arteries, including the main and minor feeding arteries, is correlated to patient prognosis. Iwazawa et al. (11) reported longer local progression-free survival in patients treated with CBCTA-assisted chemoembolization, as compared to DSA only-guided chemoembolization. Their study forms the basis for next generation TACE, which avoids missing minor feeding arteries and preserves healthy liver from toxicity.
In this study we aimed to comparatively evaluate the accuracy of manual identification of tumor-feeding arteries in HCC treatment using DSA vs. an automated tumor-feeding artery detection software (FlightPlan For Liver; GE Healthcare, Chalfont St. Giles, UK) using CBCTA under three different settings, in order to analyze the impact of each setting on the software performance.
MATERIALS AND METHODS
Patient Population
Our Institutional Review Board approved this retrospective study. Fifty-two patients with inoperable HCCs who were referred for TACE between June 2013 and January 2014 were selected. From these 52 patients, 1 was excluded due to poor image quality as a result of poor patient cooperation during respiratory holding period; 1 patient was excluded due to extrahepatic parasites not derived from the common hepatic artery or replaced hepatic artery, but originating from the right inferior adrenal artery. Finally, 50 patients were enrolled in the study.
All patients were previously diagnosed with chronic viral hepatitis or liver cirrhosis: hepatitis B in 38 patients, hepatitis C in 5 patients, and unknown etiology in 7 patients. All HCCs were diagnosed based on the imaging findings from computed tomography (CT) or magnetic resonance imaging (MRI).
Twenty patients had > 1 HCC nodule, so a total 80 HCC nodules (mean diameter 20.8 mm) were included. Of these, 6 had a diameter ≥ 4 cm, 7 in the 3-4 cm range, 15 in the 2-3 cm range and 52 < 2 cm, and 67 HCC nodules in 44 patients ≤ 30 mm. The mean diameter of HCC nodules was 15.2 ± 5.4 mm.
Imaging Protocol
Angiography was performed under local anesthesia. A 5-Fr angiographic sheath was inserted into the right common femoral artery, and a 5-Fr Yashiro catheter (A&A MD, Seongnam, Korea) and a 0.035-inch hydrophilic guidewire (Terumo, Tokyo, Japan) were used to cannulate the common hepatic artery. A flat-panel detector C-arm angiography system (Innova IGS 540, GE Healthcare, Chalfont St. Giles, UK) were used to acquire DSA and CBCTA images from the same location during injection of contrast media (iodixanol [Visipaque] 320 mgI/mL; GE Healthcare) while asking the patients to hold their breath.
The DSA images were acquired on anterior-posterior projection with injection of 18 mL of contrast media at a flow rate of 3 mL/sec and a frame rate of 2 images/sec. If common hepatic arteriogram could not be performed with 5 Fr angiographic catheter due to anatomic variations or celiac stenosis, DSA of the right or left hepatic artery was performed with a 2.0-Fr tip microcatheter (Progreat; Terumo Clinical Supply, Kakamigahara, Japan) or 2.2-Fr microcatheter (JS microcatheter; A&A MD, Seongnam, Korea) with injection of 8-12 mL of contrast media at a rate of 1.5 mL/sec.
After DSA, a 3-dimensional (3D) CBCTA was performed while in the common or proper hepatic artery with injection of 30-36 mL of contrast media at a rate of 3 mL/sec. The scan delay was 5-7 seconds; hence, CBCTA was acquired 5-7 seconds after the start of contrast media injection. One hundred and fifty projections were obtained during a 5 second rotation, over an angular range of 200° (40°/sec rotation speed). The data sets were automatically transferred to a workstation (ADW 4.6, GE Healthcare) for reconstruction and analysis. The reconstructed 3D volume is a cylinder of 23-cm diameter, and 23-cm height, described in a matrix of 512 × 512 × 512 pixels.
Image Analysis by Automated Tumor-Feeding Artery Detection Software
The image analyses related to tumor-feeding branch detection were performed during the TACE session by the radiologic technician using dedicated software (FlightPlan for Liver, GE Healthcare) in 3 consecutive steps:
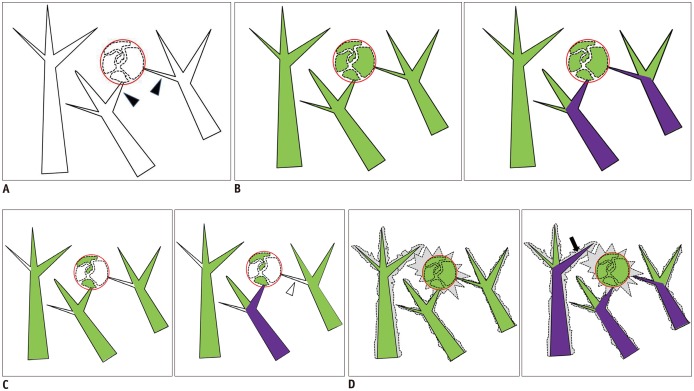
1) Vascular tree extraction: a seeding point was manually deposited at the proximal part of the proper hepatic artery. The software enables separation of the hepatic vascular tree from other structures (parenchyma, bones). The threshold between voxel intensities that are considered vessels was manually adjusted for segmenting more or less vessels from the background tissues (Fig. 1).
2) Target definition: the radiologic technician used multiplanar views (axial, sagittal, and coronal) to designate a spherical region of interest (ROI) around the targeted tumor. The ROI was adjusted to cover the entire tumor excluding the peripheral margin for maximum accuracy, based on the study by Iwazawa et al. (10).
3) Feeding artery selection: once proximal point and target ROI were defined, the software automatically extracted all vessels in the vicinity of the target, and highlighted them in a different color.
FlightPlan for Liver software settings for vascular tree segmentation were categorized into 3 groups to analyze the impact of the initial segmentation step: default setting, Group D; manual adjustment of the proportion of segmented tumor area between 30 to 50%, Group L; and between 50 to 80%, Group H.
Four groups of tumor feeding artery candidates were defined for each tumor using DSA alone, group D, group L, and group H results, respectively.
TACE Procedure
All potential tumor feeding branches at the subsegmental level of the hepatic artery, were selectively catheterized using a 2.0-Fr microcatheter. The artery was considered a true feeder if selective angiography or CBCTA after infusion of ethiodized oil (Lipiodol; Guerbet, Aulnay-sous-Bois, France) revealed partial or entire tumor blush.
After confirming blood supply to the tumor, TACE was performed using either conventional TACE (a mixture of Lipiodol and doxorubicin [Adriamycin RDF; Ildong Pharmaceutical, Seoul, Korea], followed by gelatin sponge particles), drug-eluting beads TACE (microspheres such as DC bead [Biocompatibles, Farnham, Surrey, UK], or Hepasphere [Biosphere Medical, Roissy, France] loaded with doxorubicin). Injection was discontinued upon stasis with drug-eluting beads or when opacification of portal veins was observed during conventional TACE.
Statistical Analysis
The ground truth was defined in consensus by 2 IRs, after reviewing all images obtained, during and after TACE, and in particular the selective injection of tumor feeder candidates.
Of all possible feeding arteries, true positive/negative, and false positive/negative tumor feeding arteries, were defined in consensus by 2 IRs. Possible tumor feeding arteries were the sum of suspected tumor feeding arteries on DSA or tumor feeding arteries from FPFL in each group. Of these, true positives were defined as vessels confirmed by either selective DSA or CBCTA (partial or entire tumor blush after infusion of Lipiodol in the suspected vessel); false positives were defined as potential feeder arteries not confirmed by selective DSA or CBCTA, but considered as feeders by either FPFL group D, L, H or DSA alone; false negatives were defined as potential feeder arteries confirmed by either selective DSA or CBCTA but not found using FPFL group D, L, H or DSA analysis; true negatives were defined as potential feeder arteries not confirmed as feeders using either selective DSA or CBCTA and not found as feeders using either FPFL group D, L, H or DSA analysis. Subsequently, accuracy, specificity, sensitivity, negative predictive value (NPV) and positive predictive value (PPV) were computed. A chi-squared test was used for multiple comparisons of the 3 FPFL groups, with respect to sensitivity, specificity, PPV, NPV, and accuracy. Factors were considered statistically significant with a p < 0.05.
RESULTS
Detectability and Correct Identification of the Tumor-Feeding Artery with DSA and FPFL
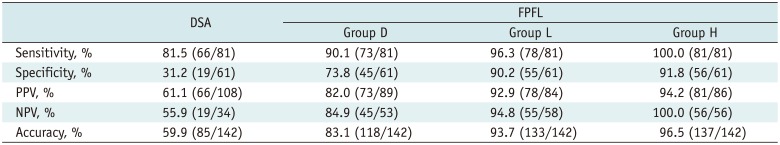
The software and DSA identified 182 possible tumor-feeding arteries in total, which originated from the common hepatic artery or the replaced hepatic artery. Among these, 109 feeding vessels were confirmed as true feeding branches for HCCs by selective angiography or CBCTA after injection of contrast media or Lipiodol. Ninety-three tumor-feeding vessels (85.3%) were identified with nonselective DSA. But, DSA identified a significantly smaller number of true negative vessels and a larger number of false positive vessels. FPFL showed significantly higher accuracy of tumor-feeding vessel detection than nonselective DSA, in all groups (p < 0.001) (Table 1).
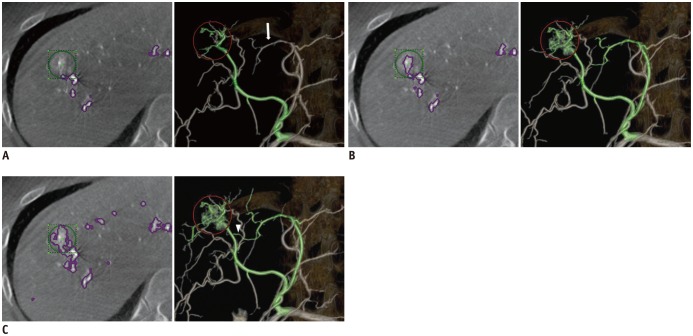
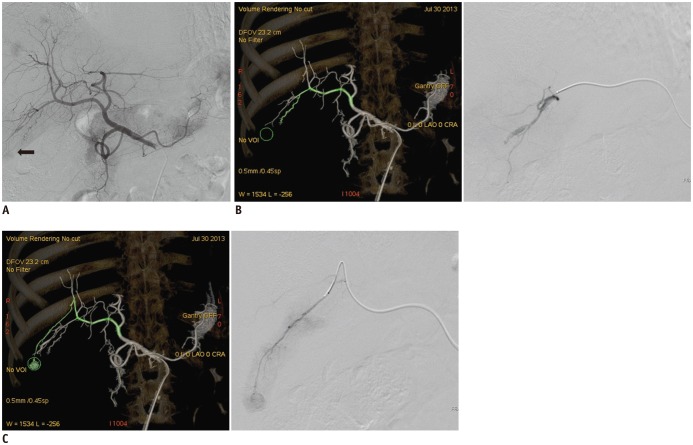
Group D showed a decreased number of true positive feeders and an increased number of false positive feeders, as compared to Group H, for e.g., 16 false positive tumor-feeding arteries were found in Group D, as compared to 7 false positive tumor-feeding arteries in Group H. In general, small tumor-feeding arteries were detected by adjusting segmentation sensitivity but not default setting (Group D) (Figs. 2, 3). The sensitivity of DSA, FPFL in groups D, L and H was 85.3%, 92.7%, 96.3%, 99.1%, respectively. The NPV of DSA, FPFL in groups D, L, and H was 56.8%, 87.7%, 94.2%, 98.5%, respectively. The accuracy of DSA, FPFL in groups D, L, and H was 62.6%, 86.8%, 93.4%, 95.6%, respectively. The sensitivity, NPV, and accuracy of FPFL were higher in Group H than in Group D (p = 0.041, 0.034, 0.005). All 3 segmentation sensitivity groups showed higher specificity, PPV, NPV, and accuracy of FPFL, as compared to DSA.
Detection and Accurate Identification of the Tumor-Feeding Artery in HCC Nodules ≤ 30 mm
In the small tumors (n = 67), 81 tumor-feeding arteries were identified. DSA showed lower accuracy than FPFL in the 3 groups (p < 0.001) (Table 2). There was in sensitivity, specificity, PPV, NPV, and accuracy of FPFL showed no significant differences between Group L and Group H. Specificity (p = 0.034) and accuracy (p = 0.010) of FPFL were significantly different between Group D and Group L. However, Group D and Group H showed a significant difference in sensitivity (p = 0.011), specificity (p = 0.016), PPV (p = 0.025), NPV (p = 0.008), and accuracy (p = 0.000) of FPFL.
DISCUSSION
Conventional DSA uses 2D frontal and oblique projection images to identify tumor-feeding arteries, hence, minor feeding arteries could be missed due to overlapping vessels. Main feeding arteries that are non-hypertrophic are also difficult to find on DSA images. On the contrary, CBCTA provides 3D geometry of vessels and liver parenchyma that can be helpful in the analysis of the liver arterial tree (12). Kakeda et al. (13) reported that additional information was available from the CBCTA in 81% patients, indicating the benefit of CBCTA over 2D DSA. Virmani et al. (14) described that CBCTA provided additional information in 39% patients, which led to microcatheter position modification when performing TACE. Some reports indicated that CBCTA is more accurate than 2D DSA in identification of minor feeding arteries (8, 15). Additional CBCTA is considered time-consuming (9); however, Iwazawa et al. (16) showed that CBCTA in conjunction with FPFL software allowed comparable tumor response rate with fewer image acquisitions and in less time than DSA alone.
Two studies previously reported that computer aided identification of feeding-arteries is both accurate and sensitive (9, 16). Moreover, the software is not entirely automatic, and Iwazawa et al. (10) previously showed the impact of ROI size on accuracy. Thus, the ROI should be exactly adjusted to the size of the tumor to maximize sensitivity; if the ROI is too small or large, the sensitivity of the software is decreased, but remains superior to DSA alone.
Herein, we studied the impact of the manual adjustment allowed in the software, i.e., threshold during vessel segmentation. The results indicated that if the arterial enhancement of the tumor is faint or the feeding vessel is too small to achieve proper contrast enhancement against surrounding liver parenchyma, the segmentation sensitivity should be elevated to extract more vessels. But, increasing finely tuned segmentation sensitivity also increases the false vascular structures; software misinterprets the liver parenchyma or beam-hardening artifact as vascular structures and decreases the accuracy by increasing false positive feeding vessels. Although the current vendor provides automated algorithms, various factors can affect the accuracy of the threshold. We used the extent of highlighted area within target tumor as standard. Under our angiography protocols, the default setting (group D) showed various segmentation sensitivity, but usually < 50% of the target ROI was defined as vascular structures, which showed similar sensitivity with group L. But in some cases, especially in small HCC, the segmentation sensitivity of default setting was either too low or too high, resulting in false negative or false positive results. We demonstrated that increased segmentation sensitivity (group H) in HCC nodules < 30 mm has highest accuracy, as compared to the other groups. Overall, all FPFL groups showed higher accuracy than standard DSA alone. Increased accuracy is often compromised by greater numbers of false positives; however, the clinical benefit of complete treatment outweighs the risk of aggressive TACE.
Lee et al. (17) reported 90% accuracy of CBCTA with maximum intensity projection (MIP) and multiplanar reformation (MPR) analysis. However, the separation of MIP and MIP + MPR suggests that the inexperienced user has difficulties in analyzing the CBCTA on MPR basis. In our experience, properly adjusted segmentation sensitivity of FPFL can shows the accuracy of MPR image in depicting tumor and subtle feeding arteries, and served as a 3D navigation tool via MIP imaging of the feeding artery.
In our patient population, 20 HCC nodules were supplied by > 1 feeder from a different segmental artery. Usually, the main feeding artery is easily identified, but it is difficult to detect several minor feeders with nonselective 2D DSA because the minor tumor feeding artery is usually non-hypertrophic. FPFL allows distinguishing feeders including minor ones from adjacent hepatic arteries. Each feeder can then be exported and overlaid automatically over live fluoroscopy, as a 3D roadmap to facilitate the TACE procedure (Innova Vision; GE Healthcare).
The current generation of FPFL has several limitations. First, the accuracy is affected by the size of the manually deposited ROI; also, only spherical shape is currently available, which is inappropriate to evaluate irregular or ovoid shaped HCCs. Secondly, only one ROI can be deposited at a time. In patients with several HCC nodules, the process must therefore be repeated. Lastly, all vessels in the geometric vicinity of a tumor are not necessarily tumor feeding arteries. For example, in a patient with a subcapsular HCC nodule located in the segment 3, the software misidentified an accessory left gastric artery as tumor feeding artery due to its proximity to the tumor.
This technique depends on good quality CBCTA with cooperation of sedated patients for breath holding, appropriate injection protocols, and X-ray delays. Moreover, only contrast injected vessels are taken into account. So, non-injected vessels, such as collateral or parasitic arterial supply from extrahepatic sources cannot be detected.
In conclusion, FPFL is a valuable tool for increasing the ability to detect HCC tumor feeding vessels compared to standard DSA analysis. It can assist the radiologist in his analysis of the complex liver vascular tree, particularly identification of small feeders, often difficult to see on DSA. Manual adjustment of segmentation sensitivity improves the accuracy of FPFL.

 XML Download