

 PDF
PDF ePub
ePub Citation
 Print
Print


INTRODUCTION
Histiocytic sarcoma is a rare malignant neoplasm composed of cells with morphological and immunophenotypical features similar to those of mature histiocytes (1). It presents in unifocal or multifocal sites, commonly involving the lymph nodes, soft tissue, skin, and gastrointestinal tract (1), and may also involve the spleen, liver, lung, nasal cavity, and central nervous system (2). Histiocytic sarcoma of the liver is extremely rare. Some previous reports of splenic or intestinal histiocytic sarcomas referred to liver involvement (2345,678); however, detailed imaging findings were not described. To our knowledge, magnetic resonance imaging (MRI) findings of histiocytic sarcoma in the liver have not been reported previously. Herein, we presented a case of histiocytic sarcoma of the liver diagnosed by liver biopsy and discuss the imaging and pathological findings. This retrospective case report was approved by the Review Board of Institute of Medical Science, University of Tokyo.
CASE REPORT
A 68-year-old woman was referred to our hospital for long-standing thrombocytopenia without other symptoms. The thrombocytopenia was resistant to steroid therapy. A splenectomy was performed at another hospital, and histiocytic sarcoma of the spleen was diagnosed histopathologically. On physical examination, bilateral axillary lymphadenopathy was observed. Laboratory tests showed a low platelet count of 77000/µL. Liver enzymes were within normal ranges. Cytological and histological analyses of bone marrow aspirates and biopsy samples showed normal bone marrow. She had no history of blood transfusion.
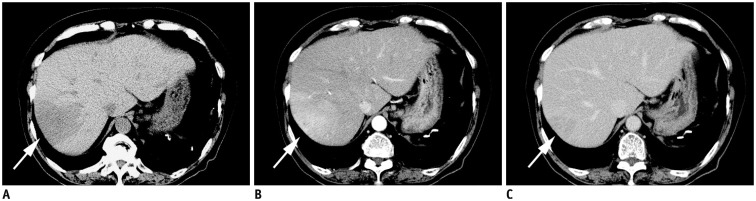
After admission to our hospital, routine computed tomography (CT) revealed a wedge-shaped hypoattenuating area bounded by hepatic veins in the right liver lobe (Fig. 1A, arrow). On the arterial phase of dynamic contrast-enhanced CT, faint enhancement was seen in this area (Fig. 1B, arrow), and most of the area was enhanced, as was the liver parenchyma on delayed phase (Fig. 1C, arrow).
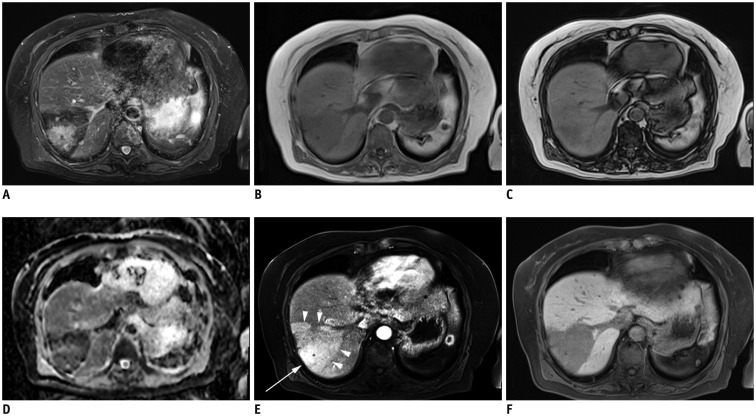
On MRI with a 1.5T system, an ill-defined hyperintense signal area was found in wedge-shaped dark signal intensity area on fat-suppressed T2-weighted images using turbo spin echo (repetition time [TR]/echo time [TE] = 2284/64 ms, echo train length = 11) (Fig. 2A). The signal intensity of the wedge-shaped area was lower on T1-weighted in-phase images (TR/TE = 3.9/2.4 ms, flip angle = 10°) (Fig. 2B) than on T1-weighted out-of-phase images (TR/TE = 3.9/1.2 ms, flip angle = 10°) (Fig. 2C). Thus, iron deposition was suspected. Apparent diffusion coefficient (ADC) map calculated from diffusion-weighted images with motion-probing gradients along three orthogonal axes of b-values of 0, 50, and 800 s/mm2 indicated absence of restricted diffusion in the corresponding hyperintense signal area on fat-suppressed T2-weighted images (Fig. 2D). The surrounding wedge-shaped area had low signal intensity on the ADC map, which was considered to be due to iron deposition, based on the combination imaging findings of in-phase and out-of-phase images.
After the injection of gadolinium-ethoxybenzyl-diethylenetriamine pentaacetic acid (Gd-EOB-DTPA), a dynamic study was performed using three-dimensional gradient echo (TR/TE = 4.2/2 ms, flip angle = 9°) with fat saturation. The area corresponding hyperintensity on fat-suppressed T2-weighted images was enhanced on the arterial phase, and was surrounded by a faint enhancement in the wedge-shaped area bounded by hepatic veins (Fig. 2E, arrowheads). A well-defined wedge-shaped decrease of Gd-EOB-DTPA was found on hepatobiliary phase 20 minutes after the injection of contrast agent (Fig. 2F). Corresponding portal vein branches were intact on both CT and MRI.
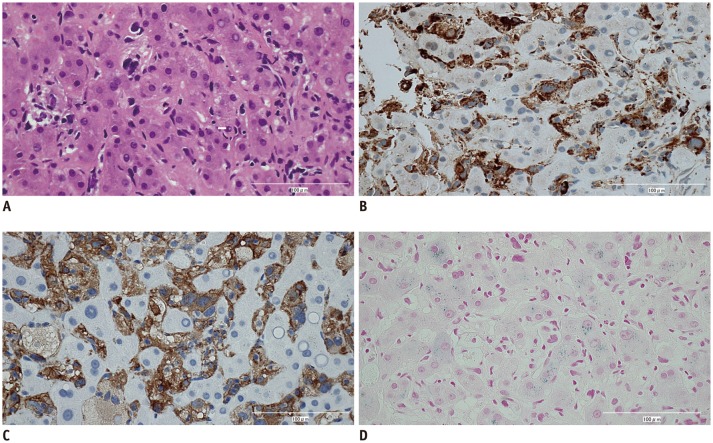
On ultrasound, a hyperechoic lesion was located in the ill-defined hypoechoic area. An ultrasound-guided liver biopsy was performed for diagnosis, and histopathological examination demonstrated atypical tumor cells with large pleomorphic nuclei infiltrating the liver sinusoids (Fig. 3). Tumor cells were positive for histiocytic markers, including CD68 and CD163 and negative for CD1a, Langerin, and S-100 protein. The final histological diagnosis was histiocytic sarcoma. Iron staining was performed, and the normal hepatocytes were positive for iron staining; whereas, tumor cells showed no iron deposition.
DISCUSSION
Histiocytic sarcoma is a hematopoietic neoplasm, composed of cells showing morphological and immunophenotypical features similar to those of mature tissue histiocytes (1). It occurs over a wide range of ages, peaking in adults (median age, 52 years) (1). There is no apparent gender difference. Patients with histiocytic sarcoma have poor prognosis because of limited response to therapy.
Histiocytic sarcoma of the liver is extremely rare, with accompanying symptoms of liver dysfunction and thrombocytopenia (345). Most reported cases of primary histiocytic sarcoma of the spleen show occurrence of liver metastases (345678) with multifocal nodules on CT and MRI (357). To our knowledge, there are no reports of primary histiocytic sarcoma in the liver. In our case, the hepatic lesion developed subsequent to splenic histiocytic sarcoma; thus, the liver lesion was considered a metastasis. Histopathological findings from biopsy, surgery, or autopsy indicate that in all cases, the tumor cells of the hepatic histiocytic sarcoma infiltrate predominantly to the sinusoids (345). In our case, a biopsy likewise revealed intrasinusoidal infiltration of the tumor cells.
The imaging findings of histiocytic sarcoma of the liver are not well described. Multinodular lesions in the liver and hepatomegaly were reported in previous cases (34567); however, detailed imaging findings were not described. In our case, dynamic studies using CT and MRI were performed, and a wedge-shaped enhancement was seen on arterial phase. A decrease in uptake of Gd-EOB-DTPA was found on the hepatobiliary phase in the corresponding area. These findings suggested focal decreased portal flow. Several non-neoplastic or neoplastic diseases affect portal flow (910). In the conditions of veno-occlusive disease, Budd-Chiari syndrome, and congestive hepatopathy, increased sinusoidal pressure decreases flow through the portal system (11). In our case, increased sinusoidal pressure due to tumor cell invasion into the sinusoids may have resulted in decreased portal flow.
In our case, the signal intensity of the wedge-shaped area was lower on in-phase images than on out-of-phase images. Due to the higher TE of the in-phase sequence than that of the out-of-phase sequence, the in-phase sequence is more sensitive to iron deposition because of the increased T2* effect (12). Thus, in our case, suspected iron deposition in the liver was confirmed histologically. Hepatic iron deposition is associated with iron overload disorders, such as primary hemochromatosis and hemosiderosis; however, iron deposition is commonly not segmental but diffuse. There was also no history of blood transfusion. Kadoya et al. (13) reported that a disturbance in portal blood flow possibly results in segmental hepatic iron deposition. In our case, it was evident that decreased portal flow caused iron deposition in the liver. In addition, the splenic histiocytic sarcoma was confirmed prior to the hepatic lesion; therefore, the liver mass was considered a liver metastasis. Primary hepatic histiocytic sarcoma may show different imaging findings.
In conclusion, we reported a case of histiocytic sarcoma of the liver with imaging and histopathological findings. The intrasinusoidal invasion of histiocytic sarcoma may cause the characteristic imaging findings of decreased portal flow and iron deposition. Diagnosis of histiocytic sarcoma of the liver is difficult due to its rarity. However, imaging findings similar to those presented in our case may favor the diagnosis of histiocytic sarcoma of the liver.
 XML Download