

 PDF
PDF ePub
ePub Citation
 Print
Print


INTRODUCTION
Accurate evaluation of the splenic involvement in lymphoma is important because it may alter tumor staging, treatment protocols and determination of the overall prognosis (1). Although the spleen plays an important role in immunological defenses, it is involved in approximately 30–40% patients of Hodgkin's disease (HD) and 10–40% of non-Hodgkin's lymphoma (NHL) (2). Splenic involvement in HD is frequently one of the reasons for upstaging of the disease and consequently alters the treatment plan. Most of the patients with NHL present with disseminated disease, and therefore, splenic involvement is less relevant to the overall staging. However, involvement of the spleen may be selectively targeted by treatment options such as splenectomy or radiotherapy (1).
Despite the importance of accurate splenic assessment, detection of diffuse splenic involvement in lymphoma has been limited. Histologic confirmation of splenic involvement has not been considered as a standard procedure because of concerns regarding risk of bleeding and difficulty of accessibility for a safe approach. The limitations of biopsy have led to the development of alternative, noninvasive methods to evaluate splenic involvement in patients with lymphoma. Until now, several studies using conventional imaging modalities, such as computed tomography (CT), ultrasonography (US), and magnetic resonance imaging have been investigated to evaluate splenic involvement in patients with lymphoma. However, diffuse infiltrative splenic lymphoma (DISL) is difficult to detect by CT or US, even though it is the most common form of splenic lymphoma (34).
Contrast-enhanced dynamic CT of the spleen shows a normal mottled or heterogeneous enhancement pattern during the arterial phase (AP) and gradual homogeneous enhancement during the portal venous phase (PVP) (56). The cause of these transient heterogeneous patterns is related to the unique anatomic structure of the spleen, with variable rates of flow through the red and white pulp of the spleen (5678). Therefore, we hypothesized that diffuse infiltrative lymphoma of the spleen may obliterate normal heterogeneous splenic enhancement pattern on the AP images because it interrupts variable rates of blood flow.
The aim of this study was to evaluate the diagnostic performance of obliteration of normal heterogeneous enhancement of the spleen (ONHES) on the AP CT images for diagnosis of DISL in patients with lymphoma, and to assess the added value of ONHES by comparing the diagnostic performance of subjective splenomegaly alone and ONHES in conjunction with subjective splenomegaly.
MATERIALS AND METHODS
Patients
The study was approved by our Institutional Review Board, and the requirement for patient informed consent was waived. Between January 2004 and December 2014, we retrospectively searched database and enrolled 405 patients orgwith histologically proved lymphoma who underwent two-phase abdominal CT during the AP and PVP. Among them, 177 patients underwent either surgery or positron emission tomography/CT (PET/CT) or follow-up CT to diagnose splenic involvement as a reference standard. Of the 177 patients with lymphoma, 41 were excluded from the study for the following reasons: presence of single or multiple splenic low attenuating lesions (n = 22) including the nodular type of splenic involvement, hemangioma, pseudocyst, and other focal splenic lesions, because our study included patients with normal-appearing spleen or splenomegaly without focal lesion on PVP images; chemotherapy between CT and PET/CT (n = 7); history of splenectomy before (n = 2); marked splenic infarction (n = 3); and long interval (more than 1 month) between CT and PET/CT (n = 7). Finally, a total 136 patients (89 men, 47 women; mean age, 60 years; range 21–87) with lymphoma were retrospectively evaluated.
CT Protocol
All CT examinations were performed on 16- or 64-detector row CT scanner (Sensation 16 or Sensation 64; Siemens Medical Solutions, Forchheim, Germany). The following scanning parameters were used for the 16- and 64-channel multidetector CT (MDCT) scanners: detector configurations of 16 × 0.75, and 64 × 0.625 mm, respectively; section thicknesses of 3.0–5.0 and 3.0 mm, respectively; reconstruction intervals of 3 mm, respectively; a field of view of 304–360 mm, a tube current-time product of 144–486 mAs, and a peak voltage of 120 kVp. After acquisition of unenhanced scans, contrast-enhanced scans were performed. A total of 1.2–1.5 mL of nonionic contrast material (iopromide [370 mg of iodine per milliliter], Ultravist 370; Bayer Healthcare, Berlin, Germany) per kilogram of body weight was usually injected into an antecubital vein of the patient at a rate of 3 mL/sec by using a power injector. A bolus-tracking technique was used to optimize the timing of the AP scan. PVP images were obtained 80 seconds after the contrast injection. A 20-mL flush of normal saline solution was administered immediately after the contrast injection.
Image Analysis
Evaluation of the ONHES on AP Image and Splenomegaly
CT findings were independently evaluated by two observers (observers 1 and 2) with 30 and 4 years of experience in abdominal imaging on a picture archiving and communication system workstation monitor (Maroview, INFINITT Healthcare, Seoul, Korea). They were blinded to the patients' clinical or laboratory information as well as next follow-up CT findings or PET/CT findings; however, they were aware that the study population had lymphoma. CT images were analyzed in 3 different reading sessions.
At the first session, the observers were asked to determine DISL based on the presence or absence of ONHES on AP images regardless of splenic size. Visual assessment of the ONHES was performed by using a 5-point scale as follows: 1 for definitely heterogeneous enhancement such as diffuse striped or mottled patterns throughout the whole spleen, 2 for probably heterogeneous enhancement that showed a striped or mottled enhancement pattern throughout less than half of the whole spleen, 3 for undetermined, 4 for probably homogeneous enhancement, and 5 for definitely homogeneous enhancement without evidence of mottled patterns throughout the whole spleen. Homogeneous enhancement of the spleen on AP image was defined as a diffuse infiltrative lymphoma of the spleen. The grading was made as an overall assessment of splenic enhancement from the total splenic volume on axial CT images.
One week after the assessment of ONHES, two observers were asked to determine subjective splenomegaly. Subjective splenomegaly was defined as maximal width > 11 cm and thickness > 5 cm at the splenic hilum measured on axial images (9). Subjective splenomegaly was evaluated using visual assessment by aforementioned definition, simulating daily practice.
Two weeks after the second reading session, the two observers were also requested to score their confidence level with respect to the diagnosis of the DISL based on the addition of ONHES on AP CT to subjective splenomegaly. In other words, the DISL was regarded when subjective splenomegaly was seen with ONHES on AP CT with allocated confidence levels of 4 or 5. In case of no evidence of subjective splenomegaly or subjective splenomegaly with ONHES on AP CT assigned confidence levels of 1–3, we interpreted no evidence of DISL. False-negative or false-positive cases that were incorrectly interpreted were analyzed.
Evaluation of the Splenic Index
Two inexperienced radiology trainee (observers 3 and 4, 1 and 4 years of experience in radiology, respectively) without any subspecialty assessed splenic index, which represents objective splenomegaly in the detection of splenic involvement of the lymphoma. They were requested to measure splenic width, thickness, and length for splenic index obtained by multiplying splenic width, thickness, and length, as previously described (1011). Maximal width and thickness at the splenic hilum were measured on axial images. Splenic length was determined by multiplying the number of all the images on which the spleen was observed and slice thickness.
Reference Standard
Diagnosis of splenic involvement were performed as follows: splenectomy (n = 3), PET/CT (n = 121), follow-up CT (n = 12). Histologic proof of splenic involvement was not obtained as a standard procedure. We regarded the splenic involvement in patients with lymphoma when there were definite radiologic findings on PET/CT or follow-up CT, as alternative methods. The definite radiologic findings defined that diffuse 18F-fluorodeoxyglucose splenic uptake of greater than hepatic uptake on PET/CT or reversal of progression of splenic size on follow-up CT. This strategy has been used in some previous studies (121314).
Statistical Analysis
All statistical analyses were performed using commercial software (SPSS, version 21, SPSS Inc., Chicago, IL, USA; MedCalc for Windows, version 12.7.0, MedCalc Software, Mariakerke, Belgium). The diagnostic performance of CT findings in the determination of DISL was analyzed by using receiver operating characteristic (ROC) curve analysis. The diagnostic accuracy of each CT imaging and each observer were determined by calculating the area under the ROC curve (Az). The comparison of each of the Az values was performed using the standardized normal z-score test (15). The sensitivity, specificity, positive predictive value (PPV), and negative predictive value (NPV) were calculated by the number of patients assigned as a confidence level of 4 or 5 among the 136 lymphoma patients. We defined false-negative cases as those assigned confidence levels of 1–3 that were confirmed as DISL, and false-positive cases as those assigned confidence levels of 4 or 5 that were confirmed as non-DISL. Interobserver agreement was evaluated with the weighted κ statistic for noncontinuous scales and with the intraclass correlation coefficient (ICC) for continuous scales. A kappa (κ) value of ≤ 0.20 indicated slight agreement; κ value of 0.21–0.40 indicated fair agreement; κ value of 0.41–0.60 indicated moderate agreement; κ value of 0.61–0.80 indicated substantial agreement; and κ value of > 0.8 indicated excellent agreement. ICCs of > 0.75 were indicative of high agreement. A p value < 0.05 was considered statistically significant.
RESULTS
Patients Demographics and Diagnoses
We included 136 patients with a mean age of 60.4 ± 15.0 (standard deviation) years (range, 21–87 years). Histopathologic diagnosis by extrasplenic lymph node biopsy, bone marrow biopsy or splenectomy were NHL in 130 (96%) and Hodgkin's lymphoma in 6 (4%) patients. Three of the 136 patients underwent splenectomy. Pathologic examination revealed diffuse large B-cell lymphoma in 2 patients and no evidence of tumor in 1 patient. Of the 136 patients, histopathologic diagnosis of clinicopathologically confirmed 11 cases with DISL were as follows; mantle cell lymphoma (n = 2), diffuse large B-cell lymphoma (n = 3), other non-follicular lymphoma (n = 1), peripheral T-cell lymphoma (n = 3), other mature T/NK-cell lymphoma (n = 1), and angioimmunoblastic T-cell lymphoma (n = 1).
Diagnostic Performance of the ONHES
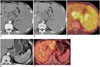
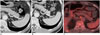
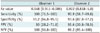
Table 1 listed the calculated Az values, sensitivity, specificity, PPV, and NPV for ONHES of observers 1 and 2 in the diagnosis of DISL. The Az values of ONHES (0.948 for observer 1 and 0.922 for observer 2) were superior to that of splenic index (0.872 for observer 3 and 0.877 for observer 4), but the difference was not statistically significant (p > 0.05). Among the 136 patients, observer 1 detected 22 ONHES and observer 2 detected 18 ONHES with a confidence rating of 4 or 5. ONHES was true-positive in 11 of the 22 patients for observer 1 and in 10 of the 18 patients for observer 2 (Fig. 1). ONHES was false-positive in 11 of the 22 patients for observer 1 and in 8 of the 18 patients for observer 2. Most of cases with false-positive showed small spleen size (Fig. 2). None of false-negative cases was diagnosed by observer 1. However, 1 of the 118 was false-negative for observer 2. The two observers showed excellent interobserver agreement (κ = 0.883) in the ONHES.
Evaluation of the Subjective Splenomegaly
Splenomegaly (n = 31) was true-positive in all 11 patients with DISL and false-positive in the remaining 20 patients, with PPV of 35.5% (11/31) and accuracy of 85.3% (116/136) for observer 1. Splenomegaly (n = 28) was true-positive in all 11 patients with DISL and false-positive in the remaining 17 patients, with PPV of 39.3% (11/28) and accuracy of 87.5% (110/136) for observer 2. The two observers showed excellent interobserver agreement (κ = 0.845) in the subjective splenomegaly.
Evaluation of the Added Value of ONHES during Addition of ONHES to Subjective Splenomegaly
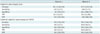
After evaluation of ONHES in conjunction with subjective splenomegaly, the PPV was 100% for observer 1, 90.9% (10/11) for observer 2, respectively, and the accuracy was 100% for observer 1, 98.5% (134/136) for observer 2, respectively (Table 2). The combined interpretation of ONHES on AP CT and subjective splenomegaly showed significantly higher diagnostic performance for DISL, as compared to using subjective splenomegaly alone.
Diagnostic Performance of the Splenic Index
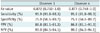
The calculated Az values, sensitivity, specificity, PPV, and NPV for splenic index of observer 3 and observer 4 in the diagnosis of DISL were shown in Table 3. The cut off value of the splenic index for diagnosis of the DISL was 499.7 cm3 for observer 3 and 484.10 cm3 for observer 4, respectively. Using the splenic index > 480 cm3 as an indicator of splenic involvement (10), 9 of the 21 patients were true-positive with DISL and the remaining 12 patients were false-positive. The interobserver agreement of splenic index (ICC = 0.999) was high.
DISCUSSION
Splenic lymphoma is characterized by discrete nodule formation or diffuse uniform infiltration. Multiple nodular type of splenic involvement is relatively easy to diagnose (1617). However, DISL is difficult to detect by CT or US, even though it is the most common form of splenic lymphoma (34), because DISL can manifest as a normally appearing spleen such as that with microscopic involvement only. The most frequently used parameter for the diagnosis of splenic lymphoma is splenomegaly (18). Previous studies evaluated splenic index, spleen size, and spleen weight to assess the degree of spleen enlargement (81118). However, splenomegaly is not diagnostically specific. The spleen can be enlarged without lymphoma involvement because of a reactive process. Moreover, the spleen may be of normal size despite tumor infiltration (111). Although studies using PET/CT reported good diagnostic performance, it is not cost effective (119).
The strength of our study was to evaluate DISL with new method such as ONHES. The enhancement patterns of normal spleen during the AP CT are varied, such as serpentine, cordlike, and arciform distribution (56). These transient heterogeneous enhancement patterns are related to the unique anatomic structure of the spleen, with variable rates of flow through the red and white pulp of the spleen (5678). The red pulp of the spleen consisting of splenic sinuses and splenic cord resembles a sponge and its circulation rate is relatively slow (20). The white pulp is composed of the lymphoid nodules and periarterial lymphatic sheath, which is closely associated with the central arteriole (20). In case of DISL, it usually involves the periarteriolar lymphoid sheath of the white pulp (2122). Thus, ONHES is considered related to mainly involvement of the white pulp, which slows down its flow rate. There were several trials to diagnose splenic lymphoma. However, previous study with contrast-enhanced US showed no clear advantage (23). Another study with superparamagnetic iron oxide as a contrast agent for MR imaging reported unreliable results due to small population size. Furthermore, production of this contrast material has been discontinued and is no longer commercially available (24).
Our study showed a high diagnostic performance for the diagnosis of DISL and is easily reproducible. Most studies for splenic lymphoma involvement focused on splenomegaly (111225). Although direct comparisons were not available with our study, the diagnostic accuracy of our study was higher than that of previous studies. The reported diagnostic accuracies of CT for detecting splenic involvement ranged from 37–91% in patients with lymphoma (11). Rini et al. (12) and Munker et al. (25) reported that the accuracies of 37% and 57% for splenic lymphoma used the criterion of splenic enlargement or splenic hypodensities on CT images, respectively.
In our study, ONHES demonstrated a false-positive result in 11 of the 22 patients for observer 1 and 8 of the 18 patients for observer 2. Among 11 false-positive cases, 7 had no splenomegaly, which showed a splenic index lower than 250 cm3. We considered that heterogeneous enhancement pattern may not be observed in small-sized spleen because the flow rate through the red and white pulp of the spleen is not sufficient. Therefore, based on these results, careful interpretation is needed to evaluate ONHES for small-sized spleen, such as use of the splenic index < 250 cm3. Several factors such as portal vein thrombosis, congestive heart failure, and liver disease can affect the splenic composition, which means the ratio of white and red pulp. Therefore, these factors may affect normal splenic heterogeneous enhancement. In addition, slow injection rate and improper rapid scanning may also lead to false-positive findings. In our study, ONHES showed a false-negative result in only 1 of the 118 cases for observer 2, but none was reported as false-negatives by observer 1.
In our study, the cut off value of the splenic index for diagnosis of DISL was defined as splenic index > 499.7 cm3 for observer 3 and 484.10 cm3 for observer 4. Our results corresponded well with those of previous studies, which suggested an upper normal level of 314.5 cm3 for the splenic volume (8) and for a splenic index of 480 cm3 (1026). Our results showed good agreement with the results of a previous study by Strijk et al. (11) who reported diagnostic accuracy of 91% using the criterion of the splenic index > 480 mL as indicative of splenic involvement in HD.
In our study, ONHES in conjunction with subjective splenomegaly showed higher accuracy and PPV for diagnosis of DISL compared with subjective splenomegaly alone. Although objective splenomegaly including splenic index is more accurate for diagnosis of splenomegaly, measurement of the splenic length by adding all slice thickness is time consuming. The measurement of the splenic index is not easy in daily practice; therefore, in practice, most observers assess splenomegaly by subjective evaluation of CT images based on experience. Diagnosis of DISL with subjective splenomegaly alone showed a high false-positive rate, which was observed in 20 of the 30 patients for observer 1 and 10 of the 27 patients for observer 2. Although marked splenomegaly is commonly suggestive of lymphoma involvement, enlarged spleens often contain no evidence of tumors, and the spleen in a patient with lymphoma may be enlarged because of a reactive process (38). Because of these problems, Fishman et al. (27) suggested that findings of splenomegaly in conjunction with splenic hilar adenopathy are suggestive of splenic lymphoma infiltration. In our study, the diagnostic performance was remarkably improved when we used the criterion of subjective splenomegaly in conjunction with ONHES in diagnosing DISL.
Our study had several limitations. First, pathologic confirmation was not obtained for all patients. However, histopathologic confirmation of the spleen has not been recommended as a standard procedure. Previous studies reported that the PET/CT showed high diagnostic performance for splenic involvement in lymphoma patients as reference results with pathologic confirmations (1213). In addition, the sensitivity and specificity of the PET/CT was almost 100% as a reference standard by histopathologic examination (1). As specified in the revised response criteria (26), the use of PET/CT is recommended before treatment during evaluation of diffuse large B-cell lymphomas and HD. Second, we evaluated small number of cases with true-positive DISL, which may lead to an overestimation of the results. In our study, the selection of cases with DISL was limited in number because we included only cases clinicopathologically confirmed as diffuse infiltrative type and excluded DISL cases with splenic infarctions. Third, our study was a retrospective design that might have selection bias and verification bias. Fourth, although CT is one of the standard diagnostic modalities used for the evaluation of initial staging in patients with lymphoma, AP CT has not been used as a routine protocol at our institution because AP CT might increase radiation exposure and raises concerns on justification of medical exposure. However, if AP CT is performed only with initial staging workup in patients with lymphoma, the benefit such as exact staging of splenic involvement may overcome the radiation hazard.
In conclusion, ONHES in conjunction with subjective splenomegaly could improve the diagnostic performance for DISL. Our results suggested that ONHES on AP CT images could be useful as an adjunctive diagnostic indicator of DISL in patients with lymphoma.
 XML Download