

 PDF
PDF ePub
ePub Citation
 Print
Print


INTRODUCTION
Contrast-enhanced MR angiography (CE-MRA) and computed tomography angiography (CTA) can provide excellent depiction of the renal arteries and offer the excellent results in assessing renal arteries (12); however, the contrast enhanced technique may cause nephrogenic systemic fibrosis or contrast-induced nephropathy, especially in patients with renal insufficiency (34). Therefore, non-contrast enhanced MRA (NCE-MRA) has gained keen interest as an alternative to CE-MRA and CTA, particularly in renal MRA, because renal arterial disease is commonly accompanied with renal function impairment.
Currently, some NCE-MRA techniques do provide an effective evaluation on renal artery. Lanzman et al. (5) reported that steady-state free precession (SSFP) NCE-MRA is a reliable alternative imaging technique for the assessment of transplant renal arteries stenosis (TRAS), as compared with digital subtraction angiography (DSA). Mohrs et al. (6) found that the sensitivity, specificity, positive predictive value and negative predictive value of NCE-MRA with SSFP in displaying renal artery stenosis (RAS) with > 50% were 75%, 99%, 75%, and 99%, respectively. Tang et al. (7) reported that NCE-MRA using spatial labeling with multiple inversion pulses (SLEEK) was superior to color Doppler ultrasonography in detecting accessory renal arteries and had an excellent correlation with DSA in displaying TRAS (r = 0.96; p < 0.05). However, NCE-MRA image quality needs improvement, especially for presenting the third and fourth order renal segmental branches in the renal parenchyma.
In our study, the visibility of segmental branches in the renal parenchyma was boosted by a SLEEK NCE-MRA technique with various blood-suppression inversion times (BSP TI). BSP TI is described as the duration between the initial inversion pulse and time point that longitudinal magnetization of blood reaches zero (null) point, which was also named as inversion time after the spatial-selective inversion-recovery pulse (ssTI) in Time-SLIP NCE-MRA (8), TI (Time delay) in SSFP NCE-MRA (6) and BSP TI in NCE-MRA with inflow inversion recovery (IFIR) (9). For clear presentation of the renal artery, Shonai et al. (8) suggested an ssTI of 1200-1800 ms with Time-SLIP NCE-MRA on a 1.5T scanner, Utsunomiya et al. (10) suggested ssTI of 1300-1500 ms with Time-SLIP NCE-MRA, and Parienty et al. (11) used 1100-1500 ms with three-dimensional (3D) balanced SSFP. However, whether an optimal BSP TI could help improve renal arterial visibility is unclear.
Maki et al. (12) found the renal artery images with Nav SSFP (a NCE-MRA sequence) depend on breathing rates (BR). Liu et al. (13) found that if the patient's heart rate (HR) is suspected as low, the duration time should be extended. The relationship between BSP TI and BR or HR is still unclear. Furthermore, when BSP TI was related with BR and HR, to our best knowledge, the 95% confidence interval (95% CI) of BR and HR was unreported in the literature. This can assist with rapid selection of an optimal BSP TI and thus improve working efficiency.
Therefore, the purposes of this study were to determine whether an optimal BSP TI can boost arterial visibility and whether the optimal BSP TI is related with BR and HR for hypertension subjects in SLEEK NCE-MRA.
MATERIALS AND METHODS
Patients
This prospective study was approved by the Institutional Review Board. Written informed consent was obtained from all participants prior to examinations. From April 2011 to November 2013, all patients with hypertension suspected of RAS undergoing SLEEK were consecutively recruited in our study. The standard contraindications for MR examinations were applied. All patients underwent CTA or DSA within 1-7 days of MR examinations.
A total of 103 subjects underwent SLEEK for renal artery MRA at 1.5T MRI system including 10 volunteers (3 subjects < 20 years; 4 subjects with ages between 20 and 50 years; and 3 subjects > 50 years), and 93 consecutive hypertension patients (mean age, 45.6 ± 14.6 years [standard deviation]), 44 women (mean age, 43.6 ± 13.0 years) and 49 men (mean age, 47.5 ± 15.8 years).
MR Angiography
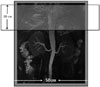
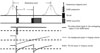
Non-contrast enhanced MRA with SLEEK (respiratory-triggered 3D FatSat FIESTA prepared with multiple spatial selective inversions recovery pulses) was performed with a 1.5T superconductive unit with 33 mT/m amplitude, 80 mT/m/ms slew rate (EXCITE HD, GE Healthcare, Waukesha, WI, USA) using an 8-channel phased-array coil. The acquisition slab was oriented in coronal plane including bilateral kidney and abdominal aorta. Two orthogonal SLEEK bands were geographically localized during scan prescription to image the renal artery dependent on the in-flow effect. One 50-cm width vertical broad SLEEK band covered the whole body to invert all signals within a coil region to -Mz longitudinal magnetization. The other 20-cm width transversal SLEEK band was located superior to the upper pole of kidneys to bring the in-flow artery blood back to +Mz direction. The schematic picture of 2 orthogonal inversion bands localized geographically was shown in Figure 1. For visualization of the kidney anatomy, a T2-weighted half-Fourier acquired single-shot turbo spin-echo sequence in the transverse plane was used. BSP TI was selected to null the inflow blood signal. Adiabatic Spectral Presaturation with Inversion Recovery chemical saturation pulse is applied prior to the data acquisition for fat signal saturation. The diagrams of the pulse sequence and the relative signal change were presented in Figure 2.
Spatial labeling with multiple inversion pulses NCE-MRA, which adopted the same parameters with an exception of BSP TI, was performed 9 times in 10 volunteers, to determine the range of BSP TI values for clear visualization of the main renal artery and renal artery branch. Various BSP TIs from 200 ms to 2600 ms with an interval of 300 ms were applied in SLEEK scan. The total MR data acquisition time of SLEEK was approximately 40 minutes. The scan parameters were as follows: echo time = 2.0 ms, repetition time = 3.9 ms, TI = 200 ms, flip angle = 75°, slab thickness = 2 mm, number of slices = 60, number of segments = 1, field of view = 38 × 30 cm, matrix = 224 × 256, receiver bandwidth = ± 125 kHz, number of excitation = 0.80, sense factor = 2, respiratory interval = 1.
For 93 hypertension patients, 3 various BSP TIs as above for clearly displaying renal artery branch were applied in SLEEK sequence. The other scan parameters were also the same as above in SLEEK scan. The total SLEEK MR data acquisition time was approximate 10-12 minutes. At the same time, the range of BR and the extent of HR were recorded for each patient with SLEEK scan.
Image Analysis
All reconstructive data of SLEEK were transmitted to an imaging workstation (Advantage Workstation 4.4, GE Healthcare, Buc, France) for post-processing. The main methods of imaging processing were maximum intensity projection, multiple plane reconstruction with the same thickness and direction. The evaluations of the images of SLEEK were carried out with a blinded and randomized reading by 2 radiologists (with 5 and 6 year experiences in MR angiography, respectively).
Firstly, the suitable BSP TIs were determined from volunteer scans, which would be applied to patient scans. In 10 volunteers, the image quality of SLEEK series with different BSP TI was evaluated by the consensus of 2 experienced radiologists for each subject. The evaluation factors included signal-to-noise ratio, delineation of renal arteries (main renal artery, segmental branches up to renal parenchyma and vessels within the renal parenchyma) and the interference from venous system. Some BSP TIs corresponding to the better images were determined as suitable BSP TIs.
Secondly, the image quality of SLEEK series with suitable BSP TIs were evaluated by 2 experienced radiologists respectively, to determine the best image according to the criterion described above. Thus, SLEEK was performed by the optimal BSP TI for each patient. In these best images, for visibility analysis of renal arterial display, 3 segments were defined: I, indicated origin to first renal arterial branch; II, from first renal arterial branch to renal parenchyma; and III, arterial branches inside the renal parenchyma. Each arterial segment was rated on a 4-point scale: 3 indicated excellent (homogeneous high signal intensity within vessel lumen, good delineation of vessel border, no artifacts present); 2, good (good enhancement of vessel lumen, incomplete delineation of vessel border, some artifact may be present); 1, fair (inhomogeneous low signal intensity, incomplete delineation of vessel border, diagnosis may be impaired); 0, poor (no or minimal enhancement, non-diagnostic) (17). An image quality score of 2 or 3 was defined as acceptable image quality. The reasons for nonacceptable image quality were assessed, and the patients with nonacceptable image quality were excluded from further analysis. The reviewers visually diagnosed renal artery disease based on the following criteria: 1, normal; 2, RAS; 3, fibromuscular dysplasia (FMD). The degree of RAS was calculated as (1 - [S / R]) × 100%, where S and R are the minimum diameter of stenosis and the maximum diameter of normal vessel located on proximal side of stenosis within 1 cm, respectively. The stenotic degrees were graded separately for SLEEK as follows: grade 1, stenotic degree below 50%; grade 2, 50% to 74%; grade 3, 75% to 99%; grade 4, occlusion. The maximum degree of stenosis was determined as the stage for those patients with FMD (18) as above. The renal artery was also assessed by the consensus of 2 experienced radiologists for CTA and DSA and the degree of renal artery stenoses were determined as above.
Statistical Analysis
The median BR and HR were calculated for each subject. Linear correlation analysis was used to determine the relationship between BR, HR, and BSP TI. Completely random design analysis of variance was used to compare the mean differences between measurement data groups. p < 0.05 was considered as significant difference.
Intraclass correlation coefficient was used to assess agreement between the 2 readers for the qualitative ratings. All statistical analyses were performed with the commercially available software (SPSS for Windows, version 13.0; SPSS Inc., Chicago, IL, USA).
RESULTS
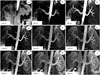
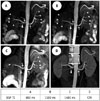
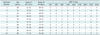
All SLEEK examinations were successfully performed in 10 volunteers. The image quality results of presenting renal artery by SLEEK NCE-MRA were shown in Table 1 for each volunteer and the suitable BSP TIs of visualizing renal arteries were 800 ms, 1100 ms, and 1400 ms (Fig. 3).
For 93 hypertensive patients, 3 SLEEK sequences with various BSP TIs (800 ms, 1100 ms, and 1400 ms as above) were applied on 1.5T MRI. The findings of evaluating image quality were presented by 2 readers in Table 2. In our study, 5 patients were regarded as failure of SLEEK scans and were not evaluated. Two failures were due to the presence of excess ascites and the other 3 were caused by the irregular respiratory motion. The images of a total of 88 subjects were evaluated by 2 radiologists, respectively.
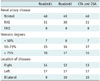
Of 88 subjects with successfully performed SLEEK, 69 patients underwent CTA and 19 subjects DSA. The results of renal artery assessment with SLEEK by 2 radiologists in comparison with CTA and DSA was shown in Table 3. There were 48 subjects with normal renal artery including 1 ectopic kidney patient and 2 solitary pelvic kidney patients, 31 subjects with RAS consisting of 12 left RAS, 11 right RAS and 8 bilateral RAS, and 9 FMD patients (2 right FMD, 5 left FMD, 2 bilateral FMD). Two out of 9 FMDs were renal artery branch FMDs in renal parenchyma. One patient with bilateral RAS (right, grade 3; left, grade 1) on DSA was diagnosed as right RAS (right, grade 3; left, normal) on SLEEK by reader#1. Other patient with right RAS (right: grade 1) on CTA was assessed as normal on SLEEK by reader#2. In addition, the stenosis degrees were overestimated in 2 vessels on SLEEK by reader#1 (CTA, grade 2; SLEEK, grade 3) and one stenosis was overestimated by reader#2 (CTA, grade 2; SLEEK, grade 3).
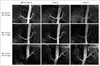
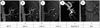
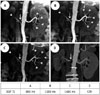
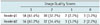
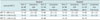
Of 88 successful SLEEK examinations, the negative correlations between BSP TI and BRs and between BSP TI and HRs were found in SLEEK sequence (Fig. 4), whose related coefficients were 0.536 (P1 < 0.001) and 0.432 (P1 = 0.001), respectively for reader#1, and 0.535 (P2 < 0.001) and 0.419 (P2 = 0.001), respectively for reader#2 (κ = 0.93). The 95% CI for BR and HR from completely random design analysis of variance for choosing an optimal BSP TI, were shown in Table 4 for 2 readers, respectively. BR was higher in BSP TI = 800 ms group than BSP TI = 1100 ms and BSP TI = 1400 ms groups, respectively; whereas, the HR was lower in BSP TI = 1400 ms group than BSP TI = 800 ms and 1100 ms groups, respectively. Adopting an optimal BSP TI could be helpful to boost the renal artery visibility in SLEEK NCE-MRA, especially for renal artery branch in renal parenchyma (Figs. 5, 6, 7), even to evaluate renal artery branch disease (Fig. 6).
DISCUSSION
Non-contrast enhanced MRA such as SSFP and IFIR has been previously used to image renal vasculature (56912) . However, the renal artery signal on axial plane was acquired in about 5-6 minutes (59), which was too long to depict arterial segmental branches owing to the motion-related blurring in the distal renal arteries (19). In our study, the SLEEK NCE-MRA sequence was used to delineate renal artery on coronal plane tailored to the kidney shape (17), and the acquisition time was only 2-4 minutes, which could help to improve the renal artery image quality.
Control of breathing could help to keep the patient awake and boost image quality (11). Before SLEEK examinations, the patients received respiratory training to improve the image quality. But in 3 patients, examinations failed due to the irregular respiratory motion, and the motion artifact resulted in low image quality. Besides, in the other 2 patients examinations failed due to the presence of ascites, which appeared as high intensity signal and shaded renal arteries. Shonai et al. (8) reported that the water signal from stomach and duodenum and peritoneal fluid could affect the presentation of renal artery.
With BSP TI increases from 1400 ms to 2600 ms, inferior vena cava (IVC) and renal vein (RV) were more distinctly presented, which obscured the renal artery. The reason could include the following factors: firstly, there was enough time for carrying more blood back to IVC and RV, which helped to clearly show vein dependent on the in-flow effect with rising BSP TI. Secondly, there was more time for labeled blood outflow from renal artery with growing BSP TI, which resulted in unclear display of the renal artery. Thirdly, the hypodense signal of all tissues inverted by the vertical broad SLEEK band became a relatively hyperdense signal due to signal recovered through BSP TI addition, which resulted in obscure visualization of the renal artery. With decreasing BSP TI from 800 ms to 200 ms, visualization of the abdominal aorta and renal artery may be unclear due to the inability of labeled blood to arrive at the region of interest in a relatively short time. So, in SLEEK series, BSP TI of 800-1400 ms was an appropriate range for distinct delineation of the renal artery. A longer or shorter BSP TI could not display renal arteries clearly. Therefore, in our study, 3 SLEEK NCE-MRA sequences with different BSP TI (800 ms, 1100 ms, 1400 ms) were carried out in hypertensive subjects.
In our study with SLEEK, optimal BSP TI and HR or BR were negatively correlated for hypertension subjects, which indicated that a relatively short BSP TI should be adopted in patients with a relatively fast HR and BR. The reason is that when HR is accelerated in the subjects, the arriving time for labeled blood from heart to renal artery level is shortened, which needs a corresponding short BSP TI to match for obtaining high renal artery signal intensity. The research result was in accordance with Liu et al. (13), who reported that the BSP TI should be extended in patients with suspected low cardiac output. For BR, the R-R interval shortens when the patients' breathing rate is fast, which needs a relatively short BSP TI to null the blood signal and ensure more labeled blood flow into the distal branch (2021). At the same time, HR relatively increases with increasing BR and a relatively short BSP TI is applied in NCE-MRA. Shonai et al. (8) reported long ssTI when respiration was slow, as observed in our study.
According to the Table 4, BSP TI of 800 ms was the optimal BSP TI when BR was 17-19/min and HR was 74-83 bpm; BSP TI = 1100 ms, when BR was 14-15/min and HR was 71-76 bpm; and BSP TI = 1400 ms when BR was 13-16/min and HR was 63-70 bpm. In addition, completely random design analysis of variance indicated that higher BR plays a more vital role than HR with 800 ms as the optimal BSP TI; and that lower HR plays a more crucial role than BR with an optimal BSP TI of 1400 ms used in SLEEK. The optimal BSP TI is 1100 ms in subjects with moderate BR and HR.
Therefore, it is easy and convenient to precisely apply an optimal BSP TI in SLEEK according to the above BRs and HRs in individual patients, which can be recorded by respiratory gating and peripheral electrocardiography gating respectively, because it can help to improve the visibility of the renal arterial branches in the renal parenchyma and enables evaluation of the renal artery branch disease, and even to improve working efficiency by avoiding multiple SLEEKs scans with various BSP TI for gaining high quality images. In our study, 2 arterial branch FDMs out of 9 FDMs were displayed by SLEEK and confirmed by DSA, which is unreported in other NCE-MRA literature, to our best knowledge.
There were several limitations in our study. Firstly, SLEEK is not always successful. SLEEK can fail with irregular respiratory motion, so respiratory training is necessary and important for SLEEK. In addition, in our study, SLEEK was performed in a single institution. Multi-institution prospective study with a larger study population is required for using the technique as a screening tool for renal artery disease.
In conclusion, the optimal BSP TIs of visualizing renal artery were 800 ms, 1100 ms, or 1400 ms. BSP TI should be extended in patients with suspected low BR or HR. In SLEEK, rapid determination of an optimal and personalized BSP TI from patients' BR and HR can be helpful to improve the visibility of the renal artery and efficiently evaluate renal artery disease especially for renal artery branch disease in renal parenchyma.
 XML Download