

 PDF
PDF ePub
ePub Citation
 Print
Print


INTRODUCTION
Diffusion and perfusion are important parameters for the assessment of tumors of the head and neck, especially in differential diagnosis, treatment planning, detection of residual tumors after treatment, and prediction of clinical outcome (12345). Previously, the apparent diffusion coefficient (ADC) has been commonly used to assess tumor diffusion. However, a conventional ADC, which assumes that diffusion-weighted signals would decay mono-exponentially with two b values, is influenced by tissue perfusion (16). Dynamic contrast-enhanced magnetic resonance imaging (DCE-MRI) has been used to evaluate the perfusion characteristics of tumors (78). However, the perfusion parameters derived from DCE-MRI are based on the intravenous use of contrast media, which could induce a severe adverse reaction in particular patients, such as those with renal dysfunction or allergies to contrast media.
Intravoxel incoherent motion (IVIM) MR imaging, initially developed by Le Bihan et al. (9), simultaneously assesses both the diffusion and perfusion parameters of tumors by fitting the diffusion-weighted signal intensity of multiple b-value images with a bi-exponential model without the need of contrast media (10). Recently, several studies demonstrated the correlation between parameters from IVIM and those from DCE-MRI in the brain, liver, uterine cervix, and in the head and neck (1112131415). Among these studies, the correlation between IVIM and DCE-MRI parameters in the head and neck was studied either by focusing on nasopharyngeal cancer or using a two-compartment model for DCE-MRI analysis (1415). However, model-based pharmacokinetic DCE-MRI parameters have several challenges, including parameter coupling, measuring the arterial input function, water exchange, model fit instability, and relatively lower reproducibility than the model-free DCE-MRI parameters (1617). To the best of our knowledge, very few studies have assessed the correlation of diffusion and perfusion parameters from IVIM with those from diffusion-weighted imaging (DWI) and model-free DCE-MRI in tumors and normal muscle of the head and neck. In addition, Suh et al. (18) reported that the difference between ADC and D values was significantly associated with the normalized cerebral blood volume value for glioblastoma patients; they speculated that the difference between ADC and D value might reflect perfusion effects. Therefore, we hypothesized that the difference between ADC and D values might be used as a perfusion estimate in the head and neck tumors.
The aim of our study was to investigate the correlation between perfusion and diffusion parameters from IVIM and those from DCE-MRI and DWI in tumors and normal muscle tissues in head and neck region. We determined the potential value of IVIM in non-invasive evaluation of the perfusion and diffusion characteristics of tumors and normal muscles in the head and neck region.
MATERIALS AND METHODS
Study Population
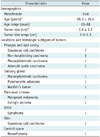
Our retrospective study protocol was reviewed and approved by the Institutional Review Board of our hospital. The requirement for written informed consent was waived due to the retrospective nature of the analysis. A retrospective review of our institution's database identified 28 consecutive patients who had undergone IVIM, DCE-MRI, and DWI studies for pretreatment evaluation of a tumor in the supra-hyoid region of the head and neck, from June 2014 to November 2014. We enrolled patients with supra-hyoid lesions alone because degradation of the image quality by artifacts is significant in the infra-hyoid region. Twenty patients (mean age, 58.3 ± 15.4 years; age rage, 23–88 years) were included in our study based on the following criteria: 1) a pathologically confirmed head and neck tumor; 2) no prior history of chemotherapy or radiation therapy; 3) available IVIM, DCE-MRI, and DWI simultaneously performed before the pathologic examination; and 4) adequate image quality without significant susceptibility artifacts. The causes of patient exclusion were poor image quality from severe motion artifacts (n = 4), no available DWI (n = 2), and MR examination immediately after biopsy procedure that might affect the results of DWI and IVIM (n = 2). The demographics and pathological characteristics of all 20 patients were summarized in Table 1.
MRI Techniques
MR examinations were performed with a 3T MR scanner (Skyra; Siemens Healthcare, Erlangen, Germany) with a 64-channel neurovascular coil. We acquired two different b values (0 and 800 s/mm2) in three orthogonal directions for the DWI scan as routine protocol for preoperative evaluation of head and neck tumors since 2008. The detailed imaging parameters for the DWI were as follows: repetition time (TR)/echo time (TE), 7600/63 ms; flip angle (FA), 90°; number of averages (NSA), 3; field of view (FOV), 24 cm; section thickness, 4 mm; gap, 1 mm; matrix, 128 × 88; and the number of sections, 20. The total acquisition time was 4 minutes 21 seconds.
From June 2014, we acquired 14 different b-values (0, 10, 20, 30, 40, 50, 60, 70, 80, 90, 100, 200, 400, and 800 s/mm2) in three orthogonal directions for IVIM. We used a large number of lower b-values to improve the accuracy of the pseudo-diffusion (D*). The detailed imaging parameters for the IVIM study were as follows: TR/TE, 4000/85 ms; FA, 90°; FOV, 26 × 21.2 cm; section thickness, 4 mm; gap, 0 mm; matrix, 132 × 108; and the number of sections, 25; generalized autocalibrating partially parallel acquisition factor, 2; NSA, 1; bandwidth, 1646 Hz/pixel. The total acquisition time was 3 minutes 58 seconds. Before DWI or IVIM scanning, the patients were instructed not to swallow, move their tongue, or make any other involuntary motion to eliminate motion-related artifacts. Additionally, their heads were also firmly fixed with the coil to avoid involuntary motion during scanning.
Three-dimensional gradient echo data with 20 slices were obtained for the DCE-MRI before, during, and after the administration of a standard dose of 0.1 mmol/kg of gadoterate meglumine (Dotarem; Guerbet, Paris, France) per kilogram of body weight at a rate of 4 mL/s using an MRI compatible power injector (Spectris; Medrad Inc., Pittsburgh, PA, USA). The bolus of contrast material was followed by a 20-mL bolus of saline administered at the same injection rate. The dynamic acquisition was performed with a temporal resolution of 3.9 seconds by using the controlled aliasing in parallel imaging results at higher acceleration with acceleration factor of 2 and partial Fourier sampling (7/8 for phase encoding direction; 6/8 for slice-select direction), and contrast was administrated after 14 baseline dynamics (total: 150 dynamics). The detailed parameters for the DCE-MRI were as follows: slice thickness, 6 mm; no gap; spatial in-plane resolution, 224 × 224; TR/TE, 5.27/2.14 ms; flip angle, 25°; FOV, 18 cm; and the total acquisition time was 9 minutes 47 seconds. The DCE-MRI was performed in an axial plane covering the entire tumor volume. Post-contrast T1-weighted images were obtained after the DCE-MRI in all patients.
Imaging Processing
All MRI data were transferred from a picture archiving and communication system workstation to an independent, personal computer for the IVIM, DCE-MRI, and DWI analyses. The IVIM imaging was reviewed by a neuroradiologist (with 3 years experience) and processed using an in-house, developed plug-in for Image J software (National Institutes of Health, Bethesda, MD, USA; http://rsbweb.nih.gov/ij/). A bi-exponential model was implemented for IVIM fitting. The relationship between signal variation and b values in an IVIM-type sequence can be expressed by the following equation (19):
Sb/S0 = (1 - f) e(-bD) + f e(-bD*),
where Sb is the mean signal intensity with a gradient sensitivity factor b, S0 is the signal intensity without diffusion, and f is the perfusion fraction representing the fraction of incoherent signal from the vascular compartment in each voxel over the total incoherent signal. D is the diffusion parameter representing true molecular diffusion (slow component of diffusion), and D* is the pseudo-diffusion coefficient, which describes macroscopic incoherent motion of blood in the microvasculature compartment (fast component of diffusion). Two different approaches were implemented to generate IVIM parameters: first, initial estimation of D using a reduced set of b-values of > 200 s/mm2, and second, full biexponential fit for f and D* values. In the first step, because D* contribution can be neglected at high b-values (b ≥ 200 s/mm2), D was extracted using high b-values and a monoexponential fit. Subsequently, with the resulting D as a fix parameter, the curve was fitted for f and D* with a nonlinear regression (20).
The regions of interest (ROIs) were drawn on all imaging sections encompassing as much of the tumor area, while visually large necrotic, cystic, and hemorrhagic areas and surrounding blood vessels were excluded. The T2-weighted and contrast-enhanced T1-weighted MR imaging were used as references to determine tumor areas to minimize errors related with ROI placement. The IVIM values obtained from each ROI were averaged. The same method was used to obtain the parameters from IVIM in the normal masseter muscle. This ROI method was also implemented for DWI and DCE-MRI. During the ROI placement, the DWI, IVIM, DCE-MR and contrast-enhanced T1-weighted image were not co-registered. However, we carefully compared each set of images to minimize possible errors due to slice position difference and scan angle. To evaluate the interobserver reproducibility for the measurement of parameters from IVIM, IVIM imaging of the tumor tissue was processed by another dedicated neuroradiologist (with 7 years of experience). To evaluate the intraobserver reproducibility, the IVIM imaging of the tumor tissue were processed again by the first radiologist, spaced by at least 1 month. The ADC was calculated using two b values (b = 0 and 800 s/mm2) with a simple mono-exponential fit.
The DCE-MRI data were processed with AFNI software (AFNI; National Institute of Mental Health, Bethesda, MD, USA, http://afni.nimh.nih.gov/afni) (21). The contrast index was calculated using the formula CI = (signal intensity [post-contrast] - signal intensity [pre-contrast]) / signal intensity (pre-contrast) (20). The time course of CI was then plotted to obtain a time-signal intensity (TSI) curve. We chose a model-free method for evaluation and extracted parameters from the TSI curves to minimize dependence on complex pharmacokinetic modeling and resultant sensitivity to noise (16). The following parameters were derived, including wash-in, Emax, Tmax, AUC60, and whole AUC (AUCw). Wash-in was defined as the maximum slope between the time of onset of contrast inflow and Tmax. The maximum CI (Emax) was considered to represent the maximum amplitude of enhancement, and Tmax was defined as the time at which Emax occurred. The AUC60 was obtained by using a trapezoidal integration of the CI with time over 60 seconds after contrast agent arrival in the enhancing voxels of interest. AUCw was defined as the area under the whole enhancement curve. This approach provides a measurement of the initial arrival of contrast agent in the tissue of interest after intravenous bolus administration, which reflects blood flow, vascular permeability, and the fraction of interstitial space (22).
Statistical Analysis
The numeric data were averaged over all patients and reported as the mean ± standard deviation. The Kolmogorov-Smirnov's test was used to determine whether the parameters from IVIM, DCE-MRI, and DWI were normally distributed. The correlation between diffusion and perfusion parameters from IVIM and those from DWI or DCE-MRI in both tumor and normal muscle was evaluated by Pearson correlation analysis. The significance threshold for difference was set at a p value of < 0.01 (0.05/5) for multiple comparison correction. The intra-class correlation coefficient (ICC) of two-way random model with 95% confidence intervals was used to evaluate the inter- and intra-observer reproducibility. The ICC ranged between 0 and 1.00, and values closer to 1.00 represented better reproducibility. The ICC was interpreted as follows: r < 0.20, poor; r = 0.20–0.40, fair; r = 0.41–0.60, moderate; r = 0.61–0.80, good; r ≥ 0.81, excellent. A p value < 0.05 indicated statistical significance. Statistical analysis was carried out using two software packages (SPSS version 19.0, IBM Corp., Armonk, NY, USA; MedCalc 9.0, Mariakerke, Belgium).
RESULTS
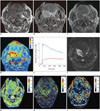
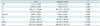
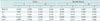
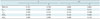
The diffusion and perfusion parameters derived from DWI, IVIM and DCE-MRI were displayed in Table 2. Significant differences were found on the ADC, D, wash-in, Emax, Tmax, AUC60, and AUCw between normal muscles and tumors (p < 0.05), while no significant differences were found on the D* and f value between normal muscles and tumors (p > 0.05). There was no significant correlation between f or D* values and any perfusion parameters from the DCE-MRI (wash-in, Emax, Tmax, AUC60, and AUCw) in either tumors or normal muscles. A subgroup analysis of 8 patients with head and neck squamous cell carcinoma (HNSCC) also revealed no significant correlation between f or D* value and any perfusion parameters from the DCE-MRI in the tumor tissue (p > 0.05). Detailed p values and Pearson correlation coefficients (r) between f or D* values and each of the perfusion parameters from DCE-MRI were displayed in Tables 3 and 4. A representative case was shown in Figure 1.
The mean D values of the tumors and the normal muscles were 0.959 ± 0.393 (× 10-3 mm2/s) and 1.276 ± 0.131 (× 10-3 mm2/s), respectively. The mean ADC values of the tumors and the normal muscles were 1.132 ± 0.385 (× 10-3 mm2/s) and 1.589 ± 0.132 (× 10-3 mm2/s), respectively. D and ADC values showed a strong or moderate positive correlation in both tumors (p < 0.001, r = 0.980) and normal muscles (p = 0.013, r = 0.542), respectively. The mean ADC values were also significantly higher than D values in both tumors and normal muscles (p < 0.05, respectively).
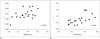
The difference between ADC and D values showed a moderate correlation with the f value in tumors (p = 0.017, r = 0.528) and normal muscles (p = 0.003, r = 0.630) (Fig. 2); however, there was no significant correlation with the difference between ADC and D values and the D* value in tumors (p = 0.147, r = -0.337) and normal muscles (p = 0.601, r = -0.125).
Inter-observer reproducibility regarding the measurements of the D, f, and D* values were excellent with ICCs of 0.974 (95% confidence interval [CI] 0.935–0.990), 0.851 (95% CI 0.662–0.938), and 0.860 (95% CI 0.680–0.942), respectively. Intra-observer reproducibility was also excellent with ICCs of 0.992 (95% CI 0.979–0.997), 0.925 (95% CI 0.822–0.970), and 0.944 (95% CI 0.865–0.978), respectively.
DISCUSSION
Our current study revealed that despite a significant correlation between the D values from IVIM and ADC values, there is no significant correlation between the f or D* values of IVIM and all perfusion parameters from the model-free DCE-MRI. Our study also demonstrated that the difference between ADC and D values has a significant correlation with f values, but not with D* values. Results were consistent in both tumors and normal muscles.
Whether the perfusion parameters from IVIM could be surrogate markers to the established perfusion markers from perfusion MRI in tumor imaging is unclear (1112131415222324). In terms of the head and neck, several studies have investigated the correlation between IVIM and DCE-MRI parameters. In patients with nasopharyngeal cancer, the f value correlates significantly with the maximum slope of increase and enhancement amplitude value from DCE-MRI (14). Furthermore, another study showed significant correlation between perfusion parameters (f and f·D*, respectively) from IVIM and those from DCE-MRI (tumor blood volume and tumor blood flow, respectively) using a two-compartment model in patients with HNSCC (15). In a studies using brain tumor imaging, Kim et al. (23) and Federau et al. (24) proposed a potential association between perfusion parameters from IVIM and those from dynamic susceptibility contrast-MRI, especially between the f value and cerebral blood volume (18). However, some contradictory viewpoints also exist. In the liver perfusion parameters from IVIM do not correlate with those from model-free DCE-MRI (12). Additionally, Bisdas et al. (11) also reported no evident correlation between perfusion parameters from IVIM and DSC- or DCE-MRI in patients with cerebral glioma. Our current results are very similar to these results, emphasizing no significant correlation between perfusion parameters from IVIM and DCE-MRI. Failure to find a correlation could suggest that the perfusion parameters from IVIM and those from model-free DCE-MRI represent different aspects of tumor vessels. DCE-MRI primarily measures microvascular density, while IVIM mainly measures microscopic translational motions associated with microcirculation of blood within randomly distributed capillaries (18). The results were similar in both tumor and normal muscle groups with excellent intra- and inter-observer reproducibility, hence. We suggest that the perfusion parameters from model-free DCE-MRI in the head and neck cannot be replaced by those from IVIM. Further studies that correlate the histological examination with parameters from IVIM or DCE-MRI might be helpful to clarify the relationship of parameters between IVIM and DCE-MRI.
Previous studies have introduced the relationship between ADC and D values, and indicated that the ADC value would be higher than the corresponding D value due to the influence of the perfusion effect of small vessels resulting from using only two b values (125). Our current study results correspond to previous findings and demonstrate that the D value has a significant correlation with the ADC value and is significantly smaller than the ADC value in tumors.
Interestingly, the difference between ADC and D values was significantly correlated with the f value but not with D* value in our study. This result could be explained by sensitivity of D* being to physiological factors such as the cardiac cycle. Previously, Federau et al. (26) indicated that the D* value was significantly larger in systole than diastole, whilst the f value was not. In the current study, we did not perform the IVIM scan with echocardiography triggering, so the D* may have been influenced by different cardiac cycles, and thus cannot accurately reflect the true micro-perfusion effect as f does. Lee et al. (27) also proposed similar viewpoints, and they indicated that echocardiography triggering DWI is more effective for decreasing regional variability of ADC and IVIM parameters than free breathing DWI or respiratory triggering DWI. Echocardiography triggering DWI may improve measurement repeatability by reducing cardiac motion-induced measurement error. Considering that the mean value of D* for head and neck carcinomas in the literature has a wide range of reported values from 15.2 to 143.914 × 10⁻³ mm2/s (1428), further studies on the clinical significance as well as repeatability of D* values are required in the near future.
Our study had several limitations. First, the histologic subtypes of the enrolled cases were heterogeneous including both benign and malignant cases, which could influence the characteristics of the microvascular networks among tumors. To overcome this limitation, we tested the same parameters in normal muscle and could achieve concordant results with those of the tumors, suggestive that heterogeneity in the histologic subtypes might not have influenced our results. Second, the sample size was relatively small. However, our results could be a basis for further, larger prospective studies. Third, IVIM model curve fitting algorithm has limitations of a local optimum or result in infeasible region, mainly due to the wrong initial point or lack of constraints. We tried to reduce those limitations with exact initial point, which was calculated based on the signal between b-value 200 and 800, and constrained optimization algorithm-Guin's modification of the complex method of constrained optimization (29). D* tends to be very sensitive to noise and movement. Through optimized imaging protocol and patient instruction, we tried to improve image quality and eliminate motion-related artifacts. Fourth, although we excluded the data with severe motion artifact from this study, involuntary motion related with the cardiac cycle or vascular pulsation would influence the IVIM imaging measures (26). For example, as Federau et al. (26) concluded in their study, the cardiac cycle can significantly affect D* and result in larger value during systole than diastole, while D and f do not vary significantly. Therefore, the influences from any involuntary motion on the IVIM parameters require further investigation. Fifth, the perfusion and diffusion parameters from IVIM, DWI, and DCE-MRI did not correlate with the histopathological findings such as the microvascular density or the cellular and extracellular space environment. However, the purpose of our study was not to identify a correlation between MR parameters and histopathology but a correlation between the MR parameters themselves. Therefore, the lack of a verification of MR parameters by histopathology is not a major drawback of our study. Further studies are needed to correlate the perfusion and diffusion parameters from IVIM, DWI, and DCE-MRI with histopathological findings.
In conclusion, IVIM imaging is feasible and reproducible in both tumors and normal muscles in the head and neck. The diffusion parameters of IVIM and ADC values are significantly correlated, unlike the perfusion parameters of IVIM and the model-free parameters derived from DCE-MRI. Thus, the perfusion parameters from IVIM cannot be used as surrogate markers for the model-free perfusion parameters from DCE-MRI.
 XML Download