

 PDF
PDF ePub
ePub Citation
 Print
Print


INTRODUCTION
Breast magnetic resonance (MR) imaging screening is currently recommended in addition to mammography for women with breast cancer antigen (BRCA) gene mutation or those with a lifetime risk (20-25% or greater) of breast cancer by the American Cancer Society (1). The sensitivity of breast MR images in cancer detection is the highest among the mainstream imaging modalities such as mammography or ultrasonography (US), ranging from 77% to 94% (23456). Factors contributing to false negative breast MR images include inadequate enhancement of tumors such as invasive lobular carcinoma or ductal carcinoma in situ, inadequate techniques such as contrast infusion failure, motion artifacts, or lesions location beyond the field of view (789). Breast cancers can also be undiagnosed due to misperception or misinterpretation (10).
In the field of screening mammography, computer-aided detection (CAD) has shown the potential to reduce the number of false-negative diagnoses with reports of the mammographic CAD system correctly marking 65-77% of missed malignancies on prior mammograms (1112). However, to the best of our knowledge, the role of computer-aided evaluation (CAE) for the false-negative diagnosis of breast cancers on MR images has not yet been investigated. Earlier studies have focused on the differentiation between benign and malignant findings or the reduction of false positive findings on breast MR images through kinetic feature assessment of MR-CAE (1314). However, a recent study on false-negative MR images reported that the rapid uptake of a lesion on prior MR images or changes in kinetic patterns from a slow to rapid uptake was a suspicious feature that may be suggestive of early cancer (15). Thus, we hypothesized that kinetic feature assessment using MR-CAE would improve the interpretation of enhancing findings on prior negatively reported MR images that were subsequently diagnosed as cancers.
For the past decade, our institution has used a dynamic contrast enhanced (DCE)-MR image protocol for preoperative and screening MR examinations. We were able to identify prior negatively reported but subsequently cancer diagnosed MR images that were technically adequate for MR-CAE. Therefore, the purpose of this study was to retrospectively evaluate the features of undiagnosed breast cancers on prior negatively reported breast MR images and to assess the potential utility of MR-CAE.
MATERIALS AND METHODS
Subject Population
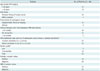
The Institutional Review Board approved this study, and the requirement for informed consent was waived. A search of our radiological database revealed that 9088 consecutive preoperative MR examinations between March 2004 and May 2013 and 2379 consecutive screening breast MR examinations in 1156 women between March 2008 and May 2013 were performed in our institution. Among them, 72 pairs of breast MR images of 72 patients, including both prior MR images without a diagnosis of cancer, as well as subsequent MR images that led to a cancer diagnosis, were found (median interval, 32.8 months; range, 5.4-104.6 months). Interval between prior and subsequent MR was ≤ 24 months in 28 cases, from 25-48 months in 24 cases, and ≥ 49 months in 20 cases. Thirty-eight % (28 of 72) of prior negatively reported breast MR images were from contralateral breast screening during preoperative MR examinations and 62% (44 of 72) were from screening examinations for high risk women. Two radiologists (with 15 years of experience and with 3 years of experience in interpreting breast MR images) reviewed the 72 pairs of MR images in consensus, with the information of medical records regarding image-guided needle localization, surgical procedure, and final surgical histopathology to determine whether the subsequently detected cancers were visible on prior MR images. Of the 72 areas of prior MR images where cancer later developed, 36 (50%) of prior MR images in 36 women (median age, 46 years; range, 28-67 years) had visible findings and they were finally included in the analysis (Table 1).
Histopathologic information was obtained from electronic medical records. Tumors were classified as estrogen receptor positive if > 10% of the cells were stained positively. The staining of c-erbB-2 was scored as 0, 1+, 2+, or 3+. Tumors with a 3+ score were classified as human epidermal growth receptor-2 (HER-2) positive, and tumors with a 0 or 1+ score were classified as negative. For tumors with a 2+ score, gene amplification using fluorescence in situ hybridization was performed and the ratios of HER-2 gene copies to the centromeric region of chromosome 17 ratios of ≥ 2.2 were interpreted as positive.
MR Imaging Technique and Interpretation in Clinical Practice
Between January 2004 and December 2006, MR examinations were performed using a 1.5T system (Sonata, Siemens Medical Systems, Erlangen, Germany) and a dedicated double-breast coil. DCE-MR images of the unilateral sagittal plane were obtained with 1 pre-contrast and 4 post-contrast series, using a T1-weighted three-dimensional (3D) fast low-angle shot sequence with fat suppression in a sagittal plane (repetition time [TR]/echo time [TE], 4.9 ms/1.8 ms; matrix, 224 × 448; flip angle, 12°; field of view, 170 mm; section thickness, 1.0 mm; no gap). Between January 2007 and May 2013, the MR examinations were performed using a 1.5T system (Signa; General Electric Medical Systems, Milwaukee, WI, USA) and a dedicated phased-array breast coil (8-channel HD breast array, General Electric Medical Systems). Each examination included bilateral sagittal plane, fat-suppressed T2-weighted fast spin-echo images (TR/TE, variable from 5500 to 7150/82; matrix, 256 × 160; field of view, 200 × 200 mm; slice thickness, 1.5-mm; no gap), and DCE-MR images. The DCE-MR images were obtained with 1 pre-contrast and 5 post-contrast series, using a fat-suppressed T1-weighted 3D fast spoiled gradient echo sequence (TR/TE, 6.5 ms/2.5 ms; matrix, 256 × 160; flip angle, 10°; field of view, 200 × 200 mm; slice thickness, 1.5-mm; no gap). Gadobutrol (Gadovist, Bayer Healthcare, Berlin, Germany) at a dose of 0.1 mmol/kg was injected into an ante-cubital vein using an automated injector (Spectris MR, Medrad Europe, Maastricht, the Netherlands) at a rate of 2 mL/sec, followed by 20-mL of saline flush. The interval between the start of the contrast injection and the acquisition of the first post-contrast series was 15 seconds. The acquisition time of each post-contrast series was 76 seconds. Five post-contrast image series were obtained at 91, 180, 360, 449, and 598 seconds after the start of the contrast injection. For all of the MR examinations, early subtraction, axial reformatted images, and maximum intensity projection images were generated. The lesion kinetic features were visually assessed by the whole series of DCE-MR images and a region of interest (ROI) was manually placed for the plotting of signal intensity using a Picture Archiving and Communication System (PACS) workstation. MR-CAE was not routinely used for the initial clinical interpretation.
Blinded and Unblinded Review for Visible Findings on Prior MR Images
Five radiologists who had not originally interpreted the MR images participated as readers to classify the 36 visible findings on prior MR images as the actionable or the underthreshold group. The readers were fellowship-trained and had an average of 4.3 years of experience (range, 2-8 years) in interpreting MR examinations. All readers were blinded to the original MR reports, clinical and histopathological findings, as well as the proportions of benign and malignant cases. However, they were made aware of the image number and the location of the lesions because the purpose of this blinded review was not to evaluate detection ability but to determine the actionability of visible findings. Thirty-six prior MR images with malignant visible findings were randomly mixed with 65 control MR images with benign findings, which had been detected at the time of screening MR images and had been confirmed as benign histology using surgical excision or MR-guided vacuum-assisted biopsy. The benign lesions included fibrocystic change (n = 19), fibroadenoma (n = 16), intraductal papilloma (n = 14), florid ductal epithelial hyperplasia (n = 6), sclerosing adenosis (n = 4), nodular adenosis (n = 2), columnar cell change (n = 2), adenosis (n = 1), and ductectasia (n = 1). There was no difference in the mean lesion size between 65 benign lesions and 36 malignant lesions (1.17 ± 0.73 cm vs. 0.94 ± 0.80 cm, p = 0.170) on MRI. Non-mass enhancements were more frequently found in malignant lesions than benign lesions (52.7% [19/36] vs. 16.9% [11/65], p < 0.001). The readers were asked to classify the Breast Imaging Reporting and Data System (BI-RADS) final assessment category for the 101 lesions using the PACS workstation (16). The use of BI-RADS category 0 was discouraged. Of the 36 visible findings on prior MR images, lesions classified as BI-RADS category 4 or 5 by ≥ 3 of the 5 radiologists were determined to be actionable. Lesions classified as BI-RADS category 4 or 5 by ≤ 2 of the 5 radiologists were determined as underthreshold.
Additionally, 2 radiologists who did not participate in the blinded review analyzed the lesion size, imaging findings, and level of background parenchymal enhancement (BPE) according to the BI-RADS Atlas (16). Lesion size was defined as the largest diameter of the enhancing lesion on the early phase of DCE-MR images. The likely reasons for the undiagnosed cancers were classified as follows: 1) mimicking of physiologic enhancement,2) mimicking of postoperative change, 3) multiple distracting lesions, 4) mismanagement, 5) mimicking of a lymph node, or 6) small lesion size (≤ 5 mm). When ≥ 2 reasons were involved in a case, the most influential reason was selected.
Computer-Aided Evaluation
A commercially available CAE program (CADSTREAM version 4.1.3, Confirma, Inc., Kirkland, WA, USA) was retrospectively applied to the prior MR images with visible findings. The CAE program incorporated the pre-contrast, the early first post-contrast (obtained 91 seconds after the contrast injection), and the last post-contrast (obtained 598 seconds after the contrast injection) T1-weighted images and subsequently calculated the pixel signal intensity. When an enhancing lesion increased the signal intensity by > 50% at the first post-contrast series, as compared to the pre-contrast series, it was coded as a color overlay map. The initial phase was classified as the slow (< 50% increase), medium (50-100%), or rapid (> 100% increase) enhancement, and the delayed phase was classified as persistent, plateau, or washout. Depending on the pixel signal intensity on the delayed post-contrast series compared to the first post-contrast series, the persistent type was defined as an increased signal intensity of ≥ 10%, displayed as blue. The plateau type defined as an increased signal intensity of < 10% and a decreased signal intensity of < 10%, was displayed as yellow. The washout type was defined as a decreased signal intensity of ≥ 10%, which was displayed as red. The most suspicious (washout > plateau > persistent) kinetic feature in an enhancing lesion was defined as its kinetic pattern, as previously suggested (14).
Statistical Analysis
The lesion size, MR imaging features, and CAE features between the actionable and underthreshold groups were compared using Student's t test or Fisher's exact test. SPSS version 19 (SPSS Inc., Chicago, IL, USA) was used for all statistical analyses. Two-tailed p values of < 0.05 were considered to be statistically significant.
RESULTS
Of the 36 women, 32 women had personal histories of breast cancer and 4 women were carriers of BRCA mutation (Table 1). Thirty-three subsequent cancers (91.7%, 33 of 36) were detected during screening mammography (n = 4), screening US (n = 17), or screening MR examination (n = 12), and 3 cancers (8.3%, 3 of 36) were detected by palpable symptoms before the next scheduled screening round (interval cancers). Twenty-five cases (69.4%, 25 of 36) were invasive carcinomas, and the other 11 cases (30.6%, 11 of 36) were ductal carcinomas in situ. The median interval between prior and subsequent MR examinations was 17.7 months (range, 5.4-92.6 months).
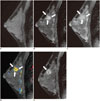
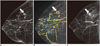
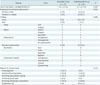
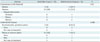
Of the 36 visible findings, 33.3% (12 of 36) were determined to be actionable and 66.7% (24 of 36) were underthreshold findings (Table 2). The mean lesion size of actionable lesions was larger than that of underthreshold lesions (1.4 ± 1.2 cm vs. 0.7 ± 0.3 cm, p = 0.019). Minimal or mild BPE tended to be more frequently associated with the actionable lesions than moderate or marked BPE (75.0% [9 of 12] vs. 33.3% [8 of 24], p = 0.033). No focus lesions (0 of 10) were in the actionable group, whereas 85.7% (6 of 7) of masses and 31.6% (6 of 19) of non-mass enhancements were in the actionable group (p = 0.005). Mass descriptors of spiculated margin (n = 2), rim enhancement (n = 2), and non-mass enhancement descriptors of segmental distribution (n = 1), regional distribution (n = 1), and clustered ring enhancement (n = 1) were only found in the actionable group. The reasons for undiagnosed cancers commonly included mimicking physiologic enhancement (27.8%, 10 of 36) (Fig. 1), small lesion size (27.8%, 10 of 36), mimicking postoperative change (19.4%, 7 of 36), and multiple distracting lesions (16.7%, 6 of 36) (Fig. 2).
MR-CAE was available for 25 prior MR images, which included 10 actionable and 15 underthreshold lesions (Table 3). At a 50% enhancement threshold level of CAE, 84% (21 of 25) of the lesions displayed color coding and 68% (17 of 25) of the lesions showed a washout or plateau component. All 4 lesions not displaying color coding at a 50% threshold level were underthreshold group and their lesion size ranged from 0.4 cm to 0.7 cm on MR images. The actionable findings tended to show more washout or plateau kinetic patterns than the underthreshold findings, as the 100% (10 of 10) of actionable findings and 46.7% (7 of 15) of underthreshold findings showed washout or plateau kinetic patterns on MR-CAE (p = 0.008) (Figs. 1, 2). Five actionable masses were undiagnosed due to mismanagement (n = 2), multiple distracting lesions (n = 2), and mimicking physiologic enhancement (n = 1). Five actionable non-mass enhancement lesions were undiagnosed due to mimicking physiologic enhancement (n = 2), mimicking postoperative change (n = 2), and mimicking a lymph node (n = 1).
DISCUSSION
Our review of prior negative screening breast MR images in subsequently diagnosed breast cancer patients showed that 27.8% (10 of 36) of the lesions were not diagnosed because of mimicking physiologic enhancements, 27.8% (10 of 36) of the lesions were not diagnosed because of small lesion size, and actionable findings tended to show more washout or plateau kinetic patterns on MR-CAE than underthreshold findings (100% vs. 46.7%, p = 0.008). Our results were consistent with those of previous studies in which small lesion size, extensive BPE, benign appearance, or mimicking post-operative scars were common reasons for false-negative diagnoses, although there were evident enhancing findings on prior MR images (910).
Our study differed from these previous studies in the analyses of findings on prior MR images for actionability. Understanding the features of actionable findings that were prospectively overlooked can help radiologists reduce the false-negative diagnoses of screening MR images in real clinical practice. With regard to the actionable group, the mass lesion (85.7%, 6 of 7) was observed more frequently than the non-mass enhancement (31.6%, 6 of 19) or focus type (0%, 0 of 10) lesions (p = 0.005). Notably, spiculated margin (n = 2), rim enhancement (n = 2), segmental distribution (n = 1), regional distribution (n = 1), or clustered ring enhancement (n = 1) noted in the actionable group were previously well-known terms for suspicious findings with high positive predictive values (17). The reason for lack of prospective detection of actionable findings despite presentation with previously well-known suspicious findings, may be attributed to the insufficient conspicuity of the lesion or the subtle differences in the signal intensity of lesions from the adjacent background parenchyma. Indeed, the primary reasons for the undiagnosed actionable findings in our study were mimicking physiologic enhancements (33.3%, 4 of 12) or multiple distracting lesions (25.0%, 3 of 12). Increased mammographic density is associated with decreased diagnostic accuracy of breast cancer detection; likewise, greater BPE may limit MR imaging interpretation. Despite no difference in the cancer yield, sensitivity or specificity between the greater and less BPE groups (18), recent studies reported that moderate or marked BPE led to more abnormal interpretations or biopsies (1819), which indicated reduced reader confidence. In our study, moderate or marked BPE tended to be more frequently associated with underthreshold lesions than minimal or mild BPE. Thus, the role of MR-CAE for the detection of suspicious kinetic features from the adjacent background parenchyma may be promising.
In our study, we found that 84% (21 of 25) of enhancing lesions displayed color coding and actionable findings tended to show more washout or plateau kinetic patterns than underthreshold findings. Although a recent multi-institutional study reported that the addition of MR-CAE did not achieve a statistically significant improvement in overall accuracy in the interpretation of MR images (20), MR-CAE reportedly improves the detection of the delayed washout component for the entire tumor pixels (21). Moreover, the washout kinetic pattern on DCE-MR image was not the only significantly different MR-CAE feature between the benign and malignant lesions in a study by Wang et al. (14); it was also correlated with a high histologic grade, high Ki-67 expression and increased vascular permeability (2223). The visual assessment or manual placement of ROIs for kinetic feature measurement in daily practice has a limitation in the discrimination of subtle suspicious features for entire tumors. Thus, when a washout or plateau component is displayed on an enhancing lesion, careful attention is required to rule out the likelihood of early cancer.
With regard to the lesion type and MR-CAE, controversy remains whether MR-CAE is helpful for the non-mass enhancements, as well as mass lesions, although some studies have reported that MR-CAE is helpful in differentiation of benign and malignant non-mass enhancements, as well as mass lesions (2124). In our study, 5 actionable non-mass enhancement lesions were undiagnosed due to mimicking physiologic enhancement (n = 2), mimicking postoperative change (n = 2), and mimicking a lymph node (n = 1). We believe that MR-CAE has potential to reduce false negative diagnosis for non-mass enhancement lesions that were misperceived as physiologic enhancement or postoperative change.
In the underthreshold group, 10 foci, 1 mass, and 13 non-mass enhancement lesions had a mean lesion size smaller than that of the actionable group (0.7 ± 0.3 cm vs. 1.4 ± 1.2 cm, p = 0.019). It is generally suggested that malignant foci < 5 mm can be missed on MR images because of insufficient angiogenesis or partial volume effects, which might be inevitable (1025). Undiagnosed cancers due to mimicking postoperative change, was similar to the earlier study in which the previous lumpectomy was one of the primary causes of misinterpretation of a malignant enhancement (10). Although MR imaging is believed to be helpful in distinguishing scar from a recurrent tumor (2627), 71.4% (5 of 7) of the lesions mimicking postoperative change in our study were underthreshold.
Our study had several limitations. First, the sample size was possibly too small to draw a solid conclusion. Second, we used 1 commercially available MR-CAE program. Various types of MR-CAE program, threshold level of kinetic feature assessment, and MR protocols could have affected the results. Third, we included malignant cases, which were missed at prior MRI and benign cases, which were biopsied due to a suspicious feature at MRI. Thus, our results cannot be generalized to all lesions considered for biopsy decision in clinical practice. Fourth, 13.9% of our study population showed ≥ 49 month interval between prior and subsequent MR examinations. Thus, although experienced radiologists confirmed their correspondence on both images, there might be a possibility of mismatched cases between prior and subsequent images. Fifth, our observation of more frequent washout or plateau components of enhancements on prior MR images in the actionable group do not directly translate to decreased false negative diagnoses; this is because cancers that show washout or plateau components on MR-CAE might be obscured by BPE containing multiple enhancing foci with plateau or washout components. Moreover, if radiologists interpret all lesions with washout component as suspicious, it will also lead to increased false positive rate.
In conclusion, MR-CAE has the potential for reducing actionable, overlooked findings because more plateau or washout delayed enhancement patterns were found for actionable findings than for underthreshold findings, which can improve lesion conspicuity in cases showing greater BPE or multiple distracting lesions.
 XML Download