

 PDF
PDF ePub
ePub Citation
 Print
Print


INTRODUCTION
A variety of conditions including cirrhosis, neoplastic diseases, infection, intra-abdominal inflammatory diseases, myeloproliferative disorders, and hypercoagulable states could result in portal vein thrombosis (PVT) (1). In some autopsy reviews, the overall incidence of PVT ranges from 0.05% to 1% (12). Cirrhosis is the most common cause of benign PVT in adults and is present in 24% to 32% of the patients with PVT, while the incidence of PVT is also increased in the patients with primary or secondary malignancies (2345). Patients with cirrhosis or neoplastic diseases may develop either benign or malignant PVT; moreover, benign and malignant thrombi can be coexistent (36). For the patients in the neoplastic condition, the presence of malignant PVT is an important factor during the tumor staging, in addition to determining the proper therapeutic approach and their prognosis (6789).
Until recently, imaging differentiation of the benign from malignant PVT has depended on the finding of contrast enhancement and luminal expansion on CT or MRI (51011121314). In a recent study, Catalano et al. (15) suggested that diffusion-weighted MRI (DWI) enabled discrimination of bland and neoplastic portal vein thrombi by a clear-cut difference of apparent diffusion coefficient (ADC). With the technical development of high-performance magnet and parallel imaging with multi-channel surface coil, DWI has been generalized for the body imaging in the past few years. By the difference of Brownian motion of water molecules in different tissues, many investigators reported the usefulness of DWI to differentiate benign from malignant hepatic lesions (16171819202122). Depending on our experience of daily practice, however, it was not always easy to distinguish tumorous from bland thrombus, which also can restrict the molecular motion on DWI. In the present study, we tried to validate the DWI again in the differentiation between benign and malignant PVT.
MATERIALS AND METHODS
Patients
Our Institutional Review Board approved this retrospective study and did not require informed consent for patient data review. The selection process included a review of the radiology database, including the official reports (for the words "portal vein thrombosis", "thrombosis", and "thrombus") of image interpretation in our picture archiving and communication systems (PACS) for gadoxetic acid-enhanced liver MRI, including DWIs, by a study coordinator and a radiologist with a 16-years of experience in abdominal imaging. Total 67 patients had PVT, regardless of the nature of the thrombus, during a 5 year period from October 2008 to October 2013. From this initial group of 67 patients, first we excluded 6 patients with a malignancy other than hepatocellular carcinoma (HCC; gallbladder cancer, n = 2; gastric cancer, n = 2; intrahepatic cholangiocarcinoma, n = 1; unknown primary cancer, n = 1). Thereafter, we excluded 2 patients with thrombosis in the superior mesenteric vein without PVT on MRI. Therefore, 59 patients, 52 men (average age, 60.3 years; range, 43–85 years) and 7 women (average age, 59.9 years; range, 40–72 years) with an overall average age of 60.2 years (range, 40–85 years) were finally enrolled in our study. Forty-five of 59 patients had liver cirrhosis, and 47 of those had HCCs. At the time of MRI, the Child-Pugh classification of each group of patients was as follows: class A, n = 34; class B, n = 10; class C, n = 1. HCCs were established in 47 patients, based on pathologic results of operation in 3 patients and non-invasive diagnostic criteria of European Association for the Study of the Liver guidelines for the other patients (23).
Reference Standard for Characterization of Portal Vein Thrombosis
Two abdominal radiologists with 8- and 5-years of experience in abdominal MRI described the location of thrombi and categorized the thrombi as bland or malignant on the basis of known published criteria independently and were in agreement with each other. The main feature used to differentiate tumor thrombus from bland thrombus was the presence or absence of enhancement. Enhancement of PVT was considered present at contrast-enhanced MRI when obvious enhancement was observed on subtraction images. Vessel expansion by thrombus was one of the diagnostic criteria suggestive of malignant thrombus, but it can be seen in both bland and malignant thrombi (1124). Hence, we did not use vessel expansion as the criteria. In the cases of benign PVT without HCC, thrombi were resolved, decreased in size, or had no change without any treatment on follow-up imaging. The cases of mixed malignant and bland thrombus within the same vessel were recorded as malignant thrombus. On the other hand, cases of bland thrombus located at the separate vessels were recorded as individual benign thrombi.
MR Imaging Technique
MRI was performed using a 1.5-T system (Magnetom Avanto; Siemens, Erlangen, Germany) equipped with high performance gradients (maximum amplitude 45 mT/m) and a six-element phased-array surface coil. After obtaining localizer images in the supine position, spectrally fat-suppressed breath-hold T2-weighted turbo spin echo images (repetition time [TR] = 3020 ms, echo time [TE] = 109 ms, flip angle = 150°, echo train length = 13, slice thickness = 6 mm) or half-Fourier single-shot turbo spin-echo images (TR = infinite, TE = 85 ms, slice thickness = 6–8 mm) were obtained on the axial plane. After obtaining a double-echo chemical shift gradient-echo sequence (TR = 100 ms, first-echo TE = 2.0 ms [opposed-phase], second-echo TE = 4.2 ms [in-phase], flip angle = 70°), contrast-enhanced imaging was obtained using a three-dimensional gradient echo sequence (VIBE; Siemens, Erlangen, Germany) with ultrafast image reconstruction by parallel imaging algorithms (GRAPPA factor = 2) on the axial plane (TR = 4.4 ms, TE = 2.1 ms, flip angle = 10°, matrix = 448 × 224, field of view = 271 × 379 mm, slice thickness = 5 mm, slice spacing = 2.5 mm, slices = 72) during a 20-second breath-holding period. A dynamic series consisted of one pre-contrast series followed by three successive post-contrast series, including early arterial, late arterial and portal phase imaging with 34-second intervals (20 seconds for image acquisition with breath-holding and 14 seconds for re-breathing) for the start of each phase imaging. To determine the time delay for early arterial phase imaging, a timing examination was performed according to the previously described method (25). The postcontrast series was performed after administering a bolus injection of gadoxetic acid disodium (0.1 mL/kg) (Primovist; Bayer Healthcare, Berlin, Germany) at a rate of 2 mL/s followed by a saline flush using a power injector. Five and 20 minutes after contrast material injection, delayed phase and hepatobiliary phase images were added using the same VIBE technique, respectively.
Approximately 7 minutes after injection of the contrast agent, respiratory-triggered DWI sequences were performed with the single-shot spin-echo echo planar imaging sequence with motion probing gradients in three directions. For monitoring respiration, the prospective acquisition correction technique, in which the diaphragmatic position is assessed periodically by navigator echoes, was implemented. These sequences used two b factors: 50 and 800 s/mm2. The other technical parameters were as follows: TR = 3900 ms, TE = 75 ms, matrix = 156 × 192, average = 6, slices = 52 (26 slices for each b factor), thickness = 6 mm with interslice gap 30%, and bandwidth = 1735 Hz/pixel. ADC maps corresponding to each slice were automatically acquired using all b factors. All scans were sent to the PACS.
Image Analysis
Quantitative analysis was performed by two other abdominal radiologists with 3- and 17-years of experience in abdominal MRI, who were unaware of the bland or neoplastic nature of the thrombus and had no access to the other sequences and images. They had provided information about the location of thrombosis from other two reviewers who had categorized the thrombi as bland or malignant. Each reader drew oval regions of interest in thrombi as large as possible, which included at least two-thirds of the area of the PVT, at a workstation (Centricity 2.0, GE Healthcare, Chicago, IL, USA) to measure the ADC of each thrombus on ADC map. ADC values obtained from the two readers were then averaged, and the mean ADC value was used for quantitative analysis.
Statistical Analysis
Mean ADCs of benign and malignant PVTs were compared by using Mann-Whitney U test. A p value < 0.05 was considered to indicate a statistically significant difference. Diagnostic accuracy was evaluated using receiver operating characteristic (ROC) curve analysis with a calculation of the area under the ROC curve. Statistical analyses were performed with SPSS version 16.0 for Windows (SPSS Inc., Chicago, IL, USA).
RESULTS
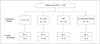
There were 18 bland thrombi and 49 malignant thrombi in 59 patients, including 8 patients with simultaneous benign and malignant PVT. All malignant thrombi were combined with hepatocellular carcinoma (Fig. 1).
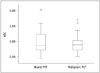
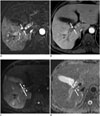
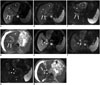
The mean ADC ± standard deviation of bland and malignant PVT were 1.00 ± 0.39 × 10⁻³ mm2/sec (range, 0.45–2.01 × 10⁻³ mm2/sec) and 0.92 ± 0.25 × 10⁻³ mm2/sec (range, 0.52–1.69 × 10⁻³ mm2/sec), respectively (Fig. 2). There was no significant difference between bland and malignant thrombus (p = 0.799). Some chronic bland thrombi show dark central region surrounded by a brighter region on ADC map (Fig. 3). In 6 of 8 patients who had both benign and malignant PVT, tumor thrombus showed rather higher ADC value than benign thrombus (Fig. 4).
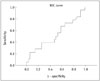
The mean area under ROC curve for ADC was 0.520 (Fig. 5). Based on the ROC curve, we determined that the best cut-off value for differentiating bland and malignant PVT was 1.35 × 10⁻³ mm2/sec. With ADCs greater than 1.35 × 10⁻³ mm2/sec, the sensitivity and specificity of the diagnosis of bland PVT were 22.2% (95% confidence interval [CI]: 6.4–47.6%) and 94.6% (95% CI: 84.9–98.9%), respectively.
DISCUSSION
Tumor thrombus in the portal vein is an important complication and a prognostic factor in the patients with hepatocellular carcinoma (72627). The reference standard for evaluating PVT is histopathologic examination. However, in clinical practice, imaging diagnosis has replaced open laparotomy or percutaneous biopsy for characterizing PVT. The Doppler ultrasonography (US), contrast-enhanced US, contrast-enhanced CT, and contrast-enhanced MRI have been proven to be suitable modalities for differentiation, and several imaging characteristics of malignant PVT have been reported. Intrathrombus neovascularity, venous expansion, and direct invasion of the portal vein are independently diagnostic of malignant PVT on CT and MRI (51011121314). Moreover, PVT continuous with parenchymal hepatocellular carcinoma and generalized enhancement of a PVT, strongly suggests malignant PVT on these sectional imaging studies. However, application of these criteria is limited in some patients with poor renal function or history of previous reaction to contrast material.
There have been many investigations for the benefits of DWI in differentiating benign from malignant hepatic lesions. ADCs for malignant hepatic lesions were significantly lower than that for benign hepatic lesions with good sensitivity, specificity, and accuracy, though cut-off values for ADC varied considerably (2829). In a recent study by Catalano et al. (15), the mean ADC of 6 bland thrombi was significantly higher (approximated to free fluid) than that of malignant thrombi, and the authors concluded that DWI could provide supportive information for discriminating between them in the same context. In our study, however, the mean ADCs of bland and malignant thrombi were rather similar to each other (the area of under the ROC curve was 0.520), and could not be differentiated from each other using the best cut-off value. In this situation, DWI could not add any information to the pre-established criteria, which were commonly used as reference standards for the diagnosis of benign and malignant PVT, in the previous studies including ours and that of Catalano et al. (15).
The signal intensities of blood clot were affected by T2 shine-through or T2 black-out effects resulting in various signal intensities on DWI, depending on the age of the hemorrhage in the several investigations dealing with intracranial hemorrhage (303132). For ADCs, however, most hematomas tended to show low ADCs in their studies (303132). Decreased ADC in hyperacute hematoma is referable to high viscosity related to shrinkage of extracellular space. On the acute and early subacute stages of hematoma, a magnetic susceptibility effects, which is caused by paramagnetic intracellular deoxyhemoglobin in acute hematoma and paramagnetic intracellular methemoglobin in early subacute hematoma, led to a drop in ADC (333435). At the late subacute stage of hematoma, high viscosity caused by extracellular distribution of intracellular contents and high cellularity resulting from the infiltration of inflammatory cells and macrophages, lead to low ADC (3036). For these reasons, bland PVT might have low ADC like malignant PVT, as in the present study. As a reply to an argument by Yu et al. (37) for this issue, Catalano et al. (15) suggested difference in the clotting process between the intracranial closed space and intravascular space with flowing blood. Despite their suggestion, it is still difficult to explain the discrepancy between our results and those reported by Catalano et al. (15). Only one exceptional situation that could show such high ADC is mostly in liquefied hematoma in a closed space allowing free molecular motion in the lesion (30). Such condition seems unlikely in the vascular lumen with flowing blood, but we guess it may be possible in some limited cases consisting of the inner liquefied component surrounded by fibrotic wall in the old intravascular hematoma. Some chronic bland thrombi show low ADC value at central portion with high ADC value at peripheral region on ADC map. The DWI of these thrombi was the inverse of the ADC map. Peripheral high ADC might represent the area of increased blood flow by the formation of perivascular collateral vessels around the thrombi. In these cases, surrounding high ADC value can influence on ADC value of bland thrombi depending on the ROI localization.
Our study had several limitations. First of all, pathologic correlation was not confirmed in every patient due to the retrospective nature of this study. We mainly established the nature of the PVT based on the findings of enhanced CT or MRI. But, the characterizing of PVT was clear on follow-up imaging studies, particularly in the cases of bland PVT. Our primary scope of this study was to verify or to make an argument on the conclusion of previous DWI study for PVT with the use of similar study design. Although the number of patients was larger than the previous study, the sample size was still limited for confirmed conclusions. For this reason, individual analysis on age-related changes of ADC value in thrombus was impossible. Further study is expected with larger population dealing with the ADCs of PVT combined with histological proof. Lastly, regarding a topic of imaging differentiation of the thrombus nature by DWI, the negative results of this study would have limited impacts except the rebuttal of a previous study (15).
In conclusion, due to the wide range and considerable overlap of the ADCs, DWI hardly differentiated the benign from malignant PVT in this study. Bland PVT is a benign condition; however, according to its nature of diffusion restriction during the clotting process, the low ADC value, the common feature of benign and malignant PVT on DWI, has very limited value in the characterization of PVT during the clinical practice.
 XML Download