

 PDF
PDF ePub
ePub Citation
 Print
Print


INTRODUCTION
Breast cancer is the second most common malignancy among Korean women next to thyroid cancer, and the age-standardized incidence of breast cancer is 65.7 per 100000 women, accounting for 14.8% of female malignancies in 2012 (1).
Since 1999, the National Cancer Screening Program (NCSP) in Korea has recommended biannual screening mammograms for women aged 40 years and older (2). Since 2005, the target population who received free-of-charge screening service included not only medical aid recipients but also the National Health Insurance (NHI) beneficiaries in the lower half of the income stratum. The other half can also receive screening services with 10% payment of the cost. Therefore, the rates of breast cancer screening in Korea showed a significant increase from 2004 to 2012, with an annual increase of 4.5%, and the current screening rates are approaching 70.0% (3). However, the cost-effectiveness of the NCSP for breast cancer was suboptimal compared with the gross domestic product, although the report was from the early period of the NCSP, namely from 2002 to 2003 (4).
To the best of our knowledge, there have been only two reports concerning the diagnostic accuracy of mammography in the NCSP; one described the results from an early period (2002–2006) of the NCSP, but was not published, while the other described the results from a single institution for a 1-year of period (2006) (5). Although there could be various factors affecting diagnostic accuracy, including readers, equipment, examinees, and heath care systems, we must first know where we are, that is, what is the overall performance of mammography in the NCSP. Thus, we analyzed and reported the diagnostic accuracy and trend in screening mammography in Korea for the first time. The analysis of various factors affecting diagnostic accuracy in mammography screening will be the subject of separate reports.
MATERIALS AND METHODS
This study was conducted with the approval of the Institutional Review Board (IRB) of all participating hospitals, and informed consent was waived for each examinee.
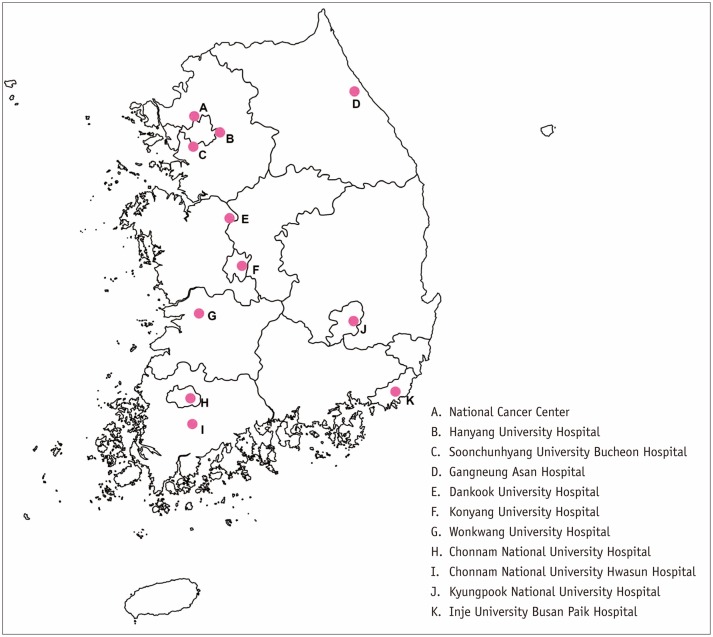
We organized the Alliance for Breast Cancer Screening in Korea (ABCS-K) with the support of a government research fund. The ABCS-K comprised 11 institutions: 10 university-orgaffiliated hospitals representative of each province of Korea and one institute as a statistical coordinating center (Fig. 1). The major objectives of the ABCS-K were: to enhance understanding of mammography screening practices in Korea using further assessment of the NCSP; to foster collaborative research among alliance participants in order to examine unsolved issues in providing screening services and subsequent diagnostic work-up; and to provide a foundation for conducting prospective research to improve our understanding of breast cancer in Korean women.
Since 2002, the results of the NCSP for breast cancer have been collected in a database located at the NHI Service (NHIS). Using this database, the NHIS and National Cancer Center have evaluated (but not announced) the performance of the NCSP. The NCSP database includes series of screening facilities that participate in the NCSP, the results of mammography in the NCSP and cancer outcomes. However, there is no information concerning the radiologists involved or types of mammography equipment used (film/screen, computed radiography, and digital) in the NCSP database. With approval from the IRB of each participating institution, we linked the hospital information on mammography screening performed from January 2005 to December 2010 with the NCSP database and constructed a research database. Mammograms with incomplete identification numbers, a previous diagnosis of cancer, and interstitial mammoplasty were excluded in the research database.
The American College of Radiology Breast Imaging-Reporting and Data System (ACR BI-RADS) categories 1 and 2 were considered negative results, whereas categories 0, 4, and 5 were considered positive results (6). If an original report of screening mammography was not consistent with the BI-RADS, a breast radiologist at the same hospital assessed the BI-RADS categories according to the context of the original report. We included cancer diagnoses from the NCSP database until December 2011 to account for the 12-month period after screening. Breast cancers included invasive cancer (International Classification of Disease, 10th revision [ICD-10] code C50) and carcinoma in situ (ICD-10 code D05).
We calculated the performance indicators of mammography screening as a whole and by individual institution according to the year. The performance indicators included the recall rate, cancer detection rate (CDR), positive predictive value (PPV), sensitivity, specificity, false-positive rate (FPR), and interval cancer rate (ICR). The recall rate was calculated as the percentage of women screened who were recalled for further evaluation. The CDR was calculated as the number of breast cancer cases detected per 1000 examinations. The interval cancer was defined as a histology-proven, invasive or in situ cancer within 1 year after the negative screening; additionally, the ICR was calculated as the number of interval cancers per 1000 negative examinations.
Changes in the performance indicators were calculated as an annual percent change (APC), with 95% confidence interval (CI). The APC is used to measure the trend or change in the proportions or rates over time. It was estimated by fitting a least-squares regression line using calendar-years as a regression variable (7). All statistical analyses were conducted using SAS software, version 9.2 (SAS Institute, Cary, NC, USA).
RESULTS
The baseline raw data of the ABCS-K from the 10 participating hospitals from 2005 to 2010 comprised 130537 mammograms. Of these, 1121 mammograms with incomplete identification numbers, 557 mammograms from women with a previous diagnosis of breast cancer, and 104 mammograms showing interstitial mammoplasty were excluded. Therefore, 128756 mammograms were included as the cancer-free cohort in the research database of this study (Table 1, Fig. 2). The age distribution of the enrolled cases was as follows: 40–49 years, n = 45449 (35.3%); 50–59 years, n = 47356 (36.8%); 60–69 years, n = 28331 (22.0%); 70 years and older, n = 7620 (5.9%) (Supplementary Table 1 in the online-only Data Supplement).
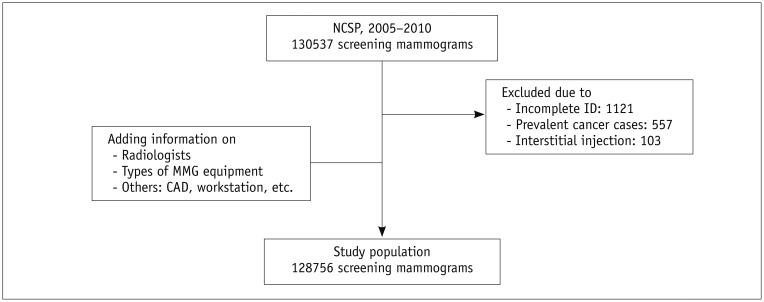
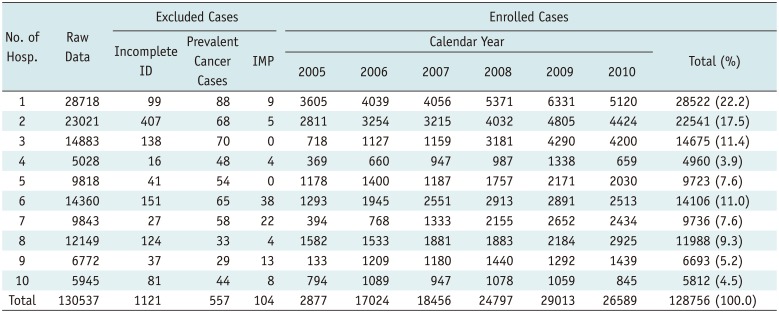
Fig. 2
Study population of Alliance for Breast Cancer Screening in Korea.
CAD = computer-aided detection, ID = identification number of hospital, MMG = mammography, NCSP = National Cancer Screening Program
![]()
Table 1
Numbers of Enrolled Cases by Hospitals and Years in Alliance for Breast Cancer Screening in Korea (ABCS-K)
![]()
There were 400 breast cancer cases, including 322 invasive and 78 in situ cancers, registered in the database of the NHIS within 1 year after screening (Supplementary Table 2 in the online-only Data Supplement). Among them, 346 were true positive and 54 were false negative.
The diagnostic accuracy and trend of screening mammography by the ABCS-K were as follows (Table 2): the average recall rate of the 10 participating hospitals over 6 years was 19.1% and showed a downward trend over time (-12.1% per year; 95% CI, -15.9 to -8.2); the CDR per 1000 examinations was 2.7 but did not show any statistically significant trend; the PPV was 1.4% and showed an upward trend (20.8% per year; 95% CI, 15.2 to 26.7); the sensitivity was 86.5% and showed no significant trend, whereas the specificity was 81.1%, with an upward trend (3.3% per year; 95% CI, 2.1 to 4.5). The FPR was 18.9% and showed a downward trend (-12.4% per year; 95% CI, -16.2 to -8.4); finally, the ICR was 0.05% per 1000 negative examinations and showed no significant trend.
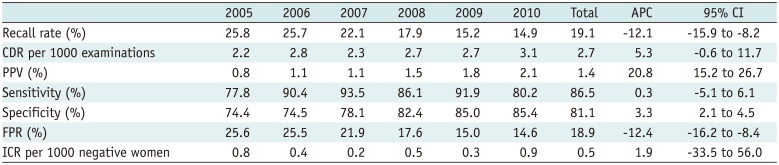
Table 2
Diagnostic Accuracy and Trend of Screening Mammography in Alliance for Breast Cancer Screening in Korea
![]()
There were institutional variations in the diagnostic accuracy and trend in the ABCS-K. The average recall rates of hospital numbers 1 and 8 showed a statistically significant downward trend, whereas those of hospital numbers 3, 9, and 10 showed an upward trend, and those of others did not show any significant trend (Table 3). The PPV of hospital number 1 showed an upward trend but that of others did not show any significant trend (Table 4). The specificity of hospital numbers 1 and 8 showed an upward trend, whereas that of hospital numbers 3, 9, and 10 showed a downward trend, and that of others did not show any significant trend (Table 5). The FPR showed a reversed pattern with the specificity; that of hospital numbers 1 and 8 showed a downward trend, whereas that of hospital numbers 3, 9, and 10 showed an upward trend, and that of others showed no significant trend (Table 6). By contrast, the CDR, sensitivity, and ICR showed no significant institutional variation or trend.
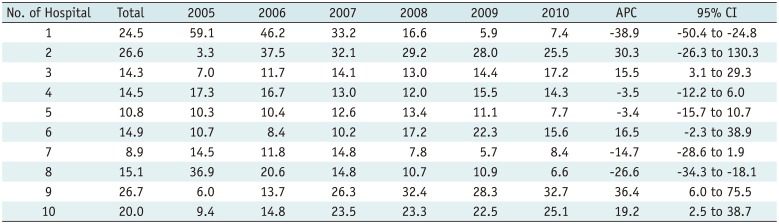
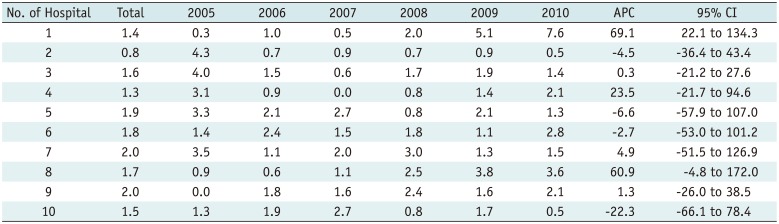
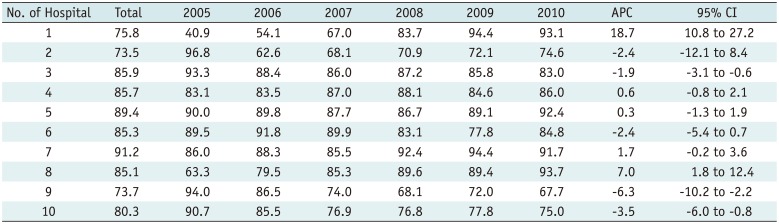
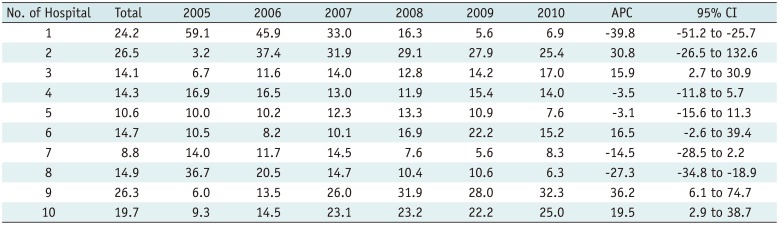
Table 3
Recall Rate and Trend of Screening Mammography by Hospitals Participating in Alliance for Breast Cancer Screening in Korea
![]()
Table 4
Positive Predictive Value and Trend of Screening Mammography by Hospitals Participating in Alliance for Breast Cancer Screening in Korea
![]()
Table 5
Specificity and Trend of Screening Mammography by Hospitals Participating in Alliance for Breast Cancer Screening in Korea
![]()
Table 6
False Positive Rate and Trend of Screening Mammography by Hospitals Participating in Alliance for Breast Cancer Screening in Korea
![]()
DISCUSSION
In this study, the recall rate (19.1%), PPV (1.4%), specificity (81.1%) and FPR (18.9%) of screening mammography in the ABCS-K showed significant improvements from 2005 to 2010. However, the sensitivity (86.5%), CDR (2.69 per 1000 examinations), and ICR (0.5 per 1000 negative examinations) showed no significant trend.
The improved recall rate, PPV, specificity, and FPR in this study indicate that screening mammography is improving with regard to quality–that is, the efficiency of screening. This improvement has been due, in part, to the accumulated experience of readers and skill development of the technicians, and to changes of mammography equipment or to a combination of these factors. However, the unchanged CDR, sensitivity, and ICR indicate that mammography screening is stationary with regard to quantity–that is, the detection of cancer. However, these parameters can also be improved if the overall quality of the mammography screening is improved (8910).
The diagnostic accuracy of the ABCS-K from 2005 to 2010 was superior to that of the NCSP from 2002 to 2006 in terms of the sensitivity, CDR, and PPV, whereas it was inferior in terms of the recall rate and specificity (Table 7). The differences between the groups can be mostly explained by the different characteristics of the participating facilities–those of the ABCS-K were university-affiliated hospitals, whereas those of the NCSP included all types of medical practices. Thus, there are many differences among the groups, including the characteristics of the readers and technicians and types of mammography equipment used, as well as the status of quality control (11). The inferior recall rate and specificity of the ABCS-K can be also explained by the different characteristics of the participating facilities. Many facilities had a large screening volume, showing recall rates of approximately 0%, and contributing to the low overall recall rate of the NCSP (Supplementary Fig. 1 in the online-only Data Supplement). By contrast, the institutional recall rates in the ABCS-K ranged from 8.9 to 26.7%. On the other hand, the PPV of the ABCS-K should be further improved, although it has shown some improvement compared with that of the early NCSP. It could be improved if the recall rate is further improved.
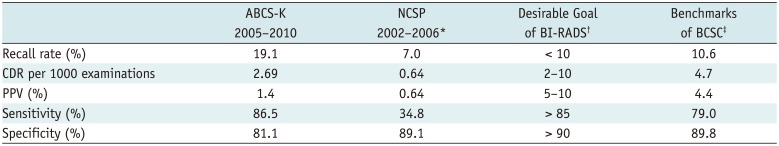
Table 7
Comparison of Diagnostic Accuracy of ABCS-K with That of NCSP 2002–2006, ACR BI-RADS and BCSC
*Not published data, †Desirable goal of the ACR BI-RADS 4th ed. (6), ‡BCSC (12). ABCS-K = Alliance for Breast Cancer Screening in Korea, ACR BI-RADS = American College of Radiology Breast Imaging-Reporting and Data System, BCSC = Breast Cancer Screening Consortium, CDR = cancer detection rate, NCSP = National Cancer Screening Program, PPV = positive predictive value
![]()
Compared with the desirable goal of the ACR BI-RADS and benchmarks of the Breast Cancer Screening Consortium, the sensitivity and CDR of the ABCS-K were consistent, whereas the others were suboptimal (Table 7) (612). The overlying reason for this, and the most important observation of this study, involves the trade-offs between the sensitivity and recall rate. The sensitivity of the ABCS-K appeared promising; however, it was achieved at the cost of recall rate. Furthermore, low PPV and specificity and high FPR can be explained by the high recall rate.
The high recall rate of the ABCS-K has been affected by examinee-related factors such as the proportion of women with dense breast tissue. High breast density is one of the strongest predictors of failure in mammography screening (13). Additionally, the proportion of dense breast tissue in mammography is high in Korean women compared with that of Western women (80.0% vs. 46.0%, respectively) (14). Therefore, the sensitivity should be lower in Korean women than in Western women in the case of a reasonable recall rate. A recent Japanese study was compatible with this rationale and showed poor sensitivity in dense breast tissue (15). However, the sensitivity of our study was comparable to that of Western women owing to a high recall rate. The high recall rate seems to overcome the limitations of high breast density, although it infringes on the cost-effectiveness of screening. The other factors affecting diagnostic accuracy, including the characteristics of the readers and examinees, as well as types of mammography equipment used, will be reported in a future series.
There were marked institutional variations in this study. Hospital numbers 1 and 8 showed desirable trends such as improvements in the recall rate, PPV (number 1), specificity, and FPR. However, the hospital numbers 3, 9, and 10 showed undesirable trends such as a deterioration in these parameters, and others showed no significant trend. These variations could have been affected by the characteristics and reading volumes of the readers, types of mammography equipment used, and characteristics and behaviors of the examinees. The effect of these factors will be reported in a future series.
This study has some limitations. First, the screening volumes of the participating hospitals were variable, and the volumes of the two hospitals accounted for approximately 40% of all cases. It could have influenced the overall results. However, the screening volumes of the participating facilities in the NCSP were also variable (Supplementary Fig. 1, Supplementary Table 3 in the online-only Data Supplement); thus, it can be considered to represent the real world. Second, all of the participating hospitals were university-affiliated, which may not be representative because the participating facilities of the NCSP included clinics (57.0%), hospitals (28.5%) and general or university-affiliated hospitals (14.5%) (Supplementary Table 3 in the online-only Data Supplement). However, it was impossible for more facilities in the NCSP to participate in this study because of limited human resources and research funding. Finally, our study could not address the present status of mammography screening because the study period was 2005–2010, and the effects of the quality control programs of the NCSP, initiated since 2010 could not be reflected (1617). The period 2005–2010, however, showed the best choice because the NCSP database with cancer outcomes was available up to 2011 and the target population of the NCSP before 2005 was relatively small. Additionally, some time lag is inevitable in the research of population-based screening. Nevertheless, the significance of this report as the first multi-center study concerning screening mammography in Korea is warranted. Additionally, it can act as a basis for future prospective studies on breast cancer screening in Korea.
In conclusion, the sensitivity and CDR of screening mammography in the ABCS-K from 2005 to 2010 were comparable with those for Western women. By contrast, the recall rate, PPV, and specificity were suboptimal, although they showed significant improvements over this period. There were marked institutional variations in the recall rate, PPV, specificity, and FPR. Further analysis is required to explain these institutional variations.
 XML Download