

 PDF
PDF ePub
ePub Citation
 Print
Print


INTRODUCTION
Liver fibrosis is an intermediate step in the development of cirrhosis resulting from chronic liver disease. Its etiologies include viral infection, alcohol, drugs, toxicants, cholestasis, metabolic diseases, etc. (1). Among these factors, viral infection is known as an important factor and is caused by excessive deposition of extracellular matrix (ECM) (2). Mild to moderate liver fibrosis is reversible (3). Therefore, accurate diagnosis of the stages of liver fibrosis is of vital importance with respect to clinical treatment and patient prognosis.
Currently, the main methods of evaluating liver fibrosis include liver biopsy, serology, radiology and elastography. Liver biopsy is the "gold standard" for the diagnosis of liver fibrosis and cirrhosis, although it has some limitations. For example, some complications may arise from invasive examinations (4). The majority of patients refuse to undergo liver biopsy, and they are even more reluctant to accept a second liver biopsy, so the efficacy is difficult to observe (5). Additionally, the sampling lengths of hepatic tissue (6), sampling errors and differences among intraobservers or interobservers (78) may affect the accuracy of the diagnostic results. Radiological methods include conventional ultrasound (US), computed tomography, and magnetic resonance imaging, which can diagnose only typical cirrhosis and are unable to assess the presence or the degree of liver fibrosis. Serological indices include direct indices, such as hyaluronic acid (HA), collagen type IV (CIV), procollagen type III (PCIII), and laminin (LN); indirect indices, such as aminotransferase, bilirubin, coagulation factors, platelets; and serological algorithms, such as Forns index, Fibrotest, FIB-4, and the aspartate aminotransferase: platelet ratio index (APRI). The serological markers and their algorithms can reflect only the active phase of hepatic fibrosis and are controversial with respect to the diagnosis of hepatic fibrosis stages (910). Elastography is a newly developed imaging technique that is based on the elastic modulus of liver tissues associated with the degree of hepatic fibrosis (1112).
Acoustic radiation force impulse (ARFI) transmits short, low frequency, focused sound pulses through probes not to create tissue longitudinal compression of micron and transverse vibrations that generate shear waves. Shear-wave velocity (SWV) is positively correlated with the hardness of tissues and can non-invasively quantitatively assess the elastic hardness of liver tissue, indirectly evaluating the degree of hepatic fibrosis. ARFI is becoming a hot topic for clinical studies. Preliminary studies have confirmed that ARFI shows good performance in the diagnosis of hepatic fibrosis (1314).
This study aims to compare the diagnostic accuracies of several noninvasive indices, including SWV obtained with ARFI, and serological markers for assessing hepatic fibrosis in chronic hepatitis B, using percutaneous liver biopsy as a reference standard.
MATERIALS AND METHODS
Study Population
This prospective study was performed in 157 consecutive patients who were previously diagnosed with chronic hepatitis B, were to undergo an liver biopsy at the Department of Infectious Disease, Baoji Central Hospital, China, and fulfilled the eligibility criteria as follows from July 2012 to April 2014: positive serum hepatitis B surface antigen (HBsAg), no previous antiviral therapy for hepatitis B, not a clinically apparent cirrhotic patient, body mass index less than 30 kg/m2, no difficulty with a short breathhold needed for ARFI examination, as well as the provision of informed consent. Of the 157 patients, 96 were men (mean age, 33.6 years ± 10.5 SD; range, 20–65 years), and 61 were women (mean age, 35.5 years ± 12.8 SD; range, 14–53 years).
A control group of 30 healthy volunteers (men, 15; women, 15; age, 35.4 ± 5.2 years, range, 18–41 years) was included in the study. The volunteers had normal liver enzyme levels, negative anti-HCV antibodies and negative HBsAg, as well as no diagnoses of fatty liver disease, diabetes, hyperlipidemia, alcohol abuse or relevant concomitant illnesses, such as heart disease, lung disease, liver disease or neoplasia.
Acoustic Radiation Force Impulse
The patients and control subjects underwent an ARFI examination using a commercial scanner (Siemens Acuson S2000: 4.5 MHz 4 V1 probe, Siemens Medical Solutions USA, Inc., Mountain View, CA, USA), which was performed by an US physician with three months of experience in ARFI elastography. The patients were examined in the left lateral decubitus position with the right arm elevated above the head. The operator positioned the probe over the following region of interest: segment eight of the right lobe, away from motion and vessels, at a depth between 3.0 and 4.0 cm. Scanning was performed with minimal scanning pressure applied by the operator; the patients were asked to stop breathing to minimize motion. A median value was calculated for every patient based on 10 measurements, which were reported in meters per second (m/s).
Serum Fibrosis Markers
The following serum parameters were determined in the same hospital laboratory: HA, CIV, PCIII, and LN. They were tested on the morning of the same day of the ARFI evaluation. Enzymatic activity was measured at 37℃ according to International Federation of Clinical Chemistry standards. The normal reference ranges are as follows: 0–120 ng/mL (HA), 0–130 ng/mL (CIV), 0–140 ng/mL (LN), and 0–12 ng/mL (PCIII).
Liver Biopsy and Histologic Assessment
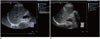
Overall, 157 patients underwent US-guided percutaneous liver biopsy (18 G, 20-cm-long needle, suction technique) immediately after the ARFI examination. The biopsy and ARFI examination were performed in the same tissue area (Fig. 1), away from the great vessels. The mean number of histologic strips was two. Liver biopsy samples less than 15 mm long were excluded, as were biopsies with less than 5 portal tracts (except for cirrhosis).
The liver specimens were fixed in formalin, paraffin-embedded, and stained with hematoxylin-eosin and Masson's trichrome. All biopsy specimens were analyzed by an associate chief pathologist with five years of experience in evaluating liver fibrosis staging, who was blinded to the biochemical data, as well as the results of the ARFI. The liver fibrosis stages were evaluated by the METAVIR scoring system. Liver fibrosis was staged on a four-point scale as follows: F0, no fibrosis; F1, portal fibrosis without septae; F2, portal fibrosis with a few septae; F3, numerous septae without cirrhosis; and F4, cirrhosis (15).
Statistical Analysis
Shear-wave velocity had a normal distribution and was expressed as the mean ± SD by frequency analysis. The blood parameters (HA, LN, CIV, and PCIII) did not have a normal distribution and were expressed as medians (interquartile ranges). The correlations between the noninvasive tests and the histological fibrosis stages were assessed using Spearman's test. All non-invasive tests were included using logistic regression analyses. To generate predictive probability as an independent variable of the combination tests, SWV, HA, and CIV were included in the binary logistic regression analyses. The diagnostic performances of SWV, HA, LN, CIV, and PCIII were assessed and compared using receiver operating characteristic (ROC) curves. A p value less than 0.005 was considered to be statistically significant in comparing the areas under the ROC curves (AUC), considering multiple pair-wise comparisons, i.e., Bonferroni correction, to keep the overall alpha at 5%. The accuracy of SWV was also compared with that of combinations of the tests. Cutoff values were defined by the Youden index and maximized the sum of the sensitivities and specificities in diagnosing each fibrosis stage. Finally, the sensitivity (Se) and specificity (Sp) were calculated. In addition to the aforementioned Bonferroni correction, a p value less than 0.05 was considered to be statistically significant. All results were analyzed by SPSS version 13.0 (SPSS Inc., Chicago, IL, USA) and MedCalc version 15.2.1 (MedCalc Program, Ostend, Belgium).
RESULTS
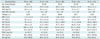
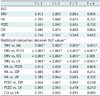
All results for the 157 patients with chronic hepatitis B and 30 healthy subjects, including SWV and serum fibrosis makers, are illustrated in Table 1. All patients who underwent histological assessments for liver fibrosis were classified according to METAVIR scores.
Correlation between Non-Invasive Tests and Liver Fibrosis Stage
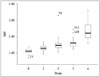
Shear-wave velocity, HA, CIV, PCIII, LN and the liver fibrosis stage were positively correlated. The relationship was strongest between SWV and the stage of liver fibrosis and weakest between PCIII and the stage of liver fibrosis (Table 2). Box plots showed an increasing trend in SWV as the liver fibrosis stage increased (Fig. 2).
Comparison of SWV and Blood Parameters
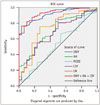
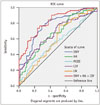
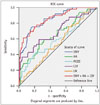
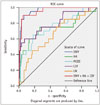
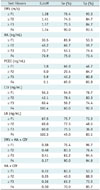
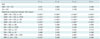
The ROC curves of the non-invasive parameter predictions of the liver fibrosis stages are shown in Figures 3, 4, 5, 6. By comparing the AUC, we found that the AUC of the SWV diagnosis of liver fibrosis stage was greater than that of the blood parameters (Table 3). Corresponding cut-off, Sp and Se are shown in Table 4.
The best test for predicting fibrosis F ≥ 2 was SWV (0.851), followed by CIV (0.671), HA (0.668), LN (0.562), and PCIII (0.550). SWV and CIV differed significantly with respect to the diagnosis of fibrosis F ≥ 2 (p < 0.001).
The best test for predicting fibrosis F ≥ 3 was SWV (0.854), followed by CIV (0.693), HA (0.675), PCIII (0.591), and LN (0.548). SWV and CIV differed significantly with respect to the diagnosis of fibrosis F ≥ 3 (p < 0.001).
The best test for predicting fibrosis F = 4 was SWV (0.965), followed by CIV (0.804), PCIII (0.752), HA (0.744), and LN (0.662). SWV and CIV did not significantly differ (p = 0.005), but SWV and HA differed significantly (p < 0.001) with respect to the diagnosis of fibrosis F = 4.
Combination of Non-Invasive Tests
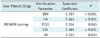
Laminin and PCIII were excluded from logistic regression modeling because of the weak correlation between them and the liver fibrosis stage. We found that SWV combined with HA and CIV was distinguished from HA, CIV, PCIII, and LN in the diagnosis of liver fibrosis (F ≥ 1 to F = 4), but SWV combined with HA and CIV did not differ from SWV in diagnosing liver fibrosis (F ≥ 1 to F = 4). SWV combined with HA and CIV did not significantly improve diagnostic performance (Table 5). Therefore, SWV combined with HA and CIV, SWV combined with HA or SWV combined with CIV do not aid in the diagnosis of liver fibrosis.
Collagen type IV combined with HA was not distinguished from HA or CIV in the diagnosis of liver fibrosis (F ≥ 1 to F = 4), and the ability to diagnose liver fibrosis (F ≥ 1 to F = 4) with CIV combined with HA was still inferior to that of SWV, but CIV combined with HA significantly differed from PCIII with respect to the diagnosis of liver fibrosis (F ≥ 1 to F ≥ 2) (Table 5).
DISCUSSION
Accurate judgement of the degree of viral hepatic fibrosis is important in patient treatment, prognosis, and surveillance. Liver biopsy is considered the gold standard for the diagnosis of liver fibrosis, but it has limitations, including the risk of serious complications in clinical applications. In recent years, the search for a method of non-invasively diagnosing liver fibrosis has become a hot topic. With the emergence of US elastography and a large number of serological markers, physicians must selectively use these methods in clinical practice. The present study compares the performances of ARFI and direct serological markers (HA, CIV, PCIII, and LN) in the diagnosis of liver fibrosis stages.
Acoustic radiation force impulse is a recently-developed method of evaluating the hardness of tissues. It was reported to not only evaluate the elastic characteristics of hepatic parenchyma but also access the elasticity of the spleen, pancreas, kidney, prostate, etc. (16171819). This technique is different from other elastic technologies as it can evaluate the hardness of deep tissues without the need for external pressure (20). Moreover, it is easy to perform and has the advantages of low cost, no radiation, and real-time imaging (21).
Current studies of the mechanism of hepatic fibrosis have shown that it is caused by excessive deposition of ECM in the liver, especially collagen. With developments in molecular biology, some serological indices to detect liver fibrosis have been discovered, including direct and indirect markers. The indirect markers reflect the extent of hepatic inflammation and damage rather than the degree of hepatic fibrosis and include alanine aminotransferase, aspartate aminotransferase, gamma-glutamyltransferase, indirect bilirubin, direct bilirubin, coagulation factors, thrombin, and platelets. The direct markers include ECM, collagen, enzymes, and cytokines. Of these, the ECM markers (HA, CIV, PCIII, and LN) are mainly used in the diagnosis of liver fibrosis at present and have demonstrated moderate significance in the diagnosis of hepatic fibrosis in previous studies (2223). In the present study, four types of serum markers for the diagnoses of liver fibrosis and cirrhosis had low or moderate diagnostic value (AUC: 0.524 to 0.801), but they predicted liver fibrosis F ≥ 1, which indicates high positive predictive value (84.0% to 89.4%), and they predicted cirrhosis, which indicates high negative predictive value (92.1% to 98.6%). Therefore, the credibility of these markers for distinguishing liver fibrosis is high.
The cutoff (Table 4) values and AUCs (Table 3) for the diagnosis of hepatic fibrosis stages by ARFI in the present study were compared with those of Dong et al. (24) and are shown as follows: 1.28 m/s vs. 1.30 m/s and 0.91 vs. 0.88 (F ≥ 1); 1.41 m/s vs. 1.30 m/s and 0.85 vs. 0.76 (F ≥ 2); 1.57 m/s vs. 1.54 m/s and 0.85 vs. 0.88 (F ≥ 3); and 1.75 m/s vs. 1.83 m/s and 0.97 vs. 0.72 (F = 4). The results were significantly different between the two studies, and it is hypothesized that this finding is due to differences in the study designs. In the present study, ARFI and liver biopsy were immediately conducted without changing the machine or operator, thereby ensuring ARFI detection and liver biopsy simultaneously. However, because the ARFI sampling size is small (1.0 × 0.5 cm) and liver fibrosis is not symmetric, the accuracy of the study results may have been affected. A recent meta-analysis that evaluated 51 patients with hepatitis B virus (HBV) demonstrated the excellent performance of SWV in the diagnosis of significant fibrosis and cirrhosis, but the AUC was lower than that found in this study (0.79 versus 0.85 for significant fibrosis and 0.90 versus 0.96 for cirrhosis) (25).
In recent years, the findings of research related to the non-invasive diagnosis of liver fibrosis have been encouraging, but currently, there is no single non-invasive indicator that can accurately assess liver fibrosis. Therefore, many scholars have tried to combine various non-invasive tests to improve performance. Liu et al. (26) found that SWV combined with transient elastography (TE) and APRI increased the sensitivity and negative predictive value for the diagnosis of significant fibrosis and cirrhosis. Stibbe et al. (27) found that a combination of various tests (TE, HA, and FibroTest) elevated the AUC. However, this study indicated that neither SWV combined with HA or CIV or HA combined with CIV significantly improved diagnostic performance.
This study had limitations. First, the test was carried out only in patients with HBV; we need to compare the performances of ARFI, HA, CIV, PCIII, LN, APRI, Forns, King, and FIB-4 scores in the diagnosis of other types of viral hepatitis and liver fibrosis in future studies. Second, the grade of inflammation may affect the accuracy of the SWV prediction of the stage of liver fibrosis (24), but this study did not explore the association between SWV and the degree of inflammation.
In conclusion, it was found that the performance of SWV in the diagnosis of liver fibrosis stage in chronic viral hepatitis B was superior to that of serum markers; the AUC of SWV was greater than 0.85 for F ≥ 1 to F = 4, and the AUC for the serologic indices (HA, CIV, PCIII, and LN) was less than or equal to 0.80 for F ≥ 1 to F = 4. However, combinations of various non-invasive tests does not increase the accuracy of the detection of liver fibrosis and cirrhosis.
 XML Download