

 PDF
PDF ePub
ePub Citation
 Print
Print


INTRODUCTION
The placenta is an essential organ that grows and differentiates rapidly during its relatively short intrauterine life and provides an interface between mother and fetus. Placental abnormalities play an important role in fetal and maternal morbidity and mortality because of the importance of the placenta in fetal growth and development (1). Chromosomal aberrations affect not only the embryo and fetus but also chorionic villi of the placenta. These changes include disruption of branching, hypo-vascularization, hydropic changes, trophoblastic atrophy, and hyperplasia. Macroscopic and microscopic changes have been reported in a number of congenital abnormalities, such as trisomy. Increase in placental weight may cause pathologic changes, such as chorangiosis, immature or dysmature villi, villous hemorrhage, endovasculitis, and villitis (2).
Placental structural abnormalities may occur in pregnant women with abnormal fetuses. Major structural abnormalities likely affect placental stiffness. Therefore, evaluation of placental elasticity may facilitate determination of fetal abnormalities during pregnancy.
Elastography is a non-invasive imaging modality used to evaluate soft tissue stiffness (3). Acoustic radiation force impulse (ARFI) has emerged recently for elastography imaging instead of manual compression (456). Stiffness imaging techniques measuring shear wave velocity (SWV) are effective in the liver, breast, prostate, pancreas, lymph nodes, and thyroid glands. Mechanical characteristics of soft tissue can be assessed using ARFI, which comprises virtual touch tissue imaging and virtual touch tissue quantification (VTQ). VTQ is a modified application of ultrasonography (US) that provides SWV corresponding to tissue stiffness (7). Compared to manual compression, ARFI elastography has the advantages of being repeatable, objective, and less operator-dependent.
We aimed to evaluate placental stiffness measured by ARFI elastography during the second trimester in pregnant women with a normal fetus compared to those with a fetus with anomalies, and to determine the predictive value of ARFI elastography for congenital malformations.
MATERIALS AND METHODS
Patients
This prospective study was approved by the local Ethics Committee and each participant signed an informed consent form. A total of 40 pregnant women in the second trimester (18–28 weeks of gestation) with a mean age of 26 years (standard deviation [SD], 6 years; range 18–44 years), admitted to the obstetrics outpatient clinic between July 2014 and December 2014 for screening for fetal anomalies and diagnosed as having a fetus with a structural anomaly (such as thickened nuchal fold, short femur, short humerus, pyelectasis, hyperechoic bowel, echogenic intracardiac focus, choroid plexus cyst, heart defects, omphalocele, ventriculomegaly, and limb abnormalities) or non-structural findings, comprised the study group. Thirty-four healthy pregnant women in the second trimester (18–28 weeks of gestation) with a mean age of 30 years (SD, 6 years; range 20–47 years) and having normal fetuses were enrolled in the study as the control group. Pregnant women with pre-eclampsia, diabetes mellitus, and 8 cm or deeper posterior placental location were excluded from the study.
Imaging Technique and Analysis
All pregnant women were screened for fetal anomalies by B-mode US; each US examination included a structural fetal survey and standard biometry. Placental thickness and morphology were evaluated. Blood-flow characteristics in the umbilical and uterine arteries were examined by Doppler US. The best-visualized uterine artery (UtA) on US was used for measurement of blood flow parameters by Doppler US. Pulsatile index (PI), resistivity index (RI), and systole/diastole (S/D) parameters of the uterine and umbilical arteries were also measured.
Each fetus was assigned a score based on sonographic markers. Major markers and thickened nuchal fold were assigned a score of 2; and short femur, short humerus, pyelectasis, hyperechoic bowel, echogenic intracardiac focus, and choroid plexus cyst were assigned a score of 1 (8910). Major structural anomalies included findings such as heart defects, omphalocele, ventriculomegaly, and limb abnormalities. Each fetus was scored by summing the scores of markers of abnormalities. Placental elasticity measurements were performed by a single radiologist with over 10 years of experience in obstetric US and more than 2 years of experience with ARFI elastography.
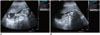
We used an ultrasonograph (Acuson S2000™, Siemens, Erlangen, Germany) equipped with a curved probe (4C1 Acuson) for both obstetric examinations and ARFI elastography measurements. ARFI elastography measurements of placental solid components were performed in the supine position while the patient held their breath. VTQ values for ARFI imaging were recorded from six locations in the placenta, including the chorionic, basement, and central regions (Fig. 1). Shear-wave velocity (expressed as m/s) was recorded in a 10 × 6 mm rectangular region of interest (ROI). The minimum SWV (minSWV), maximum SWV (maxSWV), and mean SWV (meanSWV) values obtained using the ARFI method were recorded.
Statistical Analysis
Statistical analyses were performed using SPSS 21.0 (Statistical Package for Social Sciences, SPSS Inc., Chicago, IL, USA) for Windows. Numerical variables were expressed as means ± SD, and categorical variables as percentages. The distribution of numerical data was assessed using the Kolmogorov-Smirnov test. Student's t test was used to compare normally distributed variables between two groups and one-way analysis of variance for more than two groups. Placental elasticity measurements were compared according to fetal anomaly scores by means of correlation analyses.
Correlations between numerical variables were assessed using the Pearson test for normally distributed variables and the Spearman test for variables with a non-normal distribution. Receiver operating characteristic (ROC) curve analysis was used to determine the cut-off point, as well as the sensitivity and specificity values for ARFI measurements in predicting fetal anomaly. A p value less than 0.05 by two-tailed test was considered to indicate statistical significance.
RESULTS
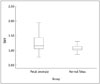
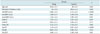
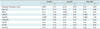
In the study group, minSWV, maxSWV, and meanSWV values were higher compared to the control group ([0.86 ± 0.2, 0.74 ± 0.1; p < 0.001], [1.89 ± 0.7, 1.59 ± 0.5; p = 0.04], and [1.26 ± 0.4, 1.09 ± 0.2; p = 0.01], respectively) (Table 1, Fig. 2). The study group also exhibited higher UtA PI and S/D values compared to those of the control group (Table 1).
In the study group, there was no significant correlation between elasticity parameters and the RI, PI, and S/D values of the umbilical artery and the RI value of the UtA. However, the PI value of the UtA was positively correlated with the minSWV, maxSWV, and meanSWV values of the placenta ([r = 0.4, p = 0.02], [r = 0.39, p = 0.04], and [r = 0.4, p = 0.02], respectively). In addition, the S/D value was positively correlated with the minSWV, maxSWV, and meanSWV parameters of elasticity ([r = 0.43, p = 0.02], [r = 0.41, p = 0.03], and [r = 0.48, p = 0.01], respectively) (Table 2).
There was no correlation between placental thickness and elasticity parameters (Table 2). In addition, the risk score for a fetal anomaly calculated by summing the scores of sonographic markers was positively correlated with the minSWV and maxSWV values in the study group (r = 0.301, p = 0.05; and r = 0.326, p = 0.04, respectively). However, the meanSWV value was not significantly correlated with risk score (r = 0.233, p = 0.14).
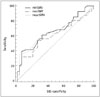
Receiver operating characteristic curve analyses for predicting fetal anomalies based on minSWV, maxSWV, and meanSWV values were moderate, with areas under the ROC curve (95% CI) of 0.661 (0.538–0.783), 0.609 (0.481–0.737), and 0.644 (0.519–0.769), respectively (Fig. 3).
DISCUSSION
Few data about placental elasticity are available (11,12,13,14). To our knowledge, this is the first study in the English-language literature to evaluate placental elasticity using the ARFI imaging modality in pregnant women with fetuses with anomalies compared to those with normal fetuses. In a previous study, the reliability of ARFI in the assessment of placental tissue elasticity was investigated (11). In that study, the velocities of the lateral shear waves determined by ex vivo ARFI elastography was higher in the group with fetal growth retardation compared to the control group. However, there was no difference in these parameters between pre-eclamptic pregnant women and healthy controls. In our work, the mean velocity of the control group was 1.09 ± 0.2 m/s, compared to 1.31 ± 0.35 m/s in the previous study. This difference might be due to ex vivo measurement of ARFI velocity, which was measured in vivo in this study. In vivo, blood flow may affect elasticity. Additionally, in a recent in vivo study, Ohmaru et al. (12) found a meanSWV value of 0.98 m/s in normal pregnancies, which is in agreement with our results.
Another study of SWV imaging of placental elasticity in healthy pregnant women reported no difference between the edge and central portions of the placenta in terms of mean elastic modulus values (13). In addition, placental stiffness assessed by strain elastography and SWV has been reported to be increased in pregnant women with pre-eclampsia compared to those with healthy pregnancies (1415). Our results demonstrated that placental stiffness parameters on ARFI imaging (minSWV, maxSWV, and meanSWV) are increased in pregnancies with fetal anomalies compared to those with a normal fetus. Increased placental stiffness may be a result of pathologic placental changes, which may cause fetal anomalies. The total risk score for having an anomaly in the fetus, which was the sum of sonographic markers, was positively correlated with placental elasticity characteristics, particularly the minSWV and maxSWV values. The minSWV and maxSWV values increased with the increase in risk score. These results suggest the need for further large-scale studies of the value of placental elasticity parameters in predicting congenital structural anomalies.
The Doppler waveform of the UtA in the second trimester is useful for assessment of uteroplacental circulation and identification of pregnant women at risk of uteroplacental insufficiency complication (161718). Doppler examination of UtA in the second and third trimesters may facilitate screening for adverse outcomes in pregnancy (19). The UtA PI and S/D measurements in the study group were consistently higher than those of the control group, which suggests disruption of the uteroplacental circulation in pregnant women with fetal anomalies. In addition, the positive correlation of UtA PI and S/D values with minSWV, maxSWV, and meanSWV values supports the notion that impairment of placental function is due to disruption of the uteroplacental circulation. Therefore, pathologic changes–such as hemorrhage, endovasculitis, and villitis–may play a role in increased placental stiffness.
The main limitation of our study was the relatively small sample size. Further large-scale studies should be performed to clarify the predictive value of placental stiffness parameters for fetal anomalies. Secondly, structural anomalies and non-structural findings were not confirmed histopathologically. Thirdly, the placental stiffness of women with 8 cm or deeper placental localization could not be measured using ROIs; thus, they were excluded from the study. Finally, placental elasticity measurements were performed by a single radiologist. It would have been better to evaluate inter-observer agreement using two reviewers with different experience levels.
In conclusion, placental stiffness evaluated using ARFI elastography during the second trimester in pregnant women with fetuses with fetal anomalies was higher than that of pregnant women with a normal fetus.
 XML Download