

 PDF
PDF ePub
ePub Citation
 Print
Print


INTRODUCTION
Recent advances in magnetic resonance (MR) imaging technology have resulted in wide use of diffusion-weighted (DW) MR imaging across the whole body (1). DW MR imaging is based on the Brownian motion of water in biological tissues, so the resulting image contrast depends on tissue cellularity, extracellular tortuosity and the integrity of cell membranes (2). The advantages of DW MR imaging include the lack of ionizing radiation, the lack of need for contrast agent and the ability to provide not only anatomic and structural information but also quantitative metrics using the apparent diffusion coefficient (ADC) (3).
Diffusion-weighted MR imaging is used in many clinical situations, such as lesion detection and characterization, nodal staging, assessment of liver fibrosis and cirrhosis and monitoring of treatment response. Recently, DW MR imaging with ADC measurements has been used as a quantitative biomarker for the assessment of liver fibrosis and the predicting and monitoring of tumor response (1456789). Since patients eligible for the evaluation of treatment response usually undergo many follow-up studies with variable MR systems and sequence parameters, the direct comparison of ADC values from different systems or field strengths is unreliable (101112). In order to use the ADC value for assessing changes in the liver parenchyma and for predicting and/or monitoring therapeutic effects, ADC measurements must be standardized.
Differences in ADC values may be influenced by a number of factors involving the patient, hardware, acquisition-related parameters and artifacts related to the susceptibility effects of eddy currents (1314). To overcome these factors, many attempts have been made to standardize DW MR imaging protocols for various organs at different institutions (15). Recently, a volunteer study with ADC measurements from different vendors and different field strengths confirmed that ADC values of the gallbladder, pancreas, spleen and kidney may be comparable between different MR systems and field strengths (16). The effect of field strength on ADC measurements is of minor importance for 1.5- and 3.0-tesla (T) MR systems from the same vendor, although 1.5 T is recommended due to more robust comparability than with 3.0 T (16). Another study used the spleen for the normalization of ADC values at 1.5 T for differentiating between benign and malignant focal liver lesions (17). The spleen may be an ideal reference organ, since it provides relatively stable ADC values over various abnormalities, and is used when quantitative analysis using ratios is required (181920). However, a comparison of ADC values from 2 different 3.0 T MR systems in a patient cohort has not been carried out previously. Thus, the purpose of this study was to assess and compare the ADC values from 2 different 3.0 T MR systems and investigate the value of normalizing ADC values using the spleen as a reference organ.
MATERIALS AND METHODS
Study Population
This prospective study was approved by the research ethics committee of our hospital and signed written informed consent was obtained from all patients. Forty-one patients were recruited for the study between January 2014 and May 2014. The inclusion criteria for this study were: 1) patients with chronic liver disease who needed liver MRI for surveillance and 2) patients with focal liver lesions. The exclusion criteria included: 1) huge or multiple liver mass resulting in unattainable region-of-interest (ROI) measurements of the normal liver, 2) severe MR-related artifacts with poor image quality that was insufficient for image analysis, and 3) severe iron deposition in the liver.
MR Imaging Technique
Routine liver MR imaging was performed using one of two 3.0 T MR systems (Verio, Siemens Medical Solutions, Erlangen, Germany; Achieva TX, Philips Healthcare, Best, the Netherlands) with a 12-element body matrix coil and spine matrix coil (Verio), as well as a 32-channel flexible anteroposterior phased-array coil (Achieva). Liver MR examination consisted of coronal and axial single-shot T2-weighted fast spin-echo sequences, and a breath-hold axial T1-weighted dual echo (in-phase and opposed-phase) sequence. Axial T1-weighted three-dimensional-gradient recalled echo with volumetric interpolated breath-hold examination with fat saturation were performed before and repeated 5 times after (35, 70, and 180 seconds, and 10 and 20 minutes for the hepatobiliary phase [HBP]) the dynamic bolus injection of gadoxetic acid (Gd-EOB-DTPA; Eovist or Primovist; Bayer Shering Pharma, Berlin, Germany). Respiratory-triggered fat-suppressed T2-weighted fast spin-echo sequence and DWI were obtained between 180 seconds, 10-minute, and 20-minute in the delayed HBP.
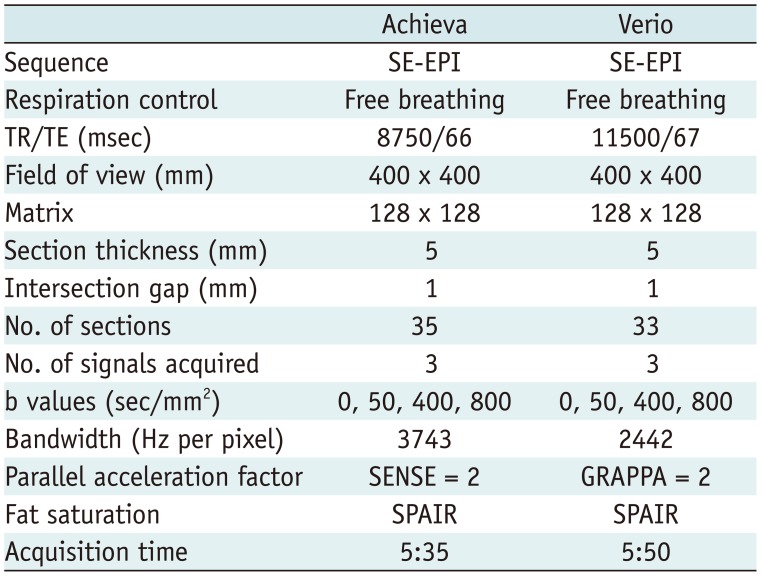
Additional DWI with different MR systems was performed after routine liver MR examination, within 10–100 minutes (mean, 41.3 minutes) after the first DWI. Additional DWI was performed on Achieva in 21 patients and Verio in 14 patients. DW MR imaging data from 2 MR systems were acquired during free breathing in all patients. The imaging parameters were kept constant across both MR systems to the extent possible. All patients underwent single-shot spin-echo echo-planar DWI in the axial view with 4 b values (0, 50, 400, and 800 s/mm2). Fat saturation was achieved with spectral adiabatic inversion recovery (Table 1).
Quantitative Image Analysis
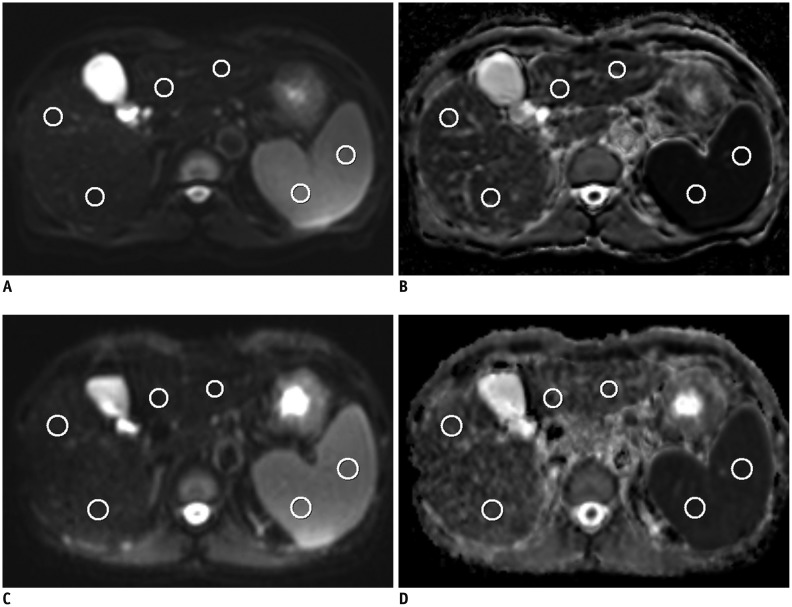
Apparent diffusion coefficient maps were automatically generated on the MR system's console using monoexponentially fitting of all 4 b values. A single radiologist drew ROIs for each DWI set and each anatomic region on the b = 0 s/mm2 images. Two image sets for each subject were viewed side-by-side for comparison, with ROIs placed in locations as similar as possible between scans. Care was taken to avoid vessels and artifacts in ROI placement. The size of the ROIs were variable according to each anatomic region and patient, but were kept constant between 2 image sets for each patient (range, 2–8 cm2). By applying the copy and paste function of the PACS system (Maroview 5.4; Marotech, Seoul, Korea), ROIs were identically positioned on corresponding ADC maps. The anatomic regions analyzed included the right and left liver lobes, spleen, pancreas and right and left kidneys. For the right and left liver lobes, 2 ROIs from 3 contiguous slices were measured with a central section obtained through the level of the right portal vein for the right lobe, and umbilical portion of the left portal vein for the left lobe. For the spleen, 2 ROIs from 3 contiguous slices were measured with a central section obtained through the level of the splenic hilum. For the pancreas, 2 ROIs were obtained from the head, body and tail of the pancreas; furthermore, since the pancreas is a particularly difficult organ to measure, magnification of DWI was used for better accuracy. ROIs of both kidneys were measured from 3 contiguous slices each with 2 ROIs positioned at the renal cortex, with a central section obtained through the level of the mid-pole. In 25 patients with focal liver lesions, 2 additional ROI measurements were carried out with free-hand drawings to include as much area as possible while avoiding areas of necrosis or hemorrhage in 2 consecutive slices. For patients with multiple lesions, the largest lesion was selected for ROI measurement. A total of 72 ROIs were drawn per patient without liver lesions and 76 ROIs were drawn per patient with liver lesion. All of the ROIs were copied to the corresponding ADC maps. However, 60 ROIs were not obtained due to atrophy of the left liver lobe (12 ROIs in 1 patient), splenectomy (36 ROIs in 3 patients), and fatty change of the pancreas (12 ROIs in 1 patient). A total of 2560 ROIs were measured and analyzed (Fig. 1). For the analysis of ADC values with normalization, ADC values of 5 anatomic regions and liver lesion were divided by ADC values of the spleen.
Statistical Analysis
The normality of distribution of the parameters was assessed using the Shapiro-Wilk test. All of the parameters except liver lesions showed normal distribution. Association between 2 ADCs and 2 normalized ADCs of 5 anatomic regions from different vendors were analyzed using Pearson's correlation coefficient. The correlation coefficient r was interpreted as follows: 0.00 to 0.30, negligible correlation; 0.30 to 0.50, low positive correlation; 0.50 to 0.70, moderate positive correlation; 0.70 to 0.90, high positive correlation; 0.90 to 1.00, very high positive correlation (21). Comparison of two ADCs and normalized ADCs of 5 anatomic regions from different vendors were analyzed using the paired sample t test. For analysis of the ADC and normalized ADC of the lesions, the Spearman correlation and Wilcoxon signed rank test were used for the association and comparison between 2 values, respectively. The Bland-Altman method was used to evaluate the agreement and the systematic bias of normalized ADCs. To assess variability of 2 different MR systems, the coefficient of variance (CV) was calculated as the standard deviation (SD) over the mean for both the ADC and normalized ADC of 5 anatomic regions and liver lesions. Wilcoxon signed rank test was used to compare the CV of non-normalized ADC and normalized ADC. Statistical analysis was performed using commercially available software (MedCalc, version 13.0.0.0, 2014; MedCalc, Mariakerke, Belgium). A p value of < 0.05 was considered significant.
RESULTS
Population Characteristics
Forty-one patients who agreed for additional DWI were enrolled in this study. Among them, 4 patients were excluded due to severe iron deposition in the liver. Two other patients were also excluded due to multiple hepatocellular carcinoma and multiple huge hepatic cysts. Thirty-five patients comprised the final study population (27 men and 8 women; mean age ± SD, 62.3 ± 12.3 years; age range, 24–81 years). Thirty patients had liver cirrhosis and 1 patient had chronic hepatitis. One patient was imaged for living donor evaluation and the other 3 patients were imaged due to incidentally detected liver masses.
Twenty-five patients had focal liver lesions (hepatocellular carcinoma = 20, intrahepatic cholangiocarcinoma = 2, hemangioma = 2, complicated cyst = 1). Two intrahepatic cholangiocarcinoma were pathologically confirmed by percutaneous needle biopsy and the other 23 lesions were confirmed based on typical imaging findings (22). The mean diameter ± SD of all 25 lesions were 46.2 ± 42.8 mm (range, 9–175 mm).
Comparison of ADC Values
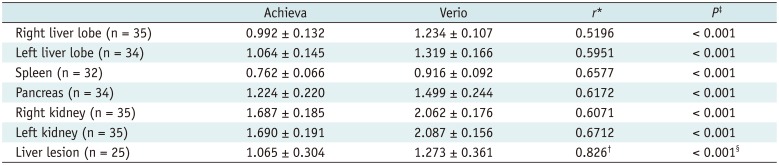
Apparent diffusion coefficient values of the spleen were lowest in both MR systems ([0.762 ± 0.066] × 10-3 mm2/s for Achieva and [0.916 ± 0.092] × 10-3 mm2/s for Verio). The highest ADC values were measured from the left kidney in both MR systems ([1.690 ± 0.191] × 10-3 mm2/s for Achieva and [2.087 ± 0.156] × 10-3 mm2/s for Verio). For all anatomical regions including the spleen, ADC values from both MR systems showed a moderate positive correlation with r ranging from 0.5196 to 0.6712 (p < 0.005). However, ADC values from both MR systems differed significantly in all anatomical regions (p < 0.001). For liver lesions, ADC values showed a high positive correlation (r = 0.826) but differed significantly (p < 0.001) (Table 2).
Comparison of ADC Values after Normalization
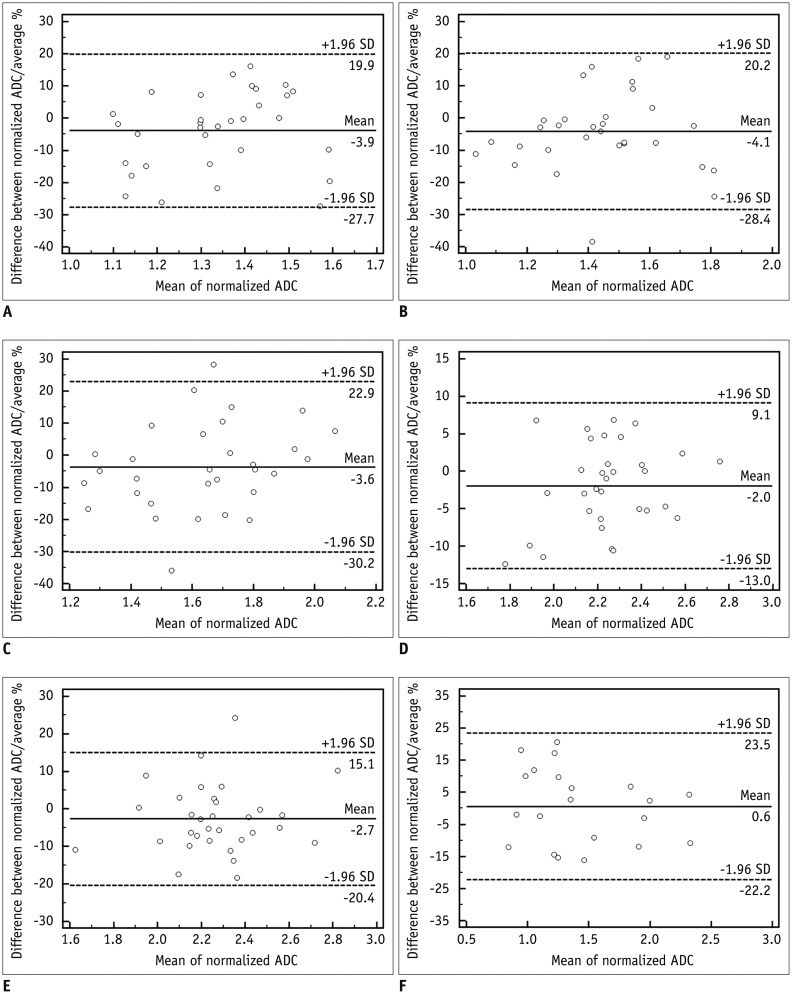
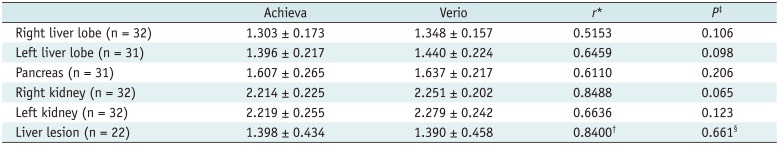
After normalization, the ADC from both MR systems showed a moderate to high positive correlation (r = 0.5153–0.8488, p < 0.005). There were no statistically significant differences between the normalized ADC of both MR systems. For liver lesions, the normalized ADC showed high positive correlation (r = 0.84) and did not differ significantly (p = 0.661) (Table 3). The limits of agreement (LOA) in percentage from the Bland-Altman method was -30.2–22.9% for 5 anatomical regions and -22.2–23.5% for liver lesions (Fig. 2).
CV Measurements
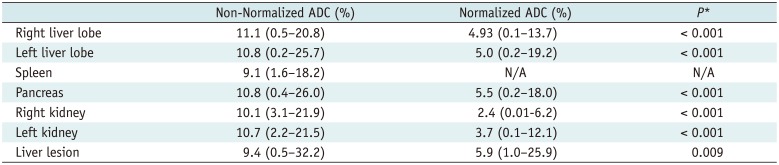
The mean CV of ADC of 5 anatomical regions and liver lesions ranged from 9.1% to 11.1%, with spleen showing the lowest CV and right liver lobe showing the highest CV. The mean CV of normalized ADC ranged from 2.38% to 5.9%, with right kidney showing the lowest CV and liver lesion showing the highest CV. The CVs differed significantly between non-normalized ADC and normalized ADC, with CV of normalized ADC being consistently lower than that of non-normalized ADC (Table 4).
DISCUSSION
Standardization and optimization of DW MRI protocols is required, in order to use quantitative methods of MRI to study abdominal lesions. Although various studies have been performed to validate the usefulness of ADC as an imaging biomarker, there is currently no method for standardizing ADC values from different MR systems. In addition, better reproducibility is needed for the use of ADC as a valuable quantitative tool. Recent studies have shown that acceptable reproducibility can be achieved with phantoms and in the upper abdomen of healthy volunteers and patients (10232425). In addition to good reproducibility, reliable interpretation of ADC values from different MR systems is required for longitudinal, multicenter studies (15).
In this study, we performed a direct comparison of the ADC values from 2 different 3.0 T MR systems from different vendors in a single patient cohort. Previous reports are restricted to healthy subjects with inter-vendor comparisons, inter-imager comparisons from the same vendor with different field strengths or intra-imager comparisons using the same field strength (101624). Thus, to our knowledge, this is the first study to evaluate the inter-imager variability from different vendors at 3.0 T, as well as the value of normalization. ADC values of 6 anatomic regions and liver lesions from 2 MR systems showed good correlation, although there were significant differences in the mean ADC values, with those from the Verio system being consistently higher than those from the Achieva system. In a recent study, Donati et al. (16) concluded that the ADC values of upper abdominal organs might be comparable between MR systems from different vendors and with different field strengths. Even though the overall CV was 28.6% at 1.5 T and 30.4% at 3.0 T, with the highest CV observed in the left liver lobe at 3.0 T, there was no significant effect of field strength on the mean ADC values. However, there were significant inter-vendor differences in 2 of 7 anatomic regions (left and right liver lobes) at 1.5 T and 4 of 7 anatomic regions (left liver lobe, pancreas, renal cortex, and medulla) at 3.0 T. In contrast, our study result showed that ADC values of all 6 anatomical regions differed significantly between the 3.0 T MR systems. These conflicting results may be attributed to the differences in the number of MR systems used for comparison (6 vs. 2), differences in the choice of b values (0, 1000 vs. 0, 50, 400, 800), and different study cohorts (healthy volunteers vs. mostly liver cirrhosis patients).
Apparent diffusion coefficient values with multiple b-value acquisitions result in better fit and are more reliable, as compared with 2 b-value acquisition, although the choice of b-value also affects the ADC values. In general, lower b-values (< 200 s/mm2) result in higher ADCs due to the microcapillary perfusion effect. On the other hand, higher b-values lead to lower ADCs as it reflects the true diffusion coefficient (2627). It is widely accepted that the combined use of lower b-values (< 200 s/mm2) and higher b-values with multiple b-value acquisitions result in more reliable and accurate ADC measurements (242829). Although free breathing techniques may be more prone to motion artifacts than respiratory-triggered techniques, we used free-breathing with multiple numbers of excitations and signal averaging to increase the signal-to-noise ratio for more precise ADC measurements with better image quality (3031). A recent study comparing multiple breath-hold, free-breathing, respiratory-triggered and navigator-triggered DW MR imaging showed that ADC measurement with the free-breathing method resulted in good reproducibility and shorter acquisition time, as compared with other methods (32).
We used the spleen as a reference organ for the normalization of ADC values acquired from 2 MR systems. The spleen is usually included in a scan range of abdominal MR imaging and is less prone to systemic disease, providing relatively consistent ADC values (1733). In our study, ADC values of the spleen showed the least variability as demonstrated by its lowest SD and CV over 6 anatomic regions. A study by Do et al. (20) showed that normalized liver ADC using the spleen as a reference organ was superior to absolute liver ADC in distinguishing between normal from fibrotic livers. ADCs of the spleen did not show significant differences based on the stage of liver fibrosis assessed by histopathologic analysis. However, the authors used breath-hold techniques with b values of 0, 50, and 500 s/mm2 at 1.5 T. The use of spleen as an internal standard tissue in another study (34), showed conflicting results from those of Do et al. In the other study, ADCs of the spleen differed significantly between healthy control subjects and those with Child-Pugh grade A to C. The authors concluded that the spleen might only be of limited value for the normalization of liver ADC, as cirrhosis and portal hypertension might have an impact on the ADC of the spleen. However, in their study clinical indicators were used to estimate the severity of cirrhosis and 50 healthy subjects were used as a control group, as compared to a relatively small group of patients with cirrhosis (Child-Pugh A = 35 patients, B = 11, C = 4), which might have biased the results; furthermore, b-values of 50, 300, and 600 s/mm2 at 1.5 T were used.
In the current study, the kidney or paraspinal muscles were not used as reference organs due to the following reasons. The kidney may be more prone to motion and susceptibility artifacts caused by adjacent bowels; furthermore, hepatorenal syndrome, a common complication of end-stage liver cirrhosis, could potentially affect the ADC values (34). In addition, the possibility of other confounding factors such as serum creatinine levels, hydronephrosis and renal artery stenosis prohibits the usage of kidney as a reference organ. Some investigators have proposed that the paraspinal muscle might be a good reference organ due to its uniform tissue composition and less variability in ADC, as compared to other abdominal organs (2434). However, the uniformity of the paraspinal muscle with low CV implies that it is less affected by diffusion-related parameters, and could remain relatively stable over various DW MR imaging platforms. In order for an organ to be used as a reference for ADC normalization, it must be affected in an identical manner by diffusion-related parameters as the target organ and/or lesion. Most abdominal organs are highly perfused with a rich vascular supply, and the liver is dual-supplied by the hepatic artery and portal vein. Thus, abdominal organs are largely affected by diffusion-related parameters, such as diffusion gradient, vendor-specific MR platforms, and most importantly, the choice of b-values. If the paraspinal muscle is used as a reference organ, the normalized ADCs of the abdominal organs between different MR platforms or acquisition parameters may result in poor agreement. Further studies for more precise comparison and analysis are needed.
The LOAs of normalized ADCs in 5 anatomic regions in terms of percentages were -30.2–22.9%, with the right kidney showing the narrowest LOA (-13–9.1%) and the pancreas showing the widest LOA (-30.2–22.9%). The LOAs of the normalized ADCs of the liver lesions were -22.2–23.5%. These findings were in agreement with previous studies (163235). Although we did not evaluate the reproducibility/repeatability of ADC measurement, we used the Bland-Altman method to analyze the range of differences between 2 normalized ADCs. Thus, measured values over 30% should be regarded as a significant change. In addition, CVs of normalized ADC was significantly lower than that of non-normalized ADC, suggesting that normalized ADC reduced the inter-vendor variability, as compared to non-normalized ADC. In other words, the normalized ADC could be considered as an imaging biomarker in longitudinal, multicenter studies using different 3.0 T MR systems.
Our study had several limitations. First, the reproducibility and inter-observer agreement regarding ADC measurements were not evaluated because these are acceptable according to previous studies (162532). Second, we did not evaluate the image quality, since blinding the 2 images was impossible due to differences in overall appearance. However, the main purpose of our study was to quantitatively compare ADC values. Third, we acquired the DW MR imaging after the administration of gadoxetic acid, with variable interval between the 2 images. Although the effect of gadoxetic acid in DW MR imaging can be ignored up to 20 minutes post-injection (3637), longer intervals have not been evaluated and the potential effects of gadoxetic acid might have biased our result.
In conclusion, the ADC values of the upper abdominal organs from different 3.0 T MR systems differed significantly despite good correlation. The use of the spleen as a reference organ for the normalization of ADC, reduces the differences between different MR systems and could facilitate consistent use of ADC as an imaging biomarker for multi-center, longitudinal studies. Larger, prospective multicenter studies to verify our results are warranted.
 XML Download