Journal List > Korean J Radiol > v.17(1) > 1027189

Lee, Lee, Kim, and Lee: Importance of Contrast-Enhanced Fluid-Attenuated Inversion Recovery Magnetic Resonance Imaging in Various Intracranial Pathologic Conditions

Abstract

Intracranial lesions may show contrast enhancement through various mechanisms that are closely associated with the disease process. The preferred magnetic resonance sequence in contrast imaging is T1-weighted imaging (T1WI) at most institutions. However, lesion enhancement is occasionally inconspicuous on T1WI. Although fluid-attenuated inversion recovery (FLAIR) sequences are commonly considered as T2-weighted imaging with dark cerebrospinal fluid, they also show mild T1-weighted contrast, which is responsible for the contrast enhancement. For several years, FLAIR imaging has been successfully incorporated as a routine sequence at our institution for contrast-enhanced (CE) brain imaging in detecting various intracranial diseases. In this pictorial essay, we describe and illustrate the diagnostic importance of CE-FLAIR imaging in various intracranial pathologic conditions.

INTRODUCTION

Fluid-attenuated inversion recovery (FLAIR) is a special inversion recovery pulse sequence with a long repetition time (TR) and echo time (TE), and an inversion time (TI) that effectively nulls signals from the cerebrospinal fluid (CSF) (123). Although FLAIR images are heavily T2-weighted images (T2WI), contrast enhancement on FLAIR imaging is the result of a mild T1 effect that is produced by the long TI; thus, lesions that show enhancement on contrast-enhanced T1-weighted imaging (CE-T1WI) also show enhancement on contrast-enhanced FLAIR (CE-FLAIR) images.
Many clinical studies have shown that CE-FLAIR offers more information than CE-T1WI alone. This article describes the diagnostic importance of CE-FLAIR imaging for various intracranial pathologic conditions, as well as normally enhancing structures on CE-FLAIR imaging. Additionally, some distinctive conditions detected following gadolinium (Gd) administration such as the hyperintense acute reperfusion marker (HARM) and Gd encephalopathy related to renal failure will be discussed.

Underlying Mechanism of Gadolinium Enhancement

Intravenous magnetic resonance (MR) contrast agents are frequently used to improve lesion detection and characterization of central nervous system (CNS) disorders. The commonly used contrast agent, Gd, shortens both the T1 and T2 relaxation times of tissues in which it has accumulated. However, lesion contrast enhancement is caused predominantly by the T1-shortening effect at clinical doses (4567). Contrast enhancement in the CNS is the result of a combination of 3 processes: for intra-axial brain lesions, the blood brain barrier (BBB) must be disrupted for Gd to enter the extracellular space; for extra-axial lesions, enhancement is observed in lesions with relatively high vascularity; and for leptomeningeal regions, contrast leakage occurs from vessels into the CSF (891011). Although T1WI is typically used for post contrast examinations, CE-FLAIR is increasingly used currently.
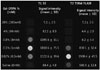
The differences in enhancement characteristics between CE-T1WI and CE-FLAIR images have been shown in previous studies, and can be explained by a combination of a different T1-shortening effect at a certain concentration of Gd and a different T2 effect according to the vascularity of a lesion (5101213). Although Gd concentration alone cannot explain all the phenomena of intracranial enhancement in vivo, our phantom study (Fig. 1) showed that, the FLAIR sequence was more sensitive to T1 shortening than T1WI at lower concentrations of Gd, while the FLAIR sequence was sensitive to T2 effects at high Gd concentrations. This indicates that faintly enhancing lesions on CE-T1WI might be depicted more clearly on CE-FLAIR images, but marked enhancing lesions with large Gd accumulation show no enhancement on FLAIR images because the signal-reducing T2 effects obscure the signal-enhancing T1 effects. In addition, unlike CE-T1WI, CE-FLAIR images do not show contrast enhancement in normal vascular structures and normal meninges (4514). Therefore, CE-FLAIR images are highly effective in the detection of sulcal or meningeal infection, inflammation and metastases that abut the border of the CSF. However, in CE-FLAIR imaging alone, the observed hyperintensity lesion may be due to either T2 lengthening or T1 shortening, thus limiting the usefulness of the FLAIR sequence. Therefore, the FLAIR sequence should be performed with both pre- and post-contrast scans (456).

Contrast Enhanced MRI Protocol

In our study, contrast agent (gadobutrol [Gadovist]; Bayer Healthcare, Berlin, Germany) was administered at the standard dose of 0.1 mmol/kg of body weight. Postcontrast images were obtained shortly after contrast material administration. For each patient, the MR imaging was performed using 1.5T scanner (Avanto; Siemens Medical Solution, Erlangen, Germany) or 3T scanner (Skyra; Siemens Medical Solution, Erlangen, Germany). The MR imaging parameters for the FLAIR images were 4780-9000/93-124/1745-2497 ms/150°/320-384 × 196-235 (TR/TE/TI/flip angle/matrix). The other parameters were as follows: section thickness of 5 mm with a 2 mm gap, field of view of 193 × 220 mm, number of excitations of 2; and the acquisition time was 2 minutes 33 seconds and 2 minutes 42 seconds, respectively. Axial CE-FLAIR imaging in all patients was performed immediately after the routine CE-coronal and axial T1WI. Scanning of axial CE-T1WI and axial CE-FLAIR imaging was started at 2 minutes 40 seconds, and 5 minutes after the injection of contrast material, respectively. Although previous studies suggested some benefits of delayed CE imaging (151617), we did not acquire additional delayed FLAIR images.

Normal Enhancement on CE-FLAIR Imaging

Understanding the normally enhancing structures on CE-FLAIR imaging can provide a reference point for routine interpretation (18). However, literature on the evaluation of the normal pattern of enhancement on CE-FLAIR imaging in the adult brain is rare.
According to our experience and previous reports in children, the choroid plexus, pituitary infundibulum and cavernous sinus show relatively intense enhancement, and the pituitary gland, pineal gland and nasal mucosa/turbinates are mildly enhanced (Fig. 2). However, unlike CE-T1WI, FLAIR enhancement in the pineal gland, pituitary gland and nasal mucosa/turbinates can be difficult to recognize, or show subtle changes due to intrinsic T2 prolongation on pre-contrast FLAIR images. On CE-FLAIR imaging, most blood vessels do not show enhancement, probably due to a T2 effect of the FLAIR sequence. Additionally, the degree of enhancement in normal intracranial structures on CE-FLAIR imaging appears less intense than that on CE-T1WI, probably because of a mild T1 effect of FLAIR imaging.

Parenchymal Lesions

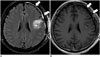
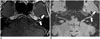
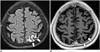
Contrast-enhanced-FLAIR imaging has several advantages for the detection of superficial parenchymal lesions and brain metastasis. Suppression of the CSF signal, no or minimal enhancement of blood vessels, reduction of phase-shift artifacts derived from enhanced blood vessels or dural sinuses, and better detection of peritumoral edema make lesions more conspicuous, and these features can be exploited in the detection of superficial lesions and metastatic tumors over CE-T1WI (519202122).
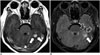
However, the potential pitfall of CE-FLAIR imaging in enhancing parenchymal tumors includes the difficulty to differentiate lesion enhancement versus hyperintense lesions with long T2 relaxation times. On CE-T1WI, it is easier to detect enhancing lesions surrounded by a hypointense edematous area. In addition, large Gd accumulated lesion may not demonstrate enhancement on CE-FLAIR images because the signal-reducing T2 effects obscure the signal-enhancing T1 effects. Hence, for intraparenchymal tumors, CE-T1WI can be superior to CE-FLAIR imaging for detecting the breakdown of the BBB (Fig. 3) (561220232425).

Leptomeningeal Lesions

Infection

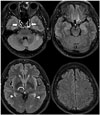
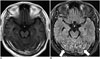
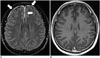
Infectious meningitis is the most common form of CNS infection. Although the diagnosis of infectious meningitis is still based on CSF examination, imaging studies such as magnetic resonance imaging (MRI) have been used increasingly not only for imaging diagnosis but also for monitoring the associated complications. CE-FLAIR imaging is more effective than CE-T1WI because it does not demonstrate enhancement in the normal vascular structures or normal meninges that can be confused with abnormal meningeal enhancement on CE-T1WI. Additionally, CE-FLAIR is more sensitive to lower Gd concentrations due to its extreme sensitivity to minimal modification of the CSF composition (Fig. 4) (51018262728293031).

Neoplastic Spread into the Subarachnoid Space (Primary and Metastatic Tumors)

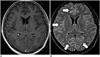
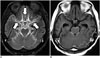
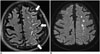
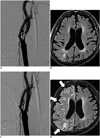
Likewise, the most specific diagnostic test for leptomeningeal carcinomatosis has been cytologic examination of CSF. However, this test often produces false-negative results. MRI, particularly CE-T1WI, has been used as a reliable technique for confirming diagnoses and assessing the extent of a lesion and its response to therapy. However, CE-FLAIR images show superiority for the detection of leptomeningeal disease (Figs. 5, 6). Therefore, the combination of unenhanced FLAIR and CE-FLAIR images can be a useful adjunct to CE-T1WI for the evaluation of leptomeningeal carcinomatosis (5101415182332).

Sturge-Weber Syndrome

Contrast-enhanced-FLAIR imaging is helpful in depicting leptomeningeal angiomatosis in patients with Sturge-Weber syndrome. The major advantage of CE-FLAIR imaging over CE-T1WI is the lack of enhancement in the normal vascular structures. CE-FLAIR imaging also provides better visualization of the lesion in Sturge-Weber syndrome with more extensive leptomeningeal enhancement than CE-T1WI on the clinically suspected side (Fig. 7). Furthermore, CE-FLAIR imaging is helpful in detecting mild disease and unexpected bilateral disease (1833).

Rheumatoid Arthritis-Associated Leptomeningeal Disease

Rheumatoid leptomeningitis is a rare but serious complication of rheumatoid arthritis. Characteristic MRI findings are high signal intensity lesions in the subarachnoid spaces on FLAIR images or diffusion-weighted images (DWIs) and meningeal thickening with enhancement (Fig. 8). Leptomeningeal abnormalities are relatively focal in most cases. The basal cisterns are usually not affected in previously reported cases. CE-FLAIR imaging aids in the early diagnosis of leptomeningeal abnormalities in rheumatoid arthritis patients with CNS involvement because it shows more prominent enhancement than CE-T1WI. Additionally, the presence of serum anti-cyclic citrullinated peptide antibodies may be helpful in making the diagnosis (343536).

Pachymeningeal Lesions

Normal dura mater shows subtle thin and discontinuous enhancement that is prominent at the parasagittal location on CE-T1WI due to the lack of sufficient water to generate the T1 shortening required for avid enhancement. Abnormal meningeal enhancement is usually asymmetrical, thick, nodular and continuous, and extends deep into the sulcal bases (93738).

Postoperative Changes

Patients who have undergone intracranial surgery show postoperative dural enhancement. The enhancement is smooth and linear and can be seen as soon as 9 hours after surgery (Fig. 9). Moderate or marked dural enhancement was noted in all patients within 3 months after surgery with approximately 50% decrease in enhancement 1-2 years thereafter (93940). CE-FLAIR images demonstrate more extensive and persistent dural enhancement than CE-T1WI.

Trauma

Post-traumatic dural enhancement implies considerable head injury, although there is no obvious traumatic brain lesion on routine sequences. CE-FLAIR images are highly effective for detection of dural enhancement in patients with acute or chronic head injury, as compared with CE-T1WI. Even minor lacerations that cause bleeding into the CSF are sufficient to induce contrast enhancement on CE-FLAIR images (Fig. 10). Radiologists should focus on detecting traumatic brain lesions such as a small amount of subdural hemorrhage or subarachnoid hemorrhage, in cases with abnormal dural enhancement on CE-FLAIR imaging. Additionally, this finding could be more important in cases of suspected intracranial injury caused by child abuse because subdural hemorrhage is the most frequently detected form of intracranial abnormality in these patients (184142).

Dural Metastatic Lesions

The cancers associated with dural metastases are breast cancer, lung cancer, prostate cancer, and lymphoma. Dural metastases usually occur as an extension of the tumor to the dura from the adjacent calvarial metastases. Isolated dural metastases are relatively rare (434445). Imaging findings of dural metastases appear as focal nodular or diffuse enhancing dural masses. CE-FLAIR imaging has diagnostic potential equivalent to that of conventional CE-T1WI (Fig. 11) (46).

Meningioma

Meningiomas are the most common extra-axial tumors in the brain. CE-FLAIR imaging demonstrates a typical peripheral enhancement pattern related to the dual vascular supply of the tumor that is more commonly seen in larger meningiomas (> 2 cm in diameter). The highly vascular central part of the meningioma, supplied by meningeal arteries, enhances strongly on CE-T1WI, while a high concentration of Gd in the central part induces signal loss on CE-FLAIR imaging. The less vascular capsule, supplied by pial arteries, may have a lower concentration of Gd, resulting in peripheral contrast enhancement on CE-FLAIR imaging (Fig. 12). However, in tumors less than 2 cm in diameter, this effect is masked and only homogeneous enhancement is shown (474849).

Cranial Nerve Lesions

Diagnosis of Facial Neuritis

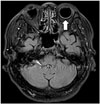
Contrast-enhanced T1WI plays a limited role in the evaluation of facial neuritis due to prominent normal facial nerve enhancement. The geniculate ganglion, greater superficial petrosal nerve, and proximal tympanic and mastoid segments of the normal facial nerve can be enhanced due to the flux of contrast material in the arteriovenous plexus (AVP) along the facial nerve (5051). Thus, evaluation of the pathologic enhancement of the nerves from the breakdown of the blood nerve barrier can be inhibited. CE-FLAIR imaging has an advantage over the CE-T1WI in the evaluation of the pathologic enhancement of the facial nerve because prominent enhancing AVP surrounding the normal facial nerve is no longer visible on CE-FLAIR imaging due to flow-related signal loss and high Gd concentrations in the AVP. Therefore, enhancement of the canalicular and anterior genu segments are significantly correlated with the presence of facial palsy on CE-FLAIR images (Fig. 13) (5253).

Hyperintense Acute Reperfusion Marker (HARM)

Hyperintense acute reperfusion marker describes an imaging phenomenon of enhancement of the subarachnoid CSF space, not enhancement of the parenchyma, on FLAIR imaging, and is caused by leakage of Gd through a disrupted BBB. It has been described in various clinical conditions, including acute ischemic stroke, endovascular treatment for severe carotid artery stenosis and cardiac surgery.

HARM Sign after Acute Ischemic Stroke

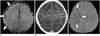
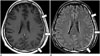
Hyperintense acute reperfusion marker was found in 30-40% of patients with acute stroke and approximately 20% of patients with transient ischemic attack without DWI lesions (Fig. 14). It is reportedly associated with age, reperfusion, thrombolysis, endovascular procedures, increased matrix metalloproteinases, higher Gd dosage and reduced kidney function (135455565758596061). While some studies show an increased risk of hemorrhagic transformation in patients with HARM (5456), recent studies do not show this association (6162).

HARM after Carotid Stent Insertion

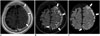
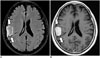
Hyperintense acute reperfusion marker was found in approximately 60% of patients after carotid artery stenting (CAS) (Fig. 15). The physiologic mechanism of delayed CSF enhancement after CAS is not obvious. However, previous studies have suggested that changes in BBB integrity due to sudden poststenting hemodynamic changes or reperfusion injury resulting from ischemic intolerance may be related to BBB disruption and the development of delayed CSF space enhancement after CAS. The majority of HARM after CAS is transient and not associated with the sudden development of neurological symptoms (636465).

HARM after Cardiac Surgery

Hyperintense acute reperfusion marker was found in approximately 50% of patients after cardiac surgery, and 75% of the patients have acute lesions on DWI. The proposed mechanisms for BBB disruption after cardiac surgery are ischemia due to hypoperfusion, activation of inflammatory cascades and proteolytic enzymes. The incidence of HARM was higher in patients who received Gd during the first 24 hours after surgery (6667).

Diabetic Retinopathy

Contrast-enhanced FLAIR images can demonstrate ocular enhancement that is most commonly associated with diabetes. In patients with diabetic retinopathy, blood vessels in the retina may swell and leak fluid, presumably inducing contrast enhancement (Fig. 16). Despite the few studies on the clinical importance of this ocular enhancement, it might correspond to the development of diabetic retinopathy (5).

Hyperglycemia-Induced Seizures

Patients with seizures in nonketotic hyperglycemia may have transient MRI abnormalities that are characterized by subcortical T2 hypointensity with overlying cortical or leptomeningeal enhancement in addition to cortical swelling. Enhancement of the leptomeninges likely occurs due to seizure-induced dilatation of leptomeningeal vasculatures, and cortical enhancement is believed to be the result of seizure-induced hypoxia and acidosis with alteration of vascular permeability and breakdown of the BBB (6869). CE-FLAIR is superior to CE-T1WI for the detection of focal cortical or leptomeningeal enhancement because CE-FLAIR images do not show contrast enhancement in normal vascular structures and normal meninges (Fig. 17).

Gd Encephalopathy Related to Renal Failure

Following Gd administration, patients with renal insufficiency can show CSF hyperintensity on FLAIR imaging due to diffusion of Gd into the CSF. Gd chelates are excreted mainly by glomerular filtration. In patients with renal impairment, the mean elimination half-life increases in relation to the degree of renal compromise. Because free Gd is a potent toxin, commercial MR contrast agents use Gd complexed with chelates to minimize free Gd levels in the serum. However, complexes undergo dissociation to release free Gd if they are retained for a prolonged duration in the circulation. Therefore, if renal function is compromised, Gd can accumulate to toxic levels and produce neurotoxicity (seizures or headache), although the reported rate of Gd neurotoxicity in patients with renal failure is < 1%. The recognition that patients with renal failure can show increased signal intensity in the CSF may prevent diagnostic errors such as subarachnoid hemorrhage, meningitis, meningeal carcinomatosis or leptomeningeal metastasis (707172737475).

CONCLUSION

Contrast-enhanced FLAIR imaging has many advantages for intracranial disease manifestations. CE-FLAIR imaging may be used as a primary or adjunctive sequence to CE-T1WI in equivocal cases to increase the diagnostic confidence and improve patient care.

Figures and Tables

Fig. 1

Phantom study using increasing concentrations of Gd-DTPA on T1WI and FLAIR imaging.

FLAIR imaging demonstrates higher signal intensity at 0.02% Gd-DTPA than T1WI and lower signal intensity at 0.1%, 0.8%, and 4% Gd-DTPA. These findings indicate that FLAIR sequence is more sensitive than T1WI images at lower concentrations of Gd. FLAIR and T1WI was obtained using same parameters as with patients. T1WI (TE = 9 ms, TR = 1800 ms, TI = 1745 ms); FLAIR (TE = 124 ms, TR = 9000 ms, TI = 2497 ms). FLAIR = fluid-attenuated inversion recovery, Gd = gadolinium, SD = standard deviation, TE = echo time, TI = inversion time, TR = repetition time, T1WI = T1-weighted imaging
kjr-17-127-g001
Fig. 2

Normal enhancement on CE-FLAIR imaging.

There is normally strong enhancement in choroid plexuses (arrowheads), pituitary infundibulum (empty arrow) and cavernous sinuses (solid arrows). Mild enhancement in pineal gland (curved arrow) is also noted. Most blood vessels are poorly enhanced. CE-FLAIR = contrast-enhanced fluid-attenuated inversion recovery
kjr-17-127-g002
Fig. 3

Parenchymal metastasis from breast cancer.

FLAIR MR imaging is limited regarding enhancing lesions with prominent surrounding edema. CE-T1WI (A) depicts enhancing lesion (arrows) in left cerebellar hemisphere more clearly because surrounding edema is hypointense. CE-FLAIR imaging (B) depicts edema (empty arrows) as hyperintense, reducing lesion-to-background contrast of metastasis (solid arrow). CE = contrast-enhanced, FLAIR = fluid-attenuated inversion recovery, T1WI = T1-weighted imaging
kjr-17-127-g003
Fig. 4

Viral meningoencephalitis.

CE-T1WI (A) depicts subtle leptomeningeal enhancement. It is difficult to discriminate between vessels and leptomeningeal lesions. CE-FLAIR imaging (B) depicts leptomeningeal enhancement (arrows) more definitely. Follow-up CE-FLAIR imaging 8 days later with acyclovir therapy shows remarkable improvement of leptomeningeal enhancement (not shown). CE = contrast-enhanced, FLAIR = fluid-attenuated inversion recovery, T1WI = T1-weighted imaging
kjr-17-127-g004
Fig. 5

Leptomeningeal metastasis from lung cancer.

CE-T1WI (A) depicts subtle leptomeningeal enhancement, while CE-FLAIR imaging (B) depicts leptomeningeal enhancement (arrows) more definitely. CE = contrast-enhanced, FLAIR = fluid-attenuated inversion recovery, T1WI = T1-weighted imaging
kjr-17-127-g005
Fig. 6

Bithalamic glioblastoma with extensive CSF dissemination.

CE-FLAIR imaging (A) depicts more definite leptomeningeal enhancement (arrows) than CE-T1WI (B). Bithalamic inhomogeneous enhancing masses are noted and confirmed histologically as glioblastoma (not shown). CE = contrast-enhanced, FLAIR = fluid-attenuated inversion recovery, T1WI = T1-weighted imaging
kjr-17-127-g006
Fig. 7

14-day-old male with clinically right-sided Sturge-Weber syndrome.

CE-FLAIR imaging (A) shows more definite leptomeningeal enhancement (arrows) along right cerebral surface than CE-T1WI (B). It is difficult to discriminate between vessels and leptomeningeal lesions on CE-T1WI. Follow-up susceptibility-weighted imaging 2 years later (C) shows enlarged, tortuous medullary veins (arrows) draining into subependymal veins. CE = contrast-enhanced, FLAIR = fluid-attenuated inversion recovery, T1WI = T1-weighted imaging
kjr-17-127-g007
Fig. 8

Rheumatoid arthritis-associated leptomeningeal disease.

CE-T1WI (A) show leptomeningeal enhancement (arrows) along left high cerebral hemisphere. CE-FLAIR imaging (B) shows more diffuse leptomeningeal enhancement (arrows) along left high cerebral hemisphere with high signal intensities on DWI (C, arrows). CE-T1WI is inferior to CE-FLAIR imaging for detecting enhancement in lesion. CE = contrast-enhanced, DWI = diffusion-weighted image, FLAIR = fluid-attenuated inversion recovery, T1WI = T1-weighted imaging
kjr-17-127-g008
Fig. 9

Postoperative dural enhancement after surgery of cavernous hemangioma.

CE-FLAIR imaging obtained 2 days after surgery (A) shows more definite postoperative dural enhancement (arrows) along left craniotomy site than CE-T1WI (B, arrows). CE = contrast-enhanced, FLAIR = fluid-attenuated inversion recovery, T1WI = T1-weighted imaging
kjr-17-127-g009
Fig. 10

Abnormal dural enhancement related to trauma.

CE-FLAIR imaging (A) shows more definite dural enhancement (arrows) along both frontal surface and anterior falx cerebri than CE-T1WI (B). There is no evidence of extra-axial hemorrhage on SWI (not shown). CE = contrast-enhanced, FLAIR = fluid-attenuated inversion recovery, SWI = susceptibility-weighted imaging, T1WI = T1-weighted imaging
kjr-17-127-g010
Fig. 11

Dural metastasis from breast cancer.

There is diffuse uneven dural enhancement (arrows) along left cerebral surface on both CE-T1WI (A) and CE-FLAIR imaging (B). Dural metastatic lesion demonstrates approximately equal contrast enhancement with both sequences. CE = contrast-enhanced, FLAIR = fluid-attenuated inversion recovery, T1WI = T1-weighted imaging
kjr-17-127-g011
Fig. 12

Meningioma of fibroblastic type, WHO grade 1.

Peripheral rim enhancement in right parietal extra-axial mass is seen on CE-FLAIR imaging (A, arrows), as compared with homogeneous enhancement pattern on CE-T1WI (B, arrows). CE = contrast-enhanced, FLAIR = fluid-attenuated inversion recovery, T1WI = T1-weighted imaging, WHO = World Health Organization
kjr-17-127-g012
Fig. 13

Left facial neuritis.

On CE-T1WI (A), blurred abnormal enhancement (arrows) in canalicular, labyrinthine, and anterior genu segments of left facial nerve is noted. CE-FLAIR imaging (B) shows more definite abnormal enhancement of left facial nerve (arrows). CE = contrast-enhanced, FLAIR = fluid-attenuated inversion recovery, T1WI = T1-weighted imaging
kjr-17-127-g013
Fig. 14

Extensive HARM sign related to acute ischemic stroke.

On CE-FLAIR imaging (A), extensive positive HARM sign (arrows) adjacent to acute infarcted lesions of left centrum semiovale on DWI (B) is noted. There is no evidence of significant hemorrhagic transformation on SWI (not shown). CE = contrast-enhanced, DWI = diffusion-weighted image, FLAIR = fluid-attenuated inversion recovery, HARM = hyperintense acute reperfusion marker, SWI = susceptibility-weighted imaging
kjr-17-127-g014
Fig. 15

HARM after stent insertion for severe stenosis of right ICA bulb.

Initial pre-stenting conventional angiography and CE-FLAIR imaging (A, B) and post-stenting conventional angiography and immediate post-stenting CE-FLAIR imaging (C, D). Filter-based embolic capture guidewire was used to prevent cerebral embolization. On post-stenting CE-FLAIR imaging, diffuse leptomeningeal enhancement (arrows) overlying right cerebral hemisphere was newly detected. Patient showed mild left side motor weakness, which showed complete recovery at follow-up. CE = contrast-enhanced, FLAIR = fluid-attenuated inversion recovery, HARM = hyperintense acute reperfusion marker, ICA = internal carotid artery
kjr-17-127-g015
Fig. 16

Diabetic retinopathy.

CE-FLAIR imaging depicts obvious left ocular enhancement (arrow) with no significant visual symptom. CE-FLAIR = contrast-enhanced fluid-attenuated inversion recovery
kjr-17-127-g016
Fig. 17

Seizures associated with nonketotic hyperglycemia.

CE-FLAIR imaging (A) depicts focal subcortical hypointensity with overlying prominent cortical and leptomeningeal enhancement (arrows) in left parietal area. CE-T1WI (B) shows inferior enhancement (arrows) to CE-FLAIR imaging. Follow-up CE-FLAIR images 6 weeks later show remarkable resolution of subcortical hypointense lesion and abnormal enhancement (not shown). CE = contrast-enhanced, FLAIR = fluid-attenuated inversion recovery, T1WI = T1-weighted imaging
kjr-17-127-g017

Acknowledgments

We thank Yong Su Han, an MR technologist at the Dongguk University Ilsan Hospital for assistance in our phantom study.

References

1. De Coene B, Hajnal JV, Gatehouse P, Longmore DB, White SJ, Oatridge A, et al. MR of the brain using fluid-attenuated inversion recovery (FLAIR) pulse sequences. AJNR Am J Neuroradiol. 1992; 13:1555–1564.
2. Rydberg JN, Hammond CA, Grimm RC, Erickson BJ, Jack CR Jr, Huston J 3rd, et al. Initial clinical experience in MR imaging of the brain with a fast fluid-attenuated inversion-recovery pulse sequence. Radiology. 1994; 193:173–180.
3. Hajnal JV, Bryant DJ, Kasuboski L, Pattany PM, De Coene B, Lewis PD, et al. Use of fluid attenuated inversion recovery (FLAIR) pulse sequences in MRI of the brain. J Comput Assist Tomogr. 1992; 16:841–844.
4. Essig M, Knopp MV, Schoenberg SO, Hawighorst H, Wenz F, Debus J, et al. Cerebral gliomas and metastases: assessment with contrast-enhanced fast fluid-attenuated inversion-recovery MR imaging. Radiology. 1999; 210:551–557.
5. Mathews VP, Caldemeyer KS, Lowe MJ, Greenspan SL, Weber DM, Ulmer JL. Brain: gadolinium-enhanced fast fluid-attenuated inversion-recovery MR imaging. Radiology. 1999; 211:257–263.
6. Melhem ER, Bert RJ, Walker RE. Usefulness of optimized gadolinium-enhanced fast fluid-attenuated inversion recovery MR imaging in revealing lesions of the brain. AJR Am J Roentgenol. 1998; 171:803–807.
7. Mathews VP, Caldemeyer KS, Ulmer JL, Nguyen H, Yuh WT. Effects of contrast dose, delayed imaging, and magnetization transfer saturation on gadolinium-enhanced MR imaging of brain lesions. J Magn Reson Imaging. 1997; 7:14–22.
8. Sage MR, Wilson AJ, Scroop R. Contrast media and the brain. The basis of CT and MR imaging enhancement. Neuroimaging Clin N Am. 1998; 8:695–707.
9. Smirniotopoulos JG, Murphy FM, Rushing EJ, Rees JH, Schroeder JW. Patterns of contrast enhancement in the brain and meninges. Radiographics. 2007; 27:525–551.
10. Fukuoka H, Hirai T, Okuda T, Shigematsu Y, Sasao A, Kimura E, et al. Comparison of the added value of contrast-enhanced 3D fluid-attenuated inversion recovery and magnetization-prepared rapid acquisition of gradient echo sequences in relation to conventional postcontrast T1-weighted images for the evaluation of leptomeningeal diseases at 3T. AJNR Am J Neuroradiol. 2010; 31:868–873.
11. Bozzao A, Floris R, Fasoli F, Fantozzi LM, Colonnese C, Simonetti G. Cerebrospinal fluid changes after intravenous injection of gadolinium chelate: assessment by FLAIR MR imaging. Eur Radiol. 2003; 13:592–597.
12. Kim EY, Kim SS, Na DG, Roh HG, Ryoo JW, Kim HK. Sulcal hyperintensity on fluid-attenuated inversion recovery imaging in acute ischemic stroke patients treated with intra-arterial thrombolysis: iodinated contrast media as its possible cause and the association with hemorrhagic transformation. J Comput Assist Tomogr. 2005; 29:264–269.
13. Köhrmann M, Struffert T, Frenzel T, Schwab S, Doerfler A. The hyperintense acute reperfusion marker on fluid-attenuated inversion recovery magnetic resonance imaging is caused by gadolinium in the cerebrospinal fluid. Stroke. 2012; 43:259–261.
14. Tsuchiya K, Katase S, Yoshino A, Hachiya J. FLAIR MR imaging for diagnosing intracranial meningeal carcinomatosis. AJR Am J Roentgenol. 2001; 176:1585–1588.
15. Kremer S, Abu Eid M, Bierry G, Bogorin A, Koob M, Dietemann JL, et al. Accuracy of delayed post-contrast FLAIR MR imaging for the diagnosis of leptomeningeal infectious or tumoral diseases. J Neuroradiol. 2006; 33:285–291.
16. Jeon JY, Choi JW, Roh HG, Moon WJ. Effect of imaging time in the magnetic resonance detection of intracerebral metastases using single dose gadobutrol. Korean J Radiol. 2014; 15:145–150.
17. Bagheri MH, Meshksar A, Nabavizadeh SA, Borhani-Haghighi A, Ashjazadeh N, Nikseresht AR. Diagnostic value of contrast-enhanced fluid-attenuated inversion-recovery and delayed contrast-enhanced brain MRI in multiple sclerosis. Acad Radiol. 2008; 15:15–23.
18. Goo HW, Choi CG. Post-contrast FLAIR MR imaging of the brain in children: normal and abnormal intracranial enhancement. Pediatr Radiol. 2003; 33:843–849.
19. Essig M, Schoenberg SO, Debus J, van Kaick G. Disappearance of tumor contrast on contrast-enhanced FLAIR imaging of cerebral gliomas. Magn Reson Imaging. 2000; 18:513–518.
20. Terae S, Yoshida D, Kudo K, Tha KK, Fujino M, Miyasaka K. Contrast-enhanced FLAIR imaging in combination with pre- and postcontrast magnetization transfer T1-weighted imaging: usefulness in the evaluation of brain metastases. J Magn Reson Imaging. 2007; 25:479–487.
21. Tomura N, Narita K, Takahashi S, Otani T, Sakuma I, Yasuda K, et al. Contrast-enhanced multi-shot echo-planar FLAIR in the depiction of metastatic tumors of the brain: comparison with contrast-enhanced spin-echo T1-weighted imaging. Acta Radiol. 2007; 48:1032–1037.
22. Ahn SJ, Chung TS, Chang JH, Lee SK. The added value of double dose gadolinium enhanced 3D T2 fluid-attenuated inversion recovery for evaluating small brain metastases. Yonsei Med J. 2014; 55:1231–1237.
23. Ercan N, Gultekin S, Celik H, Tali TE, Oner YA, Erbas G. Diagnostic value of contrast-enhanced fluid-attenuated inversion recovery MR imaging of intracranial metastases. AJNR Am J Neuroradiol. 2004; 25:761–765.
24. Sasiadek M, Wojtek P, Sokołwska D, Konopka M, Pieniazek P, Zimny A. Evaluation of contrast-enhanced FLAIR sequence in MR assessment of intracranial tumours. Med Sci Monit. 2004; 10:Suppl 3. 94–100.
25. Zhou ZR, Shen TZ, Chen XR, Peng WJ. Diagnostic value of contrast-enhanced fluid-attenuated inversion-recovery MRI for intracranial tumors in comparison with post-contrast T1W spin-echo MRI. Chin Med J (Engl). 2006; 119:467–447.
26. Splendiani A, Puglielli E, De Amicis R, Necozione S, Masciocchi C, Gallucci M. Contrast-enhanced FLAIR in the early diagnosis of infectious meningitis. Neuroradiology. 2005; 47:591–598.
27. Parmar H, Sitoh YY, Anand P, Chua V, Hui F. Contrast-enhanced flair imaging in the evaluation of infectious leptomeningeal diseases. Eur J Radiol. 2006; 58:89–95.
28. Kim HJ. Importance of contrast-enhanced fluid-attenuated inversion recovery imaging to detect paradoxical expansion of tuberculoma. Int J Infect Dis. 2014; 24:37–39.
29. Lee JS, Park JK, Kim SH, Jeong SY, Kim BS, Choi G, et al. Usefulness of contrast enhanced FLAIR imaging for predicting the severity of meningitis. J Neurol. 2014; 261:817–822.
30. Ahmad A, Azad S, Azad R. Differentiation of Leptomeningeal and Vascular Enhancement on Post-contrast FLAIR MRI Sequence: Role in Early Detection of Infectious Meningitis. J Clin Diagn Res. 2015; 9:TC08–TC12.
31. Vaswani AK, Nizamani WM, Ali M, Aneel G, Shahani BK, Hussain S. Diagnostic Accuracy of Contrast-Enhanced FLAIR Magnetic Resonance Imaging in Diagnosis of Meningitis Correlated with CSF Analysis. ISRN Radiol. 2014; 2014:578986.
32. Singh SK, Leeds NE, Ginsberg LE. MR imaging of leptomeningeal metastases: comparison of three sequences. AJNR Am J Neuroradiol. 2002; 23:817–821.
33. Griffiths PD, Coley SC, Romanowski CA, Hodgson T, Wilkinson ID. Contrast-enhanced fluid-attenuated inversion recovery imaging for leptomeningeal disease in children. AJNR Am J Neuroradiol. 2003; 24:719–723.
34. Koide R, Isoo A, Ishii K, Uruha A, Bandoh M. Rheumatoid leptomeningitis: rare complication of rheumatoid arthritis. Clin Rheumatol. 2009; 28:1117–1119.
35. Shimada K, Matsui T, Kawakami M, Hayakawa H, Futami H, Michishita K, et al. Diffuse chronic leptomeningitis with seropositive rheumatoid arthritis: report of a case successfully treated as rheumatoid leptomeningitis. Mod Rheumatol. 2009; 19:556–562.
36. Matsushima M, Yaguchi H, Niino M, Akimoto-Tsuji S, Yabe I, Onishi K, et al. MRI and pathological findings of rheumatoid meningitis. J Clin Neurosci. 2010; 17:129–132.
37. Kamran S, Bener AB, Alper D, Bakshi R. Role of fluid-attenuated inversion recovery in the diagnosis of meningitis: comparison with contrast-enhanced magnetic resonance imaging. J Comput Assist Tomogr. 2004; 28:68–72.
38. Meltzer CC, Fukui MB, Kanal E, Smirniotopoulos JG. MR imaging of the meninges. Part I. Normal anatomic features and nonneoplastic disease. Radiology. 1996; 201:297–308.
39. Elster AD, DiPersio DA. Cranial postoperative site: assessment with contrast-enhanced MR imaging. Radiology. 1990; 174:93–98.
40. Sinclair AG, Scoffings DJ. Imaging of the post-operative cranium. Radiographics. 2010; 30:461–482.
41. Kim SC, Park SW, Ryoo I, Jung SC, Yun TJ, Choi SH, et al. Contrast-enhanced FLAIR (fluid-attenuated inversion recovery) for evaluating mild traumatic brain injury. PLoS One. 2014; 9:e102229.
42. Kanamalla US, Baker KB, Boyko OB. Gadolinium diffusion into subdural space: visualization with FLAIR MR imaging. AJR Am J Roentgenol. 2001; 176:1604–1605.
43. Fink KR, Fink JR. Imaging of brain metastases. Surg Neurol Int. 2013; 4:Suppl 4. S209–S219.
44. Barajas RF Jr, Cha S. Imaging diagnosis of brain metastasis. Prog Neurol Surg. 2012; 25:55–73.
45. Lee EK, Lee EJ, Kim MS, Park HJ, Park NH, Park S 2nd, et al. Intracranial metastases: spectrum of MR imaging findings. Acta Radiol. 2012; 53:1173–1185.
46. Tsuchiya K, Katase S, Yoshino A, Hachiya J. Pre- and postcontrast FLAIR MR imaging in the diagnosis of intracranial meningeal pathology. Radiat Med. 2000; 18:363–368.
47. Oguz KK, Cila A. Rim enhancement of meningiomas on fast FLAIR imaging. Neuroradiology. 2003; 45:78–81.
48. Oner AY, Tokgöz N, Tali ET, Uzun M, Isik S. Imaging meningiomas: is there a need for post-contrast FLAIR? Clin Radiol. 2005; 60:1300–1305.
49. Enokizono M, Morikawa M, Matsuo T, Hayashi T, Horie N, Honda S, et al. The rim pattern of meningioma on 3D FLAIR imaging: correlation with tumor-brain adhesion and histological grading. Magn Reson Med Sci. 2014; 13:251–260.
50. Gebarski SS, Telian SA, Niparko JK. Enhancement along the normal facial nerve in the facial canal: MR imaging and anatomic correlation. Radiology. 1992; 183:391–394.
51. Hong HS, Yi BH, Cha JG, Park SJ, Kim DH, Lee HK, et al. Enhancement pattern of the normal facial nerve at 3.0 T temporal MRI. Br J Radiol. 2010; 83:118–121.
52. Lim HK, Lee JH, Hyun D, Park JW, Kim JL, Lee HY, et al. MR diagnosis of facial neuritis: diagnostic performance of contrast-enhanced 3D-FLAIR technique compared with contrast-enhanced 3D-T1-fast-field echo with fat suppression. AJNR Am J Neuroradiol. 2012; 33:779–783.
53. Hyun D, Lim HK, Park JW, Kim JL, Lee HY, Park SC, et al. Enhancement Pattern of the Normal Facial Nerve on Three-Dimensional (3D)-Fluid Attenuated Inversion Recovery (FLAIR) Sequence at 3.0 T MR Units. J Korean Soc Magn Reson Med. 2012; 16:25–30.
54. Latour LL, Kang DW, Ezzeddine MA, Chalela JA, Warach S. Early blood-brain barrier disruption in human focal brain ischemia. Ann Neurol. 2004; 56:468–477.
55. Dechambre SD, Duprez T, Grandin CB, Lecouvet FE, Peeters A, Cosnard G. High signal in cerebrospinal fluid mimicking subarachnoid haemorrhage on FLAIR following acute stroke and intravenous contrast medium. Neuroradiology. 2000; 42:608–611.
56. Warach S, Latour LL. Evidence of reperfusion injury, exacerbated by thrombolytic therapy, in human focal brain ischemia using a novel imaging marker of early blood-brain barrier disruption. Stroke. 2004; 35:11 Suppl 1. 2659–2661.
57. Henning EC, Latour LL, Warach S. Verification of enhancement of the CSF space, not parenchyma, in acute stroke patients with early blood-brain barrier disruption. J Cereb Blood Flow Metab. 2008; 28:882–886.
58. Kidwell CS, Latour L, Saver JL, Alger JR, Starkman S, Duckwiler G, et al. Thrombolytic toxicity: blood brain barrier disruption in human ischemic stroke. Cerebrovasc Dis. 2008; 25:338–343.
59. Barr TL, Latour LL, Lee KY, Schaewe TJ, Luby M, Chang GS, et al. Blood-brain barrier disruption in humans is independently associated with increased matrix metalloproteinase-9. Stroke. 2010; 41:e123–e128.
60. Batra A, Latour LL, Ruetzler CA, Hallenbeck JM, Spatz M, Warach S, et al. Increased plasma and tissue MMP levels are associated with BCSFB and BBB disruption evident on post-contrast FLAIR after experimental stroke. J Cereb Blood Flow Metab. 2010; 30:1188–1199.
61. Ostwaldt AC, Rozanski M, Schaefer T, Ebinger M, Jungehülsing GJ, Villringer K, et al. Hyperintense acute reperfusion marker is associated with higher contrast agent dosage in acute ischaemic stroke. Eur Radiol. 2015; 25:3161–3166.
62. Rozanski M, Ebinger M, Schmidt WU, Hotter B, Pittl S, Heuschmann PU, et al. Hyperintense acute reperfusion marker on FLAIR is not associated with early haemorrhagic transformation in the elderly. Eur Radiol. 2010; 20:2990–2996.
63. Ogami R, Nakahara T, Hamasaki O, Araki H, Kurisu K. Cerebrospinal fluid enhancement on fluid attenuated inversion recovery images after carotid artery stenting with neuroprotective balloon occlusions: hemodynamic instability and blood-brain barrier disruption. Cardiovasc Intervent Radiol. 2011; 34:936–941.
64. Wilkinson ID, Griffiths PD, Hoggard N, Cleveland TJ, Gaines PA, Venables GS. Unilateral leptomeningeal enhancement after carotid stent insertion detected by magnetic resonance imaging. Stroke. 2000; 31:848–851.
65. Michel E, Liu H, Remley KB, Martin AJ, Madison MT, Kucharczyk J, et al. Perfusion MR neuroimaging in patients undergoing balloon test occlusion of the internal carotid artery. AJNR Am J Neuroradiol. 2001; 22:1590–1596.
66. Merino JG, Latour LL, Tso A, Lee KY, Kang DW, Davis LA, et al. Blood-brain barrier disruption after cardiac surgery. AJNR Am J Neuroradiol. 2013; 34:518–523.
67. Okamura T, Ishibashi N, Zurakowski D, Jonas RA. Cardiopulmonary bypass increases permeability of the blood-cerebrospinal fluid barrier. Ann Thorac Surg. 2010; 89:187–194.
68. Seo DW, Na DG, Na DL, Moon SY, Hong SB. Subcortical hypointensity in partial status epilepticus associated with nonketotic hyperglycemia. J Neuroimaging. 2003; 13:259–263.
69. Bathla G, Policeni B, Agarwal A. Neuroimaging in patients with abnormal blood glucose levels. AJNR Am J Neuroradiol. 2014; 35:833–840.
70. Arsenault TM, King BF, Marsh JW Jr, Goodman JA, Weaver AL, Wood CP, et al. Systemic gadolinium toxicity in patients with renal insufficiency and renal failure: retrospective analysis of an initial experience. Mayo Clin Proc. 1996; 71:1150–1154.
71. Rai AT, Hogg JP. Persistence of gadolinium in CSF: a diagnostic pitfall in patients with end-stage renal disease. AJNR Am J Neuroradiol. 2001; 22:1357–1361.
72. Maramattom BV, Manno EM, Wijdicks EF, Lindell EP. Gadolinium encephalopathy in a patient with renal failure. Neurology. 2005; 64:1276–1278.
73. Morris JM, Miller GM. Increased signal in the subarachnoid space on fluid-attenuated inversion recovery imaging associated with the clearance dynamics of gadolinium chelate: a potential diagnostic pitfall. AJNR Am J Neuroradiol. 2007; 28:1964–1967.
74. Ong EM, Yeh IB. High signal in the cerebrospinal fluid following prior gadolinium administration in a patient with renal impairment. Singapore Med J. 2007; 48:e296–e298.
75. Shellock FG, Kanal E. Safety of magnetic resonance imaging contrast agents. J Magn Reson Imaging. 1999; 10:477–484.
TOOLS
Similar articles