

 PDF
PDF ePub
ePub Citation
 Print
Print


INTRODUCTION
Beta blockers, such as propranolol and primidone, are first-line treatments for arm tremor in patients with essential tremor (ET), and it is estimated that approximately 70% of patients with ET will respond to those medications (1). In other words, it is estimated that at least 30% of patients with ET will not respond to first-line pharmacologic agents (2).
It is well known that the clinical expression of ET may be variable. ET is a heterogeneous disorder that has no universally accepted clinical definition or diagnostic laboratory test (34). Hence, the exact pathophysiology of ET is unknown, although several physiologic and neuroimaging studies point toward a major role of the cerebellum in this disease (56). Furthermore, there are few studies that have examined the pathophysiological differences between ET that is responsive to medical treatment and ET that is not responsive to medical treatment. Thus, we performed this study to evaluate whether there is a functional difference in ET, according to the response to medical treatment through evaluation of regional changes in cerebral glucose metabolism, by use of statistical parametric mapping (SPM) analysis of F-18 fluorodeoxyglucose (FDG)-PET.
MATERIALS AND METHODS
Subjects
This study was approved by the local ethics committee, and each patient provided written informed consent. All patients were prospectively recruited, and the study was conducted between December 2012 and October 2013. In this study there were 17 patients with ET (17 males, mean age 67.3 ± 4.8 years) and 11 age-sex matched healthy control male subjects (mean age 67.2 ± 1.5 years). The seventeen patients with ET were categorized according to their response to propranolol, which is a representative beta blocker. Group A included patients with ET that responded to propranolol, whereas group B included patients who did not respond to propranolol. The healthy subjects did not have any history or symptoms of movement disorders, such as Parkinson's disease, tremor, dystonia, or other cognitive dysfunction, according to a dementia screening questionnaire. Neurologists, specializing in movement disorders at the Veterans Health Service Medical Center and Incheon St. Mary's Hospital (Korea), examined all patients exhibiting tremor. Patients with ET had postural and action tremor without Parkinsonism or other neurologic signs, and were diagnosed as having either definite or probable ET, as based on the National Institutes of Health diagnostic criteria (7). For all patients with ET, a tremor affecting the right arm was dominant. The severity of tremor symptoms was measured according to the Fahn-Tolosa-Marin tremor rating scale (FTM), which was done twice before propranolol therapy and 6 months after the initiation of propranolol therapy. The evaluation consisted of a detailed medical history, physical and neurological examinations, laboratory tests, and neuroimaging studies (MRI or CT) of the brain. None of the patients had any history or symptoms of memory impairment or other cognitive dysfunction (according to the dementia screening questionnaire), nor did they have any cerebrovascular lesions (as demonstrated on neuroimaging). In addition to the aforementioned exclusion criteria, we also excluded patients with secondary causes of tremor (e.g., Wilson's disease, thyroid disease, electrolyte imbalance, neuroleptic drug users, and psychiatric diseases) that would, in the expert opinion of the investigators, interfere with the safe conduct of the study.
Image Acquisition and Analysis
For F-18 FDG-PET scans, all subjects were on nil per os for at least 4 hours and their pre-injection blood glucose levels were confirmed to be below 180 mg/dL. The images were obtained approximately 45 minutes after FDG injection (185-222 MBq), using a Discovery STE PET/CT scanner (GE Healthcare, Milwaukee, WI, USA). All studies were done in 3-dimensional acquisition mode. A 16-slice CT scan was performed for tissue attenuation correction prior to the FDG-PET scan. Imaging data were analyzed using SPM 8 (Wellcome Trust Centre for Neuroimaging, University College London, London, UK) and implemented using MATLAB software (MathWorks Inc., Natick, MA, USA). Differences in glucose metabolism between group A and B of ET were estimated on a voxel-by-voxel basis using t tests. Additionally, differences in glucose metabolism between group A and B of ET and healthy control were estimated. The resultant set of t-values constituted the SPM (t) map. The t-statistic image was thresholded at a > 3.93, corresponding to a uncorrected p value < 0.001 in conjunction with a cluster filter of 50 voxels. For purposes of visualization and anatomic localization, the t-score clusters were projected onto a standard high-resolution scalp-extract MRI.
Statistical Analysis
All statistical analyses were performed using SPSS software version 18.0 (SPSS Inc., Chicago, IL, USA). The Mann-Whitney test and Kruskal-Wallis test were used for comparison of continuous variables, and chi-square analyses were used for comparison of categorical variables. Values are expressed as means and standard deviations. Statistical significance was assumed at a false detection rate of less than 5% (i.e., p < 0.05).
RESULTS
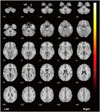
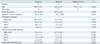
The demographic and clinical characteristics of each group with ET and healthy controls are summarized in Table 1. The mean FTM scores were not different between groups A and B. However, the mean FTM score, 6 months after the initiation of propranolol therapy, was significantly lower in group A, compared with group B (p = 0.012). Interestingly, on brain FDG-PET analysis, glucose metabolism in group A was seen to be decreased in the left basal ganglia compared with group B (Fig. 1, Table 2). However, there was no significant difference in glucose metabolism in the cerebellum.
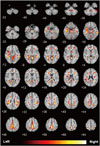
Brain FDG-PET analysis of ET showed more significantly decreased glucose metabolism in the both fronto-temporo-occipital lobes, precuneus of right parietal lobe, and both cerebellums compared to healthy controls (Fig. 2, Supplementary Table 1 in the online-only Data Supplement). However, there was no significantly increased glucose metabolism.
DISCUSSION
It is well known that the clinical expression of ET is variable. Interestingly, the brain FDG-PET SPM analysis showed a greater decrease in regional glucose metabolism in the basal ganglia in ET patients that responded to beta blockers, compared with those that did not respond to treatment. The basal ganglia are involved in the control of movement, and therefore play a large role in the development of movement disorders (8). As a result, disorders of the basal ganglia lead to either a paucity or slowness of movement (hypo- and bradykinesia), or to unintentional movements including tremor, choreatic, dyskinetic, and dystonic movements (hyperkinetic movement disorders) (8). Both hypo- and hyperactivity in the expression of basal ganglia disorders may be explained by direct and indirect pathways within the basal ganglia circuitry that act as a push-pull system within the cortico-basal ganglia circuits (910). Overactivity of the direct pathway, relative to the indirect pathway, would lead to a disinhibition of the thalamocortical system, and as a result uncoordinated or unsupervised release of motor output or cognitive processing (9). On the basis of the aforementioned reports, we hypothesized that the overactivity of the direct pathway, including the basal ganglia and thalamus, affects both ET that does and does not respond to beta blockers. However, the present study showed significant hypometabolism in patients with ET that responded to beta blockers, compared with ET that did not. However, the difference between the two, in terms of biochemical pathophysiology, remains obscure. Furthermore, the present study did not demonstrate a significant difference of glucose metabolism between the two groups of ET as compared with healthy controls. Hence, we cautiously suggest that the difference of metabolism between two groups of ET may have been because of a more strong compensatory response in drug non-responsive ET, compared with drug responsive ET, rather than severe dysfunction within the basal ganglia of patients with drug responsive ET.
Furthermore, this study demonstrated a significant hypometabolism in both fronto-temporo-occipital regions, precuneus, and both cerebellums, which are related to non-motor and motor symptoms, in the ET group, compared with healthy subjects. Therefore, ET is caused by electrophysiological disturbances within cortical-cerebellar networks and degenerative process of the cerebellum.
In conclusion, we hypothesize that ET may have different pathophysiologies, including compensatory mechanisms, with regard to the origin of disease according to therapeutic effects with beta blockers. Additionally, to support these findings, further brain imaging studies are needed, including functional imaging and clinicopathological studies involving a large cohort of patients with tremor such as ET.

 XML Download