

 PDF
PDF ePub
ePub Citation
 Print
Print


INTRODUCTION
Transarterial chemo-lipiodol infusion (TACLI) is a valuable therapeutic strategy for unresectable colorectal cancer liver metastases (CRLM) (1). A study demonstrated that the 1-year, 2-year, and 3-year survival rates were 62%, 28%, and 7%, respectively, and that the median survival time was 14.3 months among 564 unresectable systemic chemotherapy-refractory CRLM patients, who were treated with TACLI and embolization of starch microspheres (transarterial chemoembolization, TACE) (2). A report from Roswell Park Cancer Institute showed that the 1-year survival rate was 58% and that the median survival time was 14 months among 31 patients, who underwent TACE with a collagen suspension, doxorubicin, mitomycin C, and cisplatin (3). These studies have shown promising results, but TACLI is not likely to extend the survival in some CRLM patients (4) and may even cause complications in 3.8% to 100% of the patients (56). Hence, the early evaluation of therapeutic response to and prediction of survival with TACLI are critical for oncologists to promptly distinguish non-responders among the treated patients and change therapeutic options in a timely manner (7).
The morphologic response to TACLI might be prolonged or absent in patients with hepatocellular carcinoma (HCC) (8) or islet cell liver metastases (9). The recent studies have shown a poor correlation between the clinical benefit from and morphologic response to locoregional treatment or targeted therapies based on the Response Evaluation Criteria in Solid Tumors (RECIST), modified RECIST (mRECIST), or European Association for the Study of Liver Disease criteria for patients with HCC (1011) or liver metastasis from neuroendocrine tumors (12). Although the studies conducted on evaluation of therapeutic response to TACLI of CRLM employing RECIST or mRECIST criteria have not yet been reported, the evaluative performance of these guidelines is highly questionable.
Computed tomography perfusion imaging (CTPI) can be used to quantitatively assess tissue perfusion and therefore evaluate therapeutic response to antiangiogenic (1314) and interventional therapies (15). We intended to prospectively investigate the hemodynamic changes before and 1 month after TACLI and evaluate the feasibility of CTPI as an early predicting modality for the therapeutic response to and survival with TACLI in CRLM patients.
MATERIALS AND METHODS
Study Cohort and Design
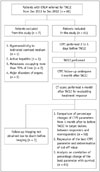
The Institutional Ethics Committee approved the study, and all patients provided a written informed consent. A total of 68 consecutive CRLM patients who were scheduled to undergo TACLI were enrolled from January 2011 to December 2012. The inclusion criteria for TACLI were as follows: 1) The metastases diagnosed by at least 2 imaging techniques, including ultrasonography, CT, magnetic resonance imaging (MRI), and digital subtraction angiography, which were unresectable and chemotherapy-refractory; 2) pathologically confirmed colorectal cancer; 3) ≥ 1 measurable metastasis larger than 3.0 cm; 4) Eastern Cooperative Oncology Group performance status score of 0 to 2; and 5) ≥ 18 years of age. The exclusion criteria included: 1) hypersensitivity to iodinated contrast medium (n = 1); 2) association with other liver disorders (n = 1); 3) metastases occupying > 70% of the entire liver (n = 2); 4) portal vein tumor thrombosis (n = 0); and 5) major disorders of cardiovascular (n = 1), renal (creatinine > 2 mg/dL) (n = 1), pulmonary, or hematologic systems (hemoglobin < 8 mg/dL) (n = 1).
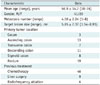
Liver CTPI before and 1 month after TACLI were performed on 61 patients (41 men and 20 women, with a mean age of 56.9 ± 14.7 years and a range of 38 to 76 years). Among the 61 patients, 3 died before the 4-month imaging follow-up. The deceased patients were included in the survival analysis (Fig. 1). The baseline characteristics were summarized in Table 1.
TACLI Methods
Three experienced interventional radiologists performed all TACLI procedures in accordance with standard protocol. The patient was under local anesthesia. A 5.0-Fr micro-puncture introducer set (Terumo, Tokyo, Japan) was used to access the right common femoral artery using the Seldinger technique. A 4.0-Fr or 5.0-Fr RH catheter (Cook, Bloomington, IN, USA) was introduced into the abdominal aorta and then placed in the celiac trunk and superior mesenteric artery, respectively, after which the angiographies were performed. Depending on the size, location, and arterial supply of the tumor, the tip of catheter was advanced further into segmental arteries for selective catheterization under fluoroscopic guidance, and a 2.8-Fr micro-catheter (Progreat, Terumo, Tokyo, Japan) was introduced to the feeding arteries. An emulsion of 5 mL to 15 mL lipiodol (Andre Guerbet, Aulnay-sous-Bois, France) and mitomycin C (Medac, Hamburg, Germany; 8 mg/m2) was mixed and infused into the feeding arteries. Gelfoam or polyvinyl alcohol particles were not used to avoid heterogeneous embolization caused by particulate embolic agents. The choice of chemotherapeutic agents for TACLI depended on the administered chemotherapeutics recommended by Vogl et al. (16): 1) If the patients had undergone both oxaliplatin- and irinotecan-containing protocols (FOLFOX and FOLFIRI, respectively), then only mitomycin C was administered (n = 29). 2) If the patients had undergone an irinotecan-based protocol, then the treatment included a combination of mitomycin C and gemcitabine (Gemzar, Eli Lilly & Company, Indianapolis, IN, USA; 1000 mg/m2; n = 15). 3) If the patients had undergone oxaliplatin-based second-line treatment, then the treatment included a combination of mitomycin C and irinotecan (Campto, Pfizer Pharma, Karlsruhe, Germany; 150 mg/m2; n = 17).
Further treatment aimed at tumor controls was not conducted on these patients before the 4-month imaging follow-up.
CTPI Technique
Computed tomography perfusion imaging was performed 2 to 5 days (2.7 ± 1.4 days) before and 28 to 35 days (31.2 ± 3.3 days) after TACLI. A 64-row multidetector CT scanner (Discovery CT750 HD, GE Medical Systems Ltd., Milwaukee, WI, USA) was applied with shuttle mode (100 kV, 200 mA), volume coverage up to 15 cm, 50 seconds of continuous scanning 5 seconds after the bolus injection of contrast agent (Omnipaque 300, GE Healthcare, Shanghai, China; 300 mg of iodine per milliliter) at 5 mL/s rate of injection (with a dose of 1.0 mL/kg body weight), 0.4 seconds per 360° revolution, 5 mm slice thickness image reconstruction, and a matrix size of 512 × 512 pixels. The images were reconstructed continuously, and a total of 352 to 368 slices were extrapolated.
Analysis of Images and Data
The CT images were transferred to the workstation (Advantage Windows 4.4, GE Medical Systems Ltd.), and the data were processed using the Body Liver Tumor software. Three experienced radiologists, who were unaware of the medical history of the patients and the results of correlative imaging examinations, qualitatively analyzed the CT images in consensus at the workstation.
In each patient, 1 or up to 2 lesions (multiple lesions) were selected as the target lesions according to the RECIST (Version 1.1) criteria. The target lesions should be well-demarcated solid masses > 3.0 cm in the longest diameter. The region of interest (ROI) of the target lesions was determined based on the following criteria: 1) the ROIs were drawn at the center and at the edge of the lesions in the target lesions before TACLI. After TACLI, the ROIs were drawn at the non-lipiodol-retaining portion and edge of lesions, after which the mean value of the CTPI parameters was calculated; 2) the ROIs of the background liver parenchyma were selected in the normal liver parenchyma; 3) all of the ROIs were kept away from large vessels.
The liver tissue was considered as a double-input of the hepatic artery and portal vein and a single output of the hepatic veins to assess hepatic perfusion. The 7 perfusion parameters were calculated using a deconvolution algorithm for each ROI. The hepatic blood flow (HBF), arterial perfusion (HAP), portal vein perfusion (PVP), and permeability of capillary vessel surface (PS) were expressed as mL/min/100 mg of body weight, hepatic blood volume (HBV) as mL/100 mg of body weight, mean transit time (MTT) as seconds, and hepatic arterial fraction (HAF) as the percentage of total blood flow. The relationship between the parameters was expressed as follows (17): HBF = HAP + PVP, where HAP = HBF × HAF and PVP = HBF × (1 - HAF). All CTPI parameters were measured thrice in different slices, after which the mean value was calculated to reduce statistical errors.
The percentage change of CTPI parameters from 1 month after to before TACLI in the lesions was calculated using the following formula: ΔCTPI = ([CTPIpost - CTPIpre] / CTPIpre) × 100, where CTPIpre were the CTPI parameters before TACLI and CTPIpost were the CTPI parameters 1 month after TACLI.
Evaluation of Response and Survival Follow-up
The therapeutic response was evaluated on plain CT scans according to the RECIST (Version 1.1) criteria. Tumor disappearance was categorized as complete response (CR); ≥ 30% decrease in the sum of the diameters of the target lesions was categorized as partial response (PR) with reference to the baseline sum diameters; and a 20% increase and 5 mm absolute increase as progressive disease (PD). Stable disease (SD) was defined as insufficient shrinkage to qualify as PR and insufficient increase to qualify as PD (18). Patients with CR and PR were classified as responders, and patients with SD and PD as non-responders, as previously described (19).
The overall survival was calculated from the start of TACLI. The patients were observed for survival until death or until January 2014 (at least 360 days). Information on the survival of the patients was obtained from medical records or through telephone interview.
Statistical Analysis
Statistical analyses were conducted using SPSS 17.0 for Windows (SPSS Inc., Chicago, IL, USA). The categorical variables were expressed as frequencies and percentages, and the continuous variables were expressed as means and standard deviations. The Kolmogorov-Smirnov test was used to determine whether or not the CTPI parameters in all the lesions were distributed normally. The inter-observer agreement among the 3 radiologists who analyzed the CTPI parameters and measured tumor diameters was tested using intra-class correlation coefficients.
A paired t test was used to compare the difference between the CTPI parameters of the target lesions and those of the normal liver parenchyma before TACLI, as well as the difference between the CTPI parameters in the target lesions before TACLI and 1 month after TACLI. The weighted kappa analysis was conducted to compare the response status between responders and non-responders, which were evaluated using plain CT scans 4 months after TACLI according to the RECIST (Version 1.1) criteria, and a Wilcoxon signed-rank test was used to compare the percentage change of CTPI parameters from 1 month after to before TACE in target lesions between responders and non-responders.
Multivariate logistic regression analysis was used to determine which CTPI parameter at a 1-month follow-up was the best predictor of therapeutic response. To identify patients who were unresponsive to TACLI according to RECIST (Version 1.1) with high specificity, the cutoff value of the percentage change in the regressed parameter from 1 month after to before TACLI was defined as the point at which the value of "sensitivity + specificity-1" (Youden's index) was the maximum.
Receiver operating characteristic curves were plotted to identify the cutoff value of the percentage change in the screened CTPI parameter for identifying the non-responders. The patients were then divided into 2 subgroups according to the cutoff value. Kaplan-Meier curves were plotted to illustrate the overall survival rates, and a log-rank test was used to compare the overall survival rates of the 2 subgroups. p < 0.05 indicates a significant difference.
RESULTS
CTPI Features before TACLI
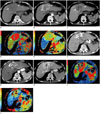
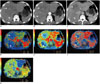
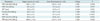
In the hypervascular lesions (n = 24), a heterogeneous hyperperfusion was present in HBF and HAF maps (Fig. 2), however, a hypoperfusion was displayed in the HBV, MTT, and PS maps. An early wash-in and early wash-out during the hepatic arterial and portal venous phases were observed in time-density curve (TDC) map. By contrast, in the hypovascular lesions (n = 37), a heterogeneous hypoperfusion was found in HBF, HBV, MTT, and PS maps, meanwhile, a slight hyperperfusion was shown in the HAF map (Fig. 3), and a flat perfusion curve was exhibited in the TDC map. With regard to the CTPI parameters, the mean HBF, HBV, MTT, and PVP values in the target lesions were significantly lower (p = 0.026, 0.017, 0.021, and 0.002, respectively), but the HAF and HAP values were significantly higher (p < 0.001 and p = 0.011, respectively) than those in the normal liver parenchyma. No statistical difference was found in mean PS value (p = 0.056) (Table 2).
CTPI Features of the Target Lesions One Month after TACLI
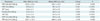
One month after TACLI, the perfusion of the lipiodol-retention portions in the target lesions decreased or disappeared in the HBF and HAF maps. However, the unretentive portions remained unchanged (Fig. 2). With regard to the CTPI parameters, the mean HBF, HBV, PS, HAF, and HAP values of the target lesions significantly decreased (p = 0.030, p < 0.001, p < 0.001, p < 0.001, and p = 0.002, respectively). By contrast, the mean MTT value significantly increased relative to its value before TACLI (p = 0.014). No statistical difference was observed in the PVP value (p = 0.209) (Table 3).
Morphologic Evaluation and Comparison of the CTPI Parameters
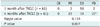
The mean diameter of the target lesions measured on the CT scans at 1 month after TACLI (5.57 ± 2.89 cm [3.12-10.41 cm]) was not significantly lower than that before TACLI (t = 1.5450, p = 0.063). Simultaneously, when evaluating the therapeutic response to TACLI, only 3 patients were categorized as PR, 56 patients as SD, and the remaining 2 as PD according to RECIST (Version 1.1) criteria. Three patients died from hepatic failure or tumor progression on the 86th, 91st, and 117th day after TACLI, respectively. However, during the 4-month CT follow-up, among the 58 survivors, 23 (39.7%, 23/58) were categorized as PR, 19 (32.8%, 19/58) as SD, and 16 (27.6%, 16/58) as PD. The responders and non-responders at 4 months after TACLI accounted for 39.7% (CR + PR, n = 23) and 60.3% (SD + PD, n = 35), respectively. We observed a significant difference in response status between 1 and 4 months after TACLI (Table 4). Further stratifying study revealed that the responders had a greater decrease in percentage changes in HBF, HBV, PS, HAF, and HAP, but had a greater increase in MTT than the non-responders. No statistical difference was observed in PVP (Table 5).
Regression of the Optimal CTPI Parameter and Determination of the Cutoff Value
Hepatic arterial perfusion was an independent factor that affected the therapeutic response to TACLI (p = 0.003; 95% confidence interval [CI], 95.1% to 98.9%). The HAP at a cutoff value of -21.5% resulted in the highest Youden's index with a corresponding sensitivity of 94.4% and a specificity of 84.0%.
Correlation of the Percentage Change in HAP with Survival
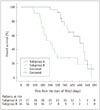
The cutoff value of the percentage changes of HAP was set at -21.5%. The study cohort was then divided into 2 subgroups: Subgroup A had a decrease of ≥ 21.5% (n = 27), and Subgroup B had a decrease of < 21.5% (n = 34). There was no significant difference in the comparative details of the treatment after 4-month imaging follow-up between Subgroup A and Subgroup B (χ2 = 1.925, p = 0.750) (Table 6).
The 6-month, 12-month, and 18-month survival rates in Subgroup A were 96.3% (95% CI, 89.2% to 100%), 74.5% (95% CI, 56.6% to 92.3%), and 24.5% (95% CI, 0 to 51.4%), respectively. The survival rates in Subgroup B were 70.6% (95% CI, 55.3% to 85.9%), 28% (95% CI, 12.8% to 43.4%), and 18.8% (95% CI, 4.7% to 36.9%), respectively. Subgroup A had a significantly higher overall survival [median survival time, 455.2 days (95% CI, 411.3 to 499.1 days)] than Subgroup B (median survival time, 295.2 days [95% CI, 237.7 to 352.7 days]) (χ2 = 13.169, p < 0.001) (Fig. 4).
DISCUSSION
Previous studies have described the performance of CTPI in predicting the outcome after radioembolization of HCC and liver metastases (18202122). However, the data on changes in the CTPI parameters of patients with CRLM after TACLI remain unknown. Determining whether or not CTPI can predict early therapeutic response to and survival with TACLI is of great clinical significance and practical value.
In the present study, a comparison of the CTPI parameters of the target lesions with normal liver parenchyma before TACLI showed that the mean HAP and HAF values of the target lesions significantly increased, whereas the mean HBF, HBV, MTT, and PVP values decreased. The elevated HAP and HAF values indicated that CRLM is hypervascular, which is consistent with the report of Singh et al. (23). In their study, 8 patients with CRLM presented as hypervascular tumors among 27 patients with hepatic metastases. We speculated that the decreased HBF values in the target lesions might be attributed to the significant decline of PVP; because HBF is composed of HAP and PVP (17), significant decreases in PVP despite an increase in HAP results in a decrease in HBF because of the larger cardinal number of PVP. The decrease in HBV can be explained by the equation HBV = HBF × MTT / 60. The decrease in PVP can be explained by the occlusion of the portal vein branch due to the compression of tumor and margination of white blood cells in the portal vessels (24). Thus, PVP may have a predominant role in determining the hemodynamic characteristics of CRLM.
The mean HBF, HBV, PS, HAF, and HAP values of the target lesions at 1 month after TACLI were significantly decreased, whereas MTT lengthened relative to that before TACLI. These perfusion parameters are sensitive indices of the tumor blood supply (25262728). Our results suggested that the blood supply of the tumor is significantly reduced, and the time of the blood flow passing through the tumor capillaries is lengthened by TACLI. These phenomena appear to be caused by the destruction of the tumor vessels. No statistical difference in the PVP value was found in the target lesions 1 month after TACLI relative to those before TACLI. According to the claims of Li et al. (9) and Kruskal and Kane (24), the reason for such findings may be related to the size of target lesions, which does not shrink in the early term after TACLI. Thus, the occlusion of the portal vein branch compressed by the tumor is not relieved. Further research is required to evaluate the long-term effect of TACLI on PVP.
Our study suggested that the changes of tumor size at 1 month after TACLI are not significantly lower than those before TACLI, which is in line with the findings of a previous study by Reiner et al. (21). The therapeutic response at 1 month after TACLI showed that only 3 patients were categorized as PR, and the remaining 58 patients were classified as SD or PD, which is significantly different from the response status at 4 months after TACLI; furthermore, PR was obviously undervalued, which suggested that early therapeutic response to TACLI cannot be evaluated with the RECIST (Version 1.1) criteria.
In our study, a 4-month CT follow-up after TACLI was performed in 58 patients. Responders and non-responders accounted for 39.7% and 60.3%, respectively, which almost coincided with those in a previous report (29). The further stratifying study revealed that the responders had a greater decrease in the percentage changes in HBF, HBV, PS, HAF, and HAP from 1 month after to before TACLI, but had a greater increase in MTT than the non-responders. No statistical difference was found in PVP. Multivariate logistic regression analysis showed that the percentage change in HAP was an independent parameter for evaluating early therapeutic response to TACLI.
In this study, a cutoff value of -21.5% was identified in the percentage changes in HAP, with high sensitivity and specificity to predict the early therapeutic response to TACLI. Patients who exhibited a ≥ 21.5% decrease in the percentage change in HAP had a higher overall survival rate than those who exhibited a < 21.5% decrease. Morsbach et al. (22) directly applied the mean values of perfusion parameters (not the percentage changes) to identify the optimal parameters and cutoff value. Their method may be inappropriate and impractical, because of the possible high variance in CTPI parameters among individuals and CT scanners. In contrast, in the present study, the percentage changes in the perfusion parameters from after to before TACLI are used to identify the optimal parameters, which are more accurate and practical. Therefore, the percentage change in HAP is proposed as an independent predictor for evaluating the early therapeutic response to and survival with TACLI of patients with CRLM, and -21.5% is likely to be the optimal cutoff value.
The current study had some limitations. First, although the 15 cm volume coverage was used during CTPI and the effective radiation dose was equal to that of a routine diagnostic abdominal CT scan, the patient was exposed to an additional radiation dose when CTPI was performed. MR perfusion imaging has no radiation effects and no lipiodol artifacts, which can quantify the microcirculatory status of liver parenchyma and lesions, and can be used for detecting liver tumors, evaluating the effectiveness of antiangiogenic therapy and the tumor viability after anticancer therapy (30). However, it is not applicable for patients with contraindications to MR imaging. Respiratory motion is a major issue in hepatic perfusion imaging (3132). Second, in the present study, the RECIST (Version 1.1) criteria based on tumor size, but not the mRECIST based on tumor enhancement, were used for evaluating therapeutic response to TACLI. The RECIST (Version 1.1) criteria are feasible for the therapeutic evaluation of hypovascular tumor, and are free of the interference of lipiodol artifacts. However, mRECIST criteria are currently recommended for more accurately predicting therapeutic response in patients with hypervascular tumors (333435). In this study, there were 24 patients with hypervascular tumors and 37 patients with hypovascular tumors. The bias of response evaluation is likely due to the application of RECIST (Version 1.1) criteria alone in all patients. Third, the histopathological examination was not obtained from the target lesions. However, we evaluated therapeutic response based on anatomical size, rather than tumor necrosis; thus, there was no direct impact on the results. Fourth, our transarterial therapeutic method was not a typical TACE, and the choice of chemotherapeutic agents was dependent on the administered chemotherapeutics, which may be heterogeneous. Such choice may have likely led to some bias in the results among different treatment groups. Fifth, the drug-eluting beads and Yttrium-90 were not used in this study, because these 2 kinds of embolic materials have not been approved for clinical application in our country. Lipiodol can affect the reliability of the CTPI to some extent. Therefore, further studies on CTPI features in target lesions after TACLI with drug eluting beads and Yttrium-90 are needed to confirm the conclusions.
In conclusion, this study suggested that the percentage change in HAP is the optimal CTPI parameter for predicting the early therapeutic response to and survival with TACLI of patients with CRLM. A greater decrease in the percentage change in HAP (≥ 21.5%) in the target lesions at 1 month after TACLI, is associated with a higher overall survival rate than those with a lower decrease. CTPI can predict the early therapeutic response to TACLI and survival of patients with CRLM.

 XML Download