

 PDF
PDF ePub
ePub Citation
 Print
Print


INTRODUCTION
Gastric cancer is the fourth most commonly diagnosed cancer and the second leading cause of cancer-related deaths worldwide (1). Geographic areas with high incidences of gastric cancer include Korea, Japan, China, Colombia, Ecuador, Ukraine, and Russia. Interestingly, in Korea and Japan, more than half of the surgically treated gastric cancers are early gastric cancer (EGC), partly due to strict screening programs related to the high incidence of gastric cancer (2). Given that it is still challenging to detect and stage EGCs based on CT images, careful interpretation of CT findings is required to provide clinicians with reliable information regarding the exact location and staging of EGCs.
Multidetector CT (MDCT) gastrography is a novel and useful technique for the preoperative imaging of gastric cancer (3). The state-of-the-art MDCT technology used in MDCT gastrography (CTG) is a powerful tool for the detection of gastric cancer, especially EGC, mainly due to its ability to produce various three-dimensional (3D) images such as virtual endoscopy (VE), shaded surface display (SSD), and tissue transition projection (TTP) images (Fig. 1) (4, 5, 6, 7, 8). According to previous reports (6, 9, 10, 11, 12), 3D CTG can improve the detectability of EGC as compared to two-dimensional (2D) CT imaging. VE images, which are generated using a surface volume-rendering technique, simulate a conventional endoscopy by providing a view inside the gastric lumen. The SSD and TTP images are similar to single-contrast and double-contrast barium studies, respectively, and can provide a global view of the stomach and the exact location of a gastric lesion.
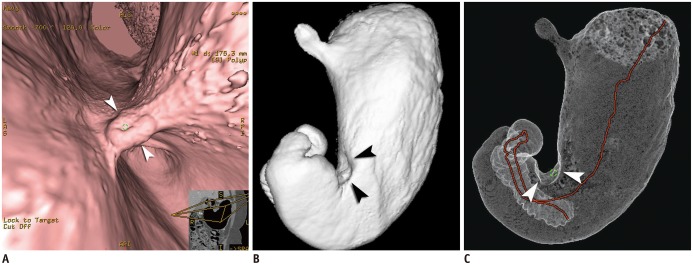 | Fig. 1Case of Borrmann type II advanced gastric cancer (AGC) visualized on various three-dimensional CT gastrography images.
Virtual endoscopy (VE) (A), shaded surface display (SSD) (B), and tissue transition projection (TTP) (C) images show Borrmann type II AGC (arrowheads) at gastric angle. As compared to SSD image, central ulceration of mass is depicted more clearly on VE image. Note that interactive two-dimensional image is concomitantly displayed in corner of VE image. Red line on TTP image indicates viewpoint path, along which center of VE image is located.
|
In this review, we demonstrate the usefulness of MDCT gastrography for the preoperative imaging of gastric cancer, with an emphasis on the detection and localization of the tumor. Technical factors necessary for high-quality MDCT gastrographic images are also discussed.
Go to : 
Technical Factors in MDCT Gastrography
CT Examination
To distend the stomach, patients usually ingest 6 g of effervescent granules (Top; Taejoon Pharmaceuticals, Yongin, Korea) with 5-10 mL of water just prior to undergoing CT scanning. Patients are then placed in the left lateral decubitus position to shift the gastric contents from the lower two-thirds of the stomach to the fundus; they are then immediately placed on the scanning table in the 30° left posterior oblique (LPO) position by putting a pillow under the right back (13). If a gastric lesion is at the cardia or fundus, a right lateral decubitus position should be used instead of the LPO position (4). An initial scout image is obtained to make sure that the stomach is adequately distended.
CT scanning with a thinner collimation can be achieved readily using most modern MDCT scanners. Usually, a slice collimation less than 1.5 mm with a reconstruction interval of less than 1 mm will lead to optimal imaging for CTG. At our institution, CT scanning is performed with a 16- or 64-detector CT scanner (LightSpeed H16 or LightSpeed VCT; GE Healthcare, Milwaukee, WI, USA) in patients who fasted for more than 8 hours. Scanning parameters are as follows: 16 × 1.25 or 64 × 0.625 detector configuration, 2.5-mm helical thickness, 120 kVp, 200-300 mA (depending on the body habitus of the patient), 1.375:1 or 0.984:1 pitch, and 0.625-mm reconstruction thickness. Automated tube current modulation (AutomA; GE Healthcare, Milwaukee, WI, USA) is routinely used for all patients. AutomA is set between 100 and 300 mA with a noise index of 15. Single phase (usually, the portal venous phase) CT scanning is started at 60 seconds after the trigger threshold (100 Hounsfield units on the upper abdominal aorta) is reached. CT data acquisition is conducted from the diaphragmatic dome to the symphysis pubis.
Post-Processing
At our institution, both 2D (axial, coronal, and sagittal) and 3D CT images are generated using the raw data. The axial CT images for routine clinical interpretation are reconstructed with a 2.5-mm section thickness and a 2.5-mm interval. For 3D reconstruction, axial CT images are prepared with a 0.625-mm or 1.25-mm section thickness and a 0.625-mm interval. The coronal and sagittal images are reformatted with a 2-mm section thickness and a 2-mm interval. The 3D images are created on a workstation (Advantage Workstation 4.3; GE Healthcare, Milwaukee, WI, USA) by an experienced technician, which usually takes less than 20 minutes. If necessary, multiplanar reformation (MPR) images are also available with projections oriented perpendicular to the probable gastric lesions detected on the VE images.
Go to :
Evaluation Steps of MDCT Gastrographic Images
Before the interpretation of CTG, we first evaluate whether the patient's preparation, including luminal distension of the stomach, is appropriate. If gastric distension is too little or too much, it could interfere with the identification of changes in the gastric folds. Among various 2D and 3D CTG images, VE images need to be first evaluated to detect and localize the gastric cancer. Abnormal convergence, fusion, and disruption of the gastric folds reaching the crater edge on 3D endoluminal images usually suggest gastric cancers (Fig. 2). The next step is to determine the depth of tumoral invasion within the gastric wall using the 2D images. When interpreting 2D CT images regarding the degree of tumoral invasion, the necessity of matching the exact location of the tumor on the 2D image with that detected on the 3D endoluminal image cannot be overemphasized. This can be achieved by referring to the interactive 2D images that are simultaneously displayed on the screen and finding the corresponding 3D images.
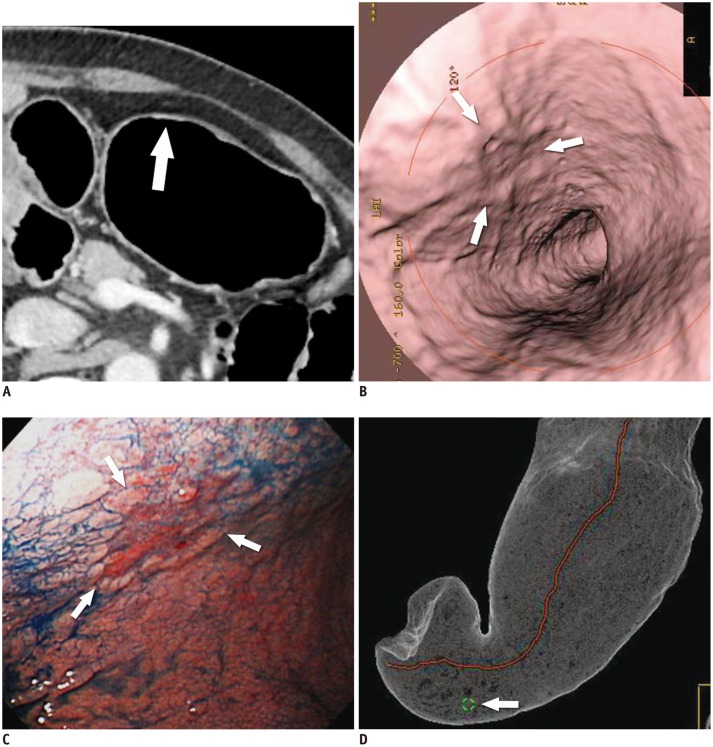
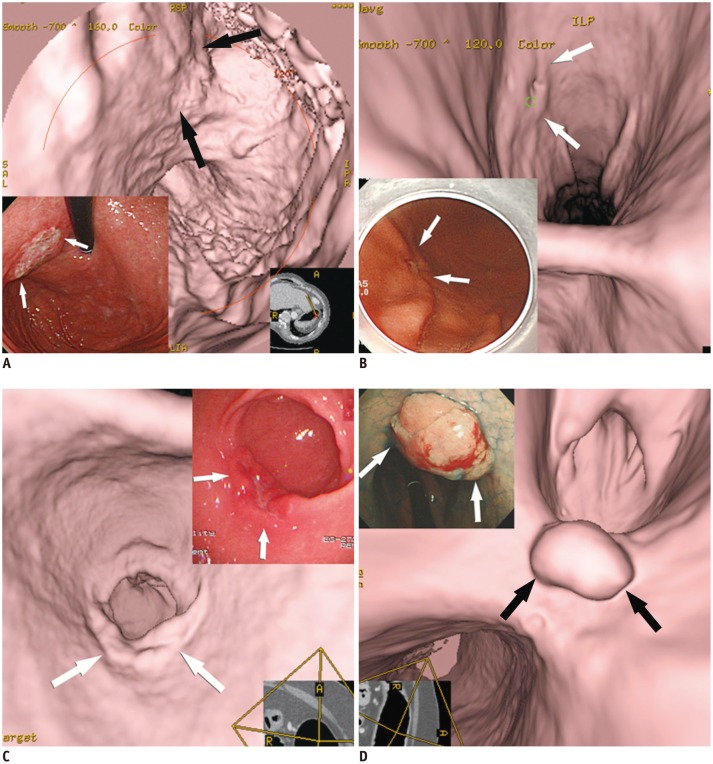 | Fig. 2Various features of early gastric cancers (EGCs) on virtual endoscopy and conventional endoscopic images.
A. EGC (type IIb, superficial flat type) is seen with uneven base (arrows). B. EGC (type IIc, superficial depressed type) shows shallow depressed lesion with abnormal gastric fold convergence (arrows). C. EGC (type IIa, superficial elevated type) is demonstrated as bulbous enlargement (arrows). D. EGC (type I, protruded type) is seen as polypoid lesion (arrows).
|
Go to :
Detection and Localization of Gastric Cancer
With the widespread use of endoscopic and laparoscopic resection for treating EGC, detection and accurate local staging at an early stage have become vitally important. In addition, precise localization of the lesion on CT images is an essential step for T staging in the preoperative imaging of gastric cancer. In a bid to improve the detection rate of EGC at CT, conventional endoscopic findings can be used as reference data with respect to the location of the lesion. However, correlating the location of gastric cancer on conventional endoscopy with that from 2D CT imaging is not always straightforward. According to previous studies using 2D CT imaging, the detection rates of EGC are disappointing (14, 15), while MDCT with 3D CTG images can enhance the detectability of EGC (3, 4, 6, 10). This can be explained by the fact that 3D images are more effective and intuitive to aid inrecognizing abnormal changes in the gastric folds and subtle mucosal nodularity than 2D images (3, 8). Among various types of 3D images, we preferentially use VE images for the detection of gastric cancers because a 3D endoluminal view appears to be better for visualizing mucosal changes more clearly than SSD images. Moreover, VE has no "blind spots" within the lumen of the stomach, and usually provides a wider field of view than conventional endoscopy.
Detectability of Gastric Cancer Using MDCT Gastrography
Overall, according to a recent study using 64-channel MDCT (3), gastric cancer was detected in 123 (96.9%) of the 127 cancers on CT images. All of the advanced gastric cancers (AGCs) were visualized on both 2D and VE images. In cases of EGC, 72 (94.7%) of the 76 cases were detected on CT images. While 56 (73.7%) of the 76 EGCs were noted on both 2D and VE images, EGC was seen in two (2.6%) and 14 (18.4%) cases only on 2D and VE images, respectively. Although the detection rate for AGC was similar between 2D (including MPR images) and VE images, the detectability of EGC was significantly different between 2D and VE images (3).
Importance of Preoperative Localization of Gastric Cancer in Terms of Surgical Margin
The surgical procedure for resectable gastric cancer is determined according to the size, location, and ability to achieve negative surgical margins for malignant cells (16). In general, gastric cancers located in the proximal third of the stomach are resected with a total gastrectomy, whereas subtotal gastrectomy with Billroth I or II anastomosis is performed for tumors of the middle and distal thirds of the stomach (16). Several retrospective studies have suggested that when performing a subtotal gastrectomy, a margin of 6 cm proximally from a gastric cancer and 3-5.9 cm distally is required to ensure a low rate of anastomotic recurrence (17). Not surprisingly, previously studies have demonstrated that a positive surgical margin is an independently unfavorable factor for marginal recurrence in patients undergoing gastrectomy (18). Thus, it is important to secure a sufficient distance from the tumor to the closest resection line along the lesser curvature of the stomach.
Evaluation steps for the localization of gastric cancer have changed according to remarkable developments in endoscopic equipment and procedural skills. In the past, if gastric cancer was detected by conventional endoscopy, contrast-enhanced CT was performed to evaluate the tumor-node-metastasis staging of the cancer. Then, an upper gastrointestinal (GI) series was performed to determine the exact location of the tumor in the stomach for surgical planning. Meanwhile, nowadays, upper GI series tend not to be performed preoperatively because the location of gastric cancer is determined by conventional endoscopy instead of an oral contrast study.
However, according to a recent study by Jeong et al. (19), preoperative conventional endoscopy appears to be inaccurate in localizing the tumor, especially when the gastric cancer is located along the lesser curvature, or in the upper or middle portion of the gastric body. This can be explained by the fact that, during conventional endoscopy, the stomach is usually over-distended, nearly twice as much as at surgery. The discrepancy in the location of gastric cancer between preoperative conventional endoscopy and surgery could be especially problematic during laparoscopic surgery. Indeed, in this situation, there is a possibility that the surgical strategy may change during the operation or may even require re-operation after the primary gastric resection because of an insufficient resection margin (Fig. 3).
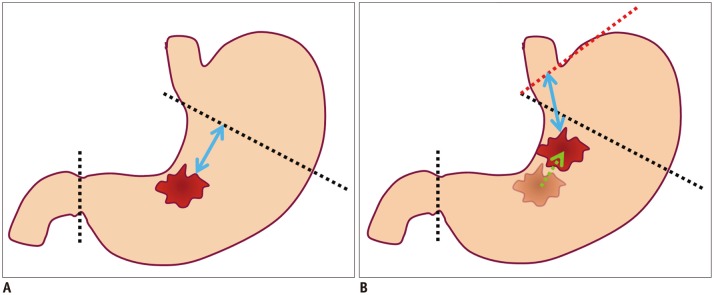 | Fig. 3Diagrams showing possibility of re-operation due to location difference for gastric cancer between preoperative conventional endoscopy and surgery.
A. Illustration shows location of gastric cancer at gastric angle, as is determined using preoperative conventional endoscopy. Black dotted lines indicate proximal and distal resection lines of planned laparoscopic subtotal gastrectomy with sufficient proximal resection margin (blue arrow). B. Illustration shows different location of gastric cancer between preoperative conventional endoscopy and surgery. If gastric cancer is located more proximally (green arrow) along lesser curvature at surgery than conventional endoscopy, planned proximal and distal resection lines (black dotted lines) would not secure sufficient proximal resected margin. Thus, in this case, additional total gastrectomy (red dotted line) may be required for sufficient proximal resected margin (blue arrow) after primary subtotal gastrectomy.
|
In contrast, it is possible to find the location of the gastric cancer more accurately before treatment using various 3D reconstruction images, such as VE, TTP, and SSD images, even if the location of gastric cancer was previously determined incorrectly using conventional endoscopy (Fig. 4) (19). Thus, 3D CTG images can help clinicians decide on the optimal treatment options by providing reliable information in regard to the location of the tumor (3, 20).
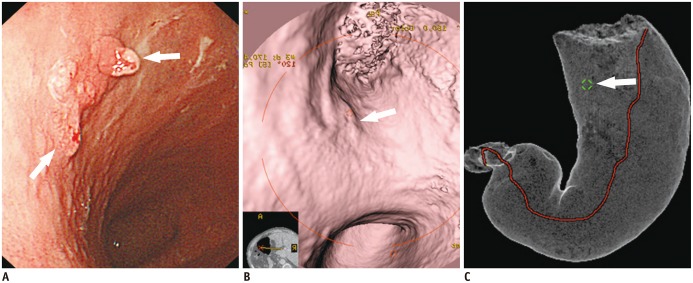 | Fig. 4Case of early gastric cancer (EGC) (type IIa) in which re-operation was performed because location of EGC was incorrectly determined by conventional endoscopy, in contrast to CT gastrography.
A. EGC (arrows) was determined to be at lesser curvature of gastric mid-body using conventional endoscopy. Laparoscopic distal gastrectomy was planned based on conventional endoscopic findings. B, C. In contrast to conventional endoscopic findings, EGC (arrow) is depicted at upper body on both virtual endoscopy (B) and tissue transition projection (C) images. However, planned laparoscopic distal gastrectomy was finally performed according to location of EGC using conventional endoscopy. With surgical specimen, EGC was confirmed to be located at upper body. Re-operation (near-total gastrectomy) was subsequently performed due to insufficient proximal resected margin after initial laparoscopic distal gastrectomy.
|
Go to :
T Staging of Gastric Cancer
Most previous studies (4, 6, 11, 12, 21, 22) evaluated T staging using CT criteria based on the concepts of Minami et al. (23), that a normal gastric wall was typically seen as three separate layers on the contrast-enhanced CT images. These three layers consisted of an inner mucosal layer with marked enhancement, a submucosal layer with low attenuation, and an outer muscular-serosal layer with slightly higher attenuation. On MDCT images, T1a tumors show enhancement without thickening of the inner mucosal layer, as compared to the adjacent normal mucosal layer. Now that T1a gastric cancer is frequently detected only on 3D endoluminal images, any gastric cancer that is not depicted on 2D CT images may be interpreted as T1a cancer (Fig. 5) (24). T1b tumors show enhancing mucosal thickening with intact a low-density-stripe layer. Both T2 and T3 tumors destroy the low-density-stripe layer, but are confined to the gastric wall. However, T3 tumors can have a few small linear strandings in the perigastric fat plane. T4a tumors are usually accompanied by an irregular or nodular outer margin of the outer layer and a dense band-like perigastric fat infiltration. Stage T4b tumors show obliteration of the fat plane between the gastric lesion and the adjacent organs or direct invasion of the adjacent organs.
 | Fig. 5T1a cancer (type IIc) in 62-year-old man that is not seen on two-dimensional CT image despite being detected on both virtual endoscopy (VE) and tissue transition projection (TTP) images.
A. Oblique, axial, contrast-enhanced CT image shows no discernible lesion at corresponding site (arrow) where early gastric cancer (EGC) is detected on three-dimensional images. B. VE image demonstrates shallow depressed lesion (arrows) with converging folds and uneven margins. C. Conventional endoscopic image shows malignant ulcer (arrows) with converging folds and uneven margin, which are similar morphologic features with B. D. TTP image depicts location of EGC (arrow) that is seen on VE (B).
|
Meanwhile, a recent study by Kim et al. (3) postulated that the inner and the outer halves of the low-density-stripe layer on contrast-enhanced CT images might represent the submucosal and the proper muscle layer, respectively, according to the radiologic-pathologic correlation. They suggested different MDCT criteria based on their own speculation regarding the gastric mural layering, in which there are major differences in MDCT criteria for T1b and T2 cancers (3). When the low-density-stripe layer is disrupted to a degree of less than 50% of the thickness, the tumor is staged as T1b (Fig. 6). T2 tumors show disruption of the low-density-stripe layer (greater than 50% of the thickness) without abutting on the outer, slightly higher-attenuating layer (Fig. 7).
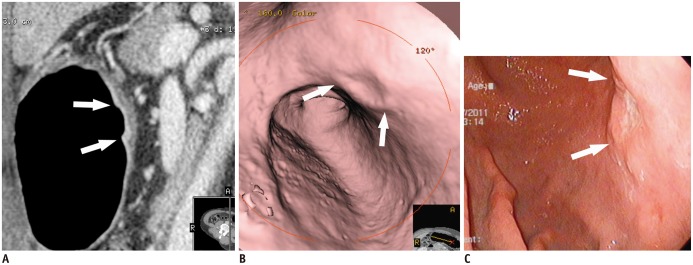 | Fig. 6T1b cancer (type IIa + IIc) in 62-year-old man, detected on both two-dimensional and three-dimensional (virtual endoscopy [VE]) images.
A. Sagittal contrast-enhanced CT image shows well-enhanced ulcerative lesion in thickened mucosal layer (arrows), which invades low-density-stripe layer to degree of less than 50% of thickness at lesser curvature of gastric lower body. B. VE image demonstrates shallow ulcerative lesion (arrows) with uneven margins. C. Conventional endoscopic image shows malignant ulcer (arrows) with uneven margins, similar to morphological features in B.
|
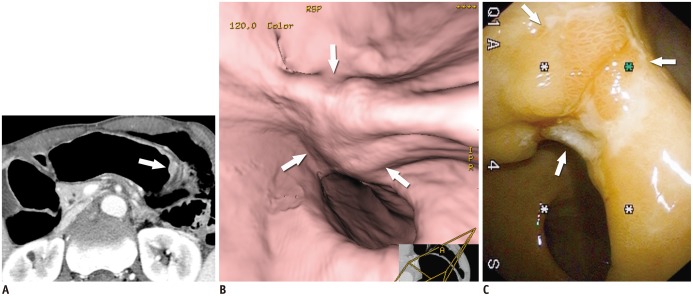 | Fig. 7T2 cancer in 69-year-old man.
A. Axial contrast-enhanced CT image shows well-enhancing mucosal thickening (arrow) and disruption of low-density-stripe layer (> 50% of thickness) at greater curvature of gastric body, without abutting outer, slightly higher-attenuating layer. This lesion was correctly classified as T2 cancer in preoperative imaging. B. Virtual endoscopy image shows ulceroinfiltrative mass (arrows). C. Conventional endoscopic image reveals poorly demarcated ulceroinfiltrative lesion (arrows), suggestive of advanced gastric cancer.
|
Although MDCT with MPR and 3D CTG images is believed to enhance the diagnostic accuracy of preoperative T staging of gastric cancer (12), it is still challenging to evaluate T staging in some cases. There is a tendency that EGC type IIc (excavated lesion) at gastric angle and EGC type I (protruded lesion) are over-staged. Also, in some cases, it is not easy to distinguish between T1b and T2 cancers due to the irregular contour of the tumor, uneven thickness of the gastric layer, and the presence of massive submucosal fibrosis (Fig. 8). Given that the visual discrimination among the subserosa, and the outer serosal layer is almost impossible on MDCT images, it is not a straightforward issue to differentiate among T2, T3, and T4a tumors using MDCT.
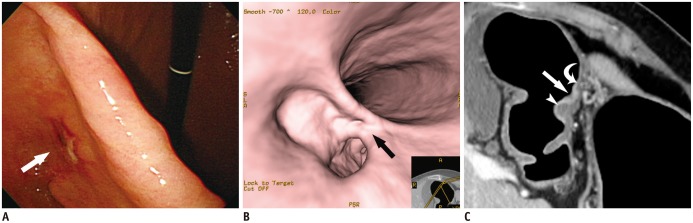 | Fig. 8T1b early gastric cancer (type IIc) in 74-year-old woman that was overestimated as T2 cancer at multidetector CT gastrography.
A, B. Conventional endoscopic (A) and virtual endoscopy (VE) (B) images clearly show focal ulcerative lesion (arrow). C. Oblique axial contrast-enhanced CT image shows focal ulcerative lesion with enhancing thickened mucosa (arrow) and uneven gastric layers in thickness. Because of relatively thin low-density-stripe layer (curved arrow) of proximal antrum, compared to distal antrum (arrowhead), disruption degree of low-density-stripe layer was estimated as greater than 50% of thickness. This lesion was judged preoperatively as T2 cancer. However, gastric cancer was confirmed pathologically as SM3 T1b cancer.
|
Go to :
Limitations and Diagnostic Pitfalls of 3D MDCT Gastrography
Three-dimensional CTG has several limitations in preoperative imaging of gastric cancer. First, although recent advances in computer technology have enabled 3D reconstruction processing to be faster and easier, it is still timeconsuming to prepare and interpret 3D CTG images. Also, a certain amount of learning time is necessary to get accustomed to the interpretation of 3D CTG images. Second, the fact that CTG images cannot detect color changes of the mucosa may be disadvantageous. In some cases of EGC type IIb (superficial flat lesion), only color change on conventional endoscopy implies the presence of the tumor without significant mucosal fold changes. Thus, in this case, if abnormal mural thickening and enhancement related to EGC is not seen on 2D images, 3D CTG cannot detect the tumor. Third, gastric secretion or residual food can mask a gastric cancer and may be confused with a true lesion. Thus, when a focal lesion is suspected on VE images, this lesion should be checked again using 2D images to rule out pseudo-lesions such as fluid collection, air bubbles, metallic clips, and food remaining in the stomach (Fig. 9).
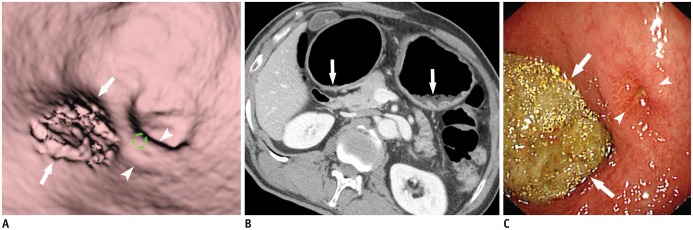 | Fig. 9Residual food mimicking true gastric lesion.
A. Residual food (arrows) in gastric antrum mimics focal mucosal lesion. Note tiny ulcer (arrowheads) in vicinity of residual food. B. Axial CT image demonstrates residual food (arrows) in gastric antrum and upper body. C. Conventional endoscopy reveals residual food (arrows) and tiny ulcer (arrowheads) in gastric antrum.
|
Go to :
CONCLUSION
Multidetector CT gastrography has been regarded as a promising technique in the detection and local staging of gastric cancers because 3D CTG has the ability to show details of gastric mucosal change. High-quality MDCT gastrographic images, including various 3D images, can help clinicians plan optimal treatment strategies by offering a global view of the stomach with the exact localization of the tumor and accurate tumor staging. In particular, 3D CTG may enhance the performance of the CT in the detection and localization of EGC.
Go to :
 XML Download