

 PDF
PDF ePub
ePub Citation
 Print
Print


INTRODUCTION
Collateral ventilation is defined as the ventilation of gas exchanging airspaces via pathways other than the regular branching airways (1, 2). Although pores of Kohn (3) and holes in walls of adjacent alveoli were first described in the 19th century, the significance of collateral ventilation was not described until 1930 when Van Allen et al. (4) noticed no collapse distal to the obstructed bronchus in dogs. This significance was largely overlooked by physiologists and physicians alike, although several studies were reported in the 1960s and 1970s (5, 6, 7, 8). However, with the emergence of new bronchoscopic techniques for treating emphysema, collateral ventilation has garnered much renewed interest (2). Bronchoscopic lung volume reduction therapy using various materials has been used to study endobronchial valves (EBVs), coils, thermal vapor ablations, and polymer sealants (9). EBVs are designed to prevent air from entering into distal lung while allowing air and secretions to escape the lobe. As a result, atelectasis of the treated lobe develops, and the lung volume decreased with clinical improvement. A large prospective multicenter trial referred to as the Endobronchial Valve for Emphysema Palliation Trial (10) was performed to assess the effectiveness of EBV. It was fund that no device-related death was observed for up to 12 months after treatment. A wide range of improvements after EBV treatment were observed. The degree of collateral ventilation was suggested to be the reason.
Recent studies have shown that xenon-ventilation CT using dual-energy technique of dual-source CT could overcome the variability of lung attenuation caused by different lung volumes between scans. It is capable of assessing functional regional ventilation by differentiating xenon from lung tissue with use of the material decomposition theory (11, 12, 13, 14, 15, 16). A previous study proved the possibility of quantification of collateral ventilation with dual-energy xenon-ventilation CT by analyzing time-xenon density curves of occluded lung parenchyma after bronchial occlusion in a dog model (13). However, there was no control group in that study for the poor development of collateral ventilation. Therefore, it is still unknown whether the different degree of collateral ventilation can be differentiated by dual-energy xenon-ventilation CT.
Development of collateral ventilation varies according to the species examined. It also depends on the degree of lobulation of the lung (17). In canine lung, there are no interlobular fibrous septa. However, interlobular septa in pigs or cows are more extensive and complete than in men or horses (5). Therefore, this study was designed to evaluate whether the difference in the degree of collateral ventilation between canine and swine models of bronchial obstruction can be detected using xenon-enhanced dynamic dual-energy CT.
MATERIALS AND METHODS
Animal Preparation
This experiment was approved by our Institutional Animal Care and Use Committee (IACUC No. 10-0012, Study Number 12-2010-001-4; IACUC No. 09-0289, Study Number 12-2010-002-5). Eight adult mongrel dogs (weight range, 30-35 kg) and six adult pigs (weight range, 30-35 kg) were examined under general anesthesia. Anesthesia was induced with a subcutaneous injection of a mixture of 15 mg/kg zolazepam (Zoletil; Yuhan Corp., Seoul, Korea), 5-10 mg/kg xylazine hydrochloride (Rompun; Bayer Korea, Seoul, Korea), and 0.02-0.04 mg/kg atropine sulfate (Atropine; DAHIHAN pharm, Co., Ltd., Seoul, Korea). Thereafter, an endotracheal tube with an inside diameter of 7.0-7.5 mm was placed.
Bronchial Occlusion
Under fluoroscopic guidance, the posterior segmental bronchus of the caudal lobe was occluded using an occlusion balloon (Boston-Scientific, Standard occlusion balloon catheter, 11.5 mm) (13). The balloon catheter was introduced through a side hole of the connector (Elbow Connector, Swivel; Winnomed Company Ltd., Taoyuan, Taiwan) interposed between the endotracheal tube and breathing circuit of the mechanical ventilator. A balloon was inflated with a 1 mL mixture of intravenous contrast material and saline. A Davis catheter was placed in the stomach in order to prevent gastric distention prior to bronchial occlusion. After checking the location of the occlusion site with a radiopaque balloon, the catheter was fixed and the balloon was deflated. To avoid dependent atelectasis in the caudal lobe, the animal was moved to the CT room in prone position. After the animal arrived in the CT room, a CT scan was performed to check the location of the balloon catheter tip and the size of the target bronchus. After the balloon was inflated again, a CT scan was repeated in order to ensure complete occlusion of the bronchus. The diameter of the inflated balloon was set to be 1.5 times of the bronchus to obstruct the bronchus completely. In general, 1 mL of the mixture of contrast material and saline was used to inflate the balloon to 1.5 times of the size of bronchus. Prior to xenon-enhanced CT examination, the Davis catheter placed in the stomach was removed to avoid artifacts.
Xenon-Enhanced Dynamic Dual-Energy CT Protocol
Dynamic dual-energy scanning was performed with dual source CT (Somatom Definition; Siemens Medical Solutions, Forchheim, Germany) at a 12-second interval for the 2-minute wash-in period and at a 24-second interval for the 3-minute wash-out period (13). The detailed parameters were as follows: a 512 × 512 pixel matrix, 14 × 1.2 mm collimation, 51 effective mAs at 140 kV and 213 effective mAs at 80 kV, pitch of 0.45, and gantry rotation time of 0.33 seconds. Images were reconstructed with soft tissue reconstruction kernel (D30f) and 1.5 mm thickness in 1.2 mm increments. Baseline unenhanced and dynamic xenon-enhanced CT were performed at a 12 cm thick section around the bronchial obstruction site.
During the wash-in period, a mixture of 60% xenon and 40% O2 was administered via a mechanical ventilator (Servo ventilator 900C; Siemens Elema, Solna, Sweden). The mechanical ventilator setting was identical to that reported previously (13). A CT scan was performed 1 hour after balloon inflation to check whether the collapse of the occluded segment had indeed occurred.
Image Post-Processing
Images were reconstructed with soft tissue reconstruction kernel (D30f) with section thickness of 1.5 mm. Four sets of images were generated: a 140 kV image, an 80 kV image, a mixed image, and a xenon map. Three sets of images were automatically generated from the CT scanner: an 80 kV image, a 140 kV image, and a mixed image. The mixed image was comprised of a combination of the 140 kV and 80 kV images using a weighting ratio of 3:7 of the 140 kV image to the 80 kV image on the CT console, resulting in an approximately 120 kV image which could be used as the conventional CT image. Using the image data of 80 kV and 140 kV, xenon maps were obtained with commercially available software of the lung perfusion blood volume application (Siemens Medical Solutions, Forchheim, Germany) (11). Material parameters were adjusted for xenon extraction as follows: -990 Hounsfield units (HU) for air at 80 kV; -1000 HU for air at 140 kV; 70 HU for soft tissue at 80 kV; 54 HU for soft tissue at 140 kV; 1.95 for relative contrast material enhancement; and 10 for the range. Mean densities were measured for each data set.
Image Analysis
Quantitative analysis of xenon maps was selected by a chest radiologist among dynamic xenon maps images obtained at the same anatomic level. Regions of interest (ROIs) with the same size and same location were placed at the selected dynamic xenon maps using the copy and paste function on a Picture Archiving and Communication System workstation (Radmax; Marotech, Seoul, Korea) with 2048 × 1536 pixel 20.8 inch monochrome liquid crystal display monitors (ME315L; Totoku Electric, Tokyo, Japan). ROIs covered the entire corresponding parenchyma with patent airways and with occluded airways as large as possible. Corresponding parenchyma belonging to the occluded bronchus was determined by meticulously tracing occluded bronchus on axial, sagittal, and coronal reconstructed images. From the time-attenuation curves of those ROIs, ventilation parameters were calculated by another observer using an in-house software. After subtracting baseline attenuation from the mean attenuation of each region of each time point, each regional wash-in and wash-out time-attenuation curve was fitted to a single compartment exponential model (Kety model) (18) using a nonlinear least-squares curve-fitting procedure. The wash-in period for calculation was defined as the period until peak attenuation was reached. In the occluded lung parenchyma of pigs, each wash-in curve was analyzed from the starting point of the time attenuation curve to the point of peak attenuation. Parameters of magnitude of ventilation (A value), maximal slopes, and velocity of ventilation (K value) of ROIs were calculated as previously described (13). Briefly, the magnitude of ventilation (A value) indicated the amount of enhancement of xenon gas present in the lungs at time infinity. Velocity of ventilation (K value) was the rate constant representing specific ventilation. Time-to-peak (TTP) enhancement was defined as the time point when maximal xenon enhancement was reached.
Statistical Analysis
Wilcoxon matched-pairs signed rank test was used to compare the ventilation parameters between patent and occluded parenchyma in both animals. In terms of between-parenchyma differences in ventilation parameters, two kinds of difference values were calculated: 1) absolute difference representing subtraction values of the occluded lung from those of the patent lung; and 2) normalized percentage difference indicating values of the absolute difference divided by those of the patent lung and multiplied by 100. Mann-Whitney U-test was used to compare absolute and normalized percentage differences in ventilation parameters between both animals. All statistical analyses were performed with statistical packages (SPSS 19.0; IBM Corporation, Armonk, NY, USA). Differences were considered statistically significant when the p value was less than 0.05.
RESULTS
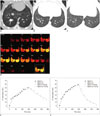
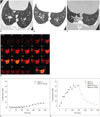
Wash-in and wash-out values in both patent and occluded segments based on the Kety model could be successfully calculated in all eight dogs (Fig. 1). In pigs, although wash-in values of patent and occluded segments could be calculated in all six pigs, wash-out values of occluded segments could not be obtained in two pigs because CT attenuation increased continuously even during the wash-out period (Fig. 2). Collapse of the occluded lung segment did not occur in any dog. However, complete collapse did develop in six pigs one hour after balloon occlusion.
Results of ventilation parameters between patent and occluded lung parenchyma in both animals with bronchial occlusion are summarized in Table 1. In the dog model of bronchial occlusion, peak enhancement and maximal slopes during both wash-in and wash-out periods tended to be lower in the occluded lung parenchyma than in the patent lung parenchyma. However, the difference was not statistically significant (p > 0.05). In addition, ventilation parameters between patent and occluded lung parenchyma in dogs did not show significant difference (p > 0.05). On the contrary, in the swine model of bronchial occlusion, all values of ventilation parameters except the K value during the wash-out period showed significant (p < 0.05) differences between the occluded lung parenchyma and the patent lung parenchyma. Maximal attenuation, maximal slopes during the wash-in and wash-out periods, and K value at wash-in were significantly (p < 0.05) lower in the occluded lung parenchyma than in the patent lung parenchyma. TTP showed a significant (p = 0.027) delay in the occluded segment.
Absolute differences between the patent and obstructed parenchyma in maximal enhancement, maximal slope, and K value during the wash-in period as well as TTP was greater in pigs than in dogs (p < 0.05) (Table 2). However, absolute differences in maximal slope and K value during the wash-out period were not different between the two animals (p > 0.05). When normalized percentage differences between the patent and obstructed parenchyma were compared between both animals, there were significant (p < 0.05) differences in all ventilation parameters except K value during the wash-out period (Table 3).
DISCUSSION
This study demonstrated that significant differences in collateral ventilation between different species of animals could be quantified using xenon-enhanced dynamic dual-energy CT. Xenon-enhanced dynamic dual-energy CT could be used for predicting the prognosis after bronchoscopic lung volume reduction in patients with emphysema by quantitatively assessing collateral ventilation that might hinder the successful collapse of the nonfunctioning lung after the procedure. Furthermore, it can also be used to evaluate the functional status of other diseased lungs using quantitative ventilation parameters based on the Kety model.
Collateral channels in the normal human lung have been well described previously, including 1-2 µm interalveolar pores of Kohn (3), 30 µm bronchioloalveolar channels of Lambert (19), and 80-150 µm interbronchiolar channels of Martin (6). Resistance of the collateral channels in normal human lungs was found to be 260-3300 cm H2O/L/s (7, 20), which was approximately 100-500 times the resistance of the regular branching airways. On the contrary, collateral resistance in emphysema whereas airway resistance is typically increased may be as low as 5-16 cm H2O/L/s (1, 7, 20, 21), which is less than the resistance of regular branching airways. Therefore, airflow to some regions in emphysema may occur preferentially via collateral channels rather than through the narrowed airways (1). In addition, interlobar collateral flow can occur even in emphysema (7, 22). In fact, collateral ventilation has been shown to have a positive role in gas exchange in patients with various disease entities, including emphysema, bronchiolitis obliterans, and bronchiectasis or bronchial atresia. However, with the emergence of new bronchoscopic techniques for treating emphysema, its role has changed negatively. It has been explained as a cause of the failure of EBVs by producing segmental or lobar atelectasis in most patients (2).
Collateral ventilation has been previously assessed using several different methods, including postmortem ex vivo experiments (3, 6, 7, 8, 19, 20) and in vivo studies using bronchoscopic measurements (1, 17, 21, 23), 133Xe (24, 25), conventional CT (26, 27, 28), and xenon ventilation CT (13). However, most studies were limited to ex vivo experiments. A simple and accurate in vivo technique to measure collateral ventilation is needed to evaluate its therapeutic implication. Conventional CT can also indirectly assess collateral ventilation. Higuchi et al. (27) have evaluated the relation of interlobar collaterals proven by ex vivo assessment to radiological complete fissure. Their initial results were not promising. Completeness of fissure showed very low accuracy (52%) for the prediction of no collateral ventilation with positive and negative predictive values of 63% and 29%, respectively. However, preceding clinical studies (29, 30) reported that analysis of pulmonary fissure using CT had similar accuracy as endoscopic measurements of collateral ventilation. However, this evaluation is limited to a binary one either in the presence or the absence of collateral ventilation at the interlobar level, instead of quantifying the amount of collateral flow even though the amount of collateral ventilation is likely to be a continuous variable.
Recently, Herth et al. (23) evaluated the efficacy of the Chartis pulmonary assessment of collateral ventilations in predicting the outcome of EBV therapy for significant target lobe volume reduction. They found an overall accuracy of 75% with positive and negative predictive values of 83% and 71%, respectively. They explained that the collapse of the bronchial wall distal to the inflated balloon or large collateral channels could cause a reverse flow to the adjacent lobe as potential sources of false negative assessment. Even in the presence of collateral channels, 17% of collateral ventilation positive patients showed effective volume reduction. They assumed that this could be due to the relatively small caliber with high resistance. This suggests that the prediction of collateral ventilation is still challenging. In this respect, xenon-ventilation CT can play a complementary role in measuring collateral ventilation (13, 14).
Our study suggested the possibility of quantifying ventilation parameters according to different degrees of collateral channels. In canine model which represents good development of collateral channels, there was no significant difference in ventilation parameter. These results are in general agreement with those of a previous study by Chae et al. (13). A minor different point is that A and K values during the wash-in period of the occluded segment tended to be smaller than those of patent segments, although the difference was insignificant. The different location and size of the ROIs between our study and a study by Chae et al. (13) might have caused such discrepancy. Although big ROIs occupying the most occluded segment were used in our study, smaller ROIs were used in their study. Therefore, smaller ROIs may have the possibility to be located in central portions, thus decreasing xenon ventilation. In swine models with complete interlobular fibrous septa that cause poor development of collateral channels, we found obviously significant differences in ventilation parameters between patent and occluded lungs. Interestingly, we observed a continuous increase in CT attenuation during the wash-out period, even though the enhancement was minimal and its starting point was much delayed. Although it might be minimal, collateral channels might have attributed to this phenomenon. Several investigators have also observed a continuous increase in CT attenuation during the wash-out phase in diseased human lung parenchyma, including emphysema, bronchial atresia, or air trappings (11, 12, 14).
Our study has several limitations. First, because the Kety model was based on a single compartment model, it might not be the best to evaluate complicated dynamic collateral ventilation. Nevertheless, we used Kety model because it was the most commonly used model for evaluating pulmonary ventilation. Second, xenon was moderately soluble in blood (solubility coefficient = 0.115). Therefore, recirculated xenon in the returning blood flow might have partially influenced lung CT attenuation that was measured during the wash-in and wash-out periods (14). A previous study by Hoag et al. (31) found that there was no change in attenuation even over 5 minutes after xenon ventilation. They performed CT 1 minute and 5 minutes after ventilation with 60% xenon in mongrel canines after blocking either side of the main bronchus. Therefore, we believe that xenon enhancement of the occluded segment is mainly caused by collateral ventilation. Third, there could be an argument as to whether bronchial obstruction was indeed complete. However, assuming that bronchial occlusion was performed in an identical method in both animals and that the occluded lung segment collapsed 1 hour after bronchial occlusion in all pigs, we believed that complete bronchial occlusion was effectively performed in both animals. Fourth, we were unable to measure wash-out ventilation parameters in two pigs because of the continuous increase in xenon attenuation even during the wash-out period presumably via small collateral ventilations, resulting in the relatively short data of the wash-out period. Therefore, the number of animals in our study might be too small for adequate statistical work-up. Fifth, the xenon map generated by the three decomposition theory is a virtual image. The accuracy of xenon maps has not yet been validated. However, based on our phantom study, we believe that the effect of underlying lung tissue density on xenon attenuation in xenon enhanced images would be minor, even though the current dual-energy technique is not perfect. Sixth, high radiation exposure due to repetitive temporal scans can be problematic in actual clinical application. Although repetitive temporal scans were necessary for quantifying ventilation parameters, we found that the most significant difference was in the maximal enhancement between the two animal models. This suggests that a single phase of a wash-in period could predict the degree of collateral ventilation using measurement of simple xenon attenuation in the lung. Further validation studies are warranted to corroborate our findings. Sixth, the degree of collateral channels between dogs and pigs was not proven pathologically in our study. However, collateral resistance and the time constant in these animals have been well established previously, including 0.13-1.75 cm H2O/L/s for collateral resistance and 0.13-0.40 seconds for the time constant of dogs, and too high to measure for collateral resistance and 92-234 seconds for the time constant of pigs (1, 2, 17). Lastly, we selected canine and swine models of bronchial obstruction to represent extreme cases of the development of collateral channels. Further studies using swine models with emphysema might be necessary to validate the efficacy of xenon ventilation CT for detecting various degrees of collateral ventilation.
In conclusion, xenon-enhanced dynamic dual-energy CT could allow quantification of collateral ventilation and the detection of differences between canine and swine models of bronchial obstruction.


 XML Download