

 PDF
PDF ePub
ePub Citation
 Print
Print


INTRODUCTION
Asthma is a common chronic disorder of the airways that involves a complex interaction of airflow obstruction, bronchial hyper-responsiveness, and an underlying inflammation (1). Prevalence of asthma have increased significantly since 1960s, and asthma has been recognized as a major public health problem (2, 3, 4). These facts elevate the need for more comprehensive understanding about asthma.
Air trapping is a pathophysiologic term indicating retention of excess gas in all or part of the lung during expiration, and it is a hallmark of small airway dysfunction on imaging (5, 6, 7). Positive relationship between the severity of asthma and the extent of air trapping is well known, especially in the case of severe asthma (8, 9, 10). Regional air trapping can be readily seen on expiratory CT as areas of low attenuation, compared to inspiratory CT and other regions (7, 11, 12, 13, 14). However, mainly due to the complex respiratory motions of the lungs, it is difficult to find the corresponding area. Therefore, automatic lung registration methods that match and deform inspiratory CT to expiratory CT are much helpful in finding areas of regional air trapping (15, 16). This method allows quantification of air trapping and evaluation of regional progression after treatment (17).
For the quantitative assessment of air trapping, the subtraction density value between inspiratory CT and expiratory CT was usually suggested (16, 18). But this parameter misses information on inspiratory CT density and is not physiologic. Specific volume change was originally defined as regional ventilation parameter during inhalation in the patients with respiratory failure (19). One benefit of this parameter reflects original inspiratory CT density and expiratory CT density (19). Applying this advantage to evaluate air trapping during expiration, we might be able to expect more physiologic results.
The purpose of this preliminary study was to compare the extent of air trapping in healthy volunteers with those of asthmatics using pulmonary function test (PFT), quantitative data such as subtraction value, and specific volume change from corresponsive voxels of paired inspiratory CT and registered expiratory CT.
MATERIALS AND METHODS
Study Population
This retrospective study was approved by the Institutional Review Board of the Asan Medical Center (Seoul, Korea). Written informed consent was obtained from all patients.
Sixteen healthy volunteers (10 men, 6 women; age [mean ± standard deviation], 51.9 ± 11.6 years [range = 39-81 years]) and nine asthmatics (3 men, 6 women; age [mean ± standard deviation], 51.0 ± 5.8 years [range = 43-58 years]) were enrolled. Asthmatics were enrolled prospectively among patients who have stable asthma without viable emphysema or other combined diseases. All subjects had paired inspiratory and expiratory CT scans and performed a PFT on the same day or within one week after CT scans were obtained.
CT Protocol
Volumetric paired inspiratory and expiratory CT scans were performed in all patients. Inspiratory CT scans were obtained at the end of full inspiration, and expiratory CT scans were obtained at the end of forced expiration. All CT scans were obtained using 16-multidetector CT scanner (Somatom Sensation; Siemens Medical Systems, Erlangen, Germany). Scan parameters included 16 × 0.75 mm collimation, 100 effective mAs, 140 kVp, and pitch 1.0. Both scans were performed in a supine position. All CT scans were performed without contrast medium. The images were reconstructed using standard soft tissue kernel (B30f; Siemens Medical Systems) with 0.75 mm of thickness and 0.7 mm of increment.
Automatic Image Registration
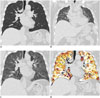
We developed an automatic non-rigid registration system to match inspiration and expiration CT (15, 17). Using this in-house software, volumetric paired inspiratory and expiratory CT images were automatically matched in every voxels. Method of automatic image registration consists of several steps. First of all, background, airway, lung parenchyma, and vessels were extracted using threshold range of Hounsfield unit (HU). The background area was removed in the threshold range of -1024 to -200 HU, and the airway was extracted in the threshold range of -1024 HU to -950 HU. The lung parenchyma was extracted by subtracting the airway. After segmentation and for the registration, the program aligned the two lung surfaces by using affine transformation algorithm. After that, locally deformable transformation model was developed for the subsequent non-rigid registration. Finally, expiration CT image was transformed to match paired inspiration CT (Fig. 1A, 1B, 1C) (15, 17).
Specific Volume Change and Quantitative Image Analysis
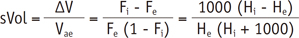
CT-measured regional specific lung volume change was introduced as an efficient surrogate for measuring regional ventilation (19). Originally, specific lung volume change was defined as regional ventilation during inhalation (ΔV, volume increase: Vai, Vae; air volume of region-of-interest [ROI] at end-inspiration and end-expiration: Fi, Fe; air fraction of ROI at end-inspiration and end-expiration: Hi, He; CT density of ROI at end-inspiration and end-expiration, respectively) (19).
To evaluate air trapping during exhalation, we simply modified and redefined specific volume change using the following equation with the new symbol, ΔSV:
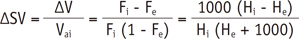
This redefined specific volume change (ΔSV) as regional volume change ratio during exhalation. Large amount of air was released during forced exhalation, but trapped air remained in the lungs. ΔSV was redefined for quantification of air trapping. In the case of complete air trapping, the volume, air fraction, and CT density of ROI at end-inspiration and end-expiration are theoretically the same value; so ΔSV would be 0. If all air was exhaled, He would be similar to 0 and ΔSV would be about 1. In the case of partial air trapping, ΔSV would range from 0 to 1. This indicates that the greater air trapping would produce the smaller ΔSV. Using this redefined ΔSV, in-house software calculated ΔSV value and generated color map using paired inspiratory and registered expiratory CT.
Mean lung density (MLD) of inspiratory CT and registered expiratory CT were calculated using HUs. Subtraction density value (Fig. 1D), which is HU difference between inspiratory CT and registered expiratory CT, was also calculated automatically. From the inspiratory CT data, the volume fraction below -950 HU (Vi950) and from the expiratory CT data, and the volume fraction below -856 HU (Ve856) were calculated for assessing the known threshold parameter for emphysema and air trapping (20). To assess air trapping, volume fraction of ΔSV below 0.4 (ΔSV0.4) and 0.5 (ΔSV0.5) and subtraction density value below 50 HU (ATI50) and 100 HU (ATI100) were calculated.
Using specific volume change, mean value was also calculated. As air trapping parameters, ΔSV0.4 and ΔSV0.5 were defined as volume fraction of lungs below 0.4 and 0.5 specific volume change, respectively.
For regional quantitative analysis, six areas of circle ROI of a 5 pixel radius were sampled from each healthy volunteers and asthmatics. A radiologist with 4 years of experience placed ROI on inspiration CT. Six sampled areas consisted of anterior and posterior areas at three different levels (aortic arch, left main bronchus, right inferior pulmonary vein level) of the right lung. Each location of the sampled area was defined as the center of area or structure; anterior and posterior sampled areas were located in the center of the anterior or posterior half right lung. In these anterior and posterior sampled areas, subtraction density and specific volume change were calculated. The subtraction value was calculated by subtracting the posterior sampled subtraction density from anterior sampled subtraction density. Ratio of ΔSV values of anterior to posterior lung was also calculated.
Visual Assessment of CT Images
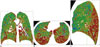
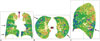
In all healthy volunteers and asthmatics, ΔSV map was generated by the in-house software as color map using rainbow spectrum. In asthmatics, color map pattern was visually assessed by two radiologists (with 20 years of experience in radiology). They were blinded to the results of PFT and asthma grade. If two radiologists had different opinions, conclusion was reached by consensus (Fig. 2). Visual pattern was classified into three patterns as follows: normal, disappearance of anterior-posterior gradient and geographic shaped defect patterns (Fig. 2).
Pulmonary Function Test and Asthma Severity
The spirometry was performed for evaluating following values: forced vital capacity (FVC), forced expiratory volume in 1 second (FEV1), ratio of FEV1 to FVC (FEV1/FVC), and mean forced expiratory flow between 25% and 75% of FVC (FEF25-75%). All PFT values were expressed as a percentage of the measured to the predicted value for age, sex, and height.
In asthmatics, severity of asthma was scored from 1 to 3 as follows: mild persistent asthma, moderate persistent asthma, and severe persistent asthma. The severity of asthma was evaluated by physicians at the time of CT scanning and was classified as mild, moderate, or severe based primarily on the Global Initiative for Asthma guidelines (21).
Statistical Analysis
Statistical analysis was performed using well-known statistical software (PASW Statistics 18; SPSS Inc., Chicago, IL, USA). The results were expressed as mean and standard deviation. The Mann-Whitney U test was used to evaluate CT data and specific volume change of paired inspiratory and registered expiratory CT. The Spearman test was used to evaluate correlation between clinical parameters of pulmonary function and air trapping indexes such as ATI100 and ΔSV0.5. A value of p less than 0.05 was considered as significant.
RESULTS
Global Quantitative Analysis
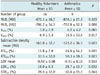
Table 1 gives summary of CT volume data and the specific volume change of paired inspiratory and registered expiratory CT between healthy volunteers and asthmatics. MLDi and Vi950 did not show significant difference. However, the parameters related to the expiratory CT and those obtained between inspiratory CT and registered expiratory CT, including air trapping indexes, showed significant difference between healthy volunteers and asthmatics. The values related to specific volume change, such as mean value of ΔSV, and air trapping indexes, such as ΔSV0.4, also showed significant difference.
Regional Quantitative Analysis
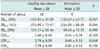
Table 2 gives the results of regional sampled CT data and specific volume change comparison between healthy volunteers and asthmatics. Only the posterior sampled ΔSV showed significant difference between healthy volunteers and asthmatics (p = 0.049). Other values such as anterior and posterior sampled subtraction density, difference value between anterior sampled subtraction density and posterior sampled subtraction density, and ratio of ΔSV values of anterior to the posterior lung did not showed significant difference.
Visual Assessment
Healthy volunteers showed normal anterior-posterior gradient. Of 9 asthmatics, 8 (88.9%) asthmatics' ΔSV map showed disappearance of anterior-posterior gradient. Five (55.6%) asthmatics' ΔSV map not only showed the disappearance of normal anterior-posterior gradient, but it also showed an abnormal geographic wedge shaped defect pattern (Fig. 3).
Correlation of Indexes with Pulmonary Function Test
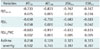
ATI100, ΔSV0.4, and ΔSV0.5 showed strong negative correlation and clinical significance with FEF25-75, FEV1, and FEV1/FVC. ATI50 showed strong positive correlation and clinical significance with FEF25-75 and FEV1/FVC, but not with FEV1. No indexes correlated with asthma severity. ΔSV0.4 and ΔSV0.5 showed completely same result and value (Table 3).
DISCUSSION
The results of this study demonstrate that specific volume change based on automatic image registration could quantitatively show and evaluate regional air trapping in asthmatics.
CT findings of asthma have been well known as bronchial wall thickening, bronchial luminal narrowing, and mosaic perfusion (22, 23, 24). Presence of air trapping involving more than a pulmonary segment on expiratory CT scans is also common and important in asthmatics (22, 24). One known method for evaluating CT air trapping is defined as the percentage of voxels below -856 HU in expiratory CT (14, 25). Another method of evaluating CT air trapping is using two-phase xenon-enhanced CT (26). Because these methods do not reflect the extent of hyperinflation on inspiratory CT, the ideal method of air trapping evaluation should be density change between paired inspiratory and expiratory CT. Due to the changes in body posture, complex respiratory motions of the lungs, and heart beating, the evaluation of paired inspiratory and expiratory CT has been difficult (15). Recently, an image registration method of aligning paired inspiratory and expiratory CT was proposed to overcome this problem, and our group also developed image registration method and applied to this study (15, 27, 28). There was no significant difference in evaluating the air trapping by visual assessment between with and without registration method. However, registration method allowed various parameters. In this study, we could quantify and measure the air trapping. It is a prospective method for the evaluation of regional or heterogeneous progression of air trapping, especially in the case of estimating treatment effects (17).
The limitation in subtracting expiratory CT density from inspiratory CT density is that it does not reflect baseline density or degree of lung expansion on inspiratory CT (14). One solution to this problem is assessment of change in regional specific volume (19, 29). Originally, this method was suggested for the evaluation of lung inspiration degrees with adult respiratory distress syndrome patients (29). In this study, we modified the originally defined regional specific volume change and the redefined parameter to evaluate the degree of lung expiration in asthma patients. The results were fairly promising.
One characteristic of CT of the lung was shown in the CT scans obtained from the patient in supine position, which was influenced by gravity effect (30, 31, 32). According to the gravity effect, regional ventilation was greater in the posterior, dependent part of the lung (33, 34). In our study, most of the asthmatics showed disappearance of gradient effect of ventilation. This suggests that more air trapping occurs in the posterior lung, as compared with normal volunteers who showed gravity effect in all cases. This result is consistent with those of Bankier et al. (32), which suggests the necessity for the evaluation of posterior lung in mild asthmatics. The parameters of regional anterior or whole lung would not be different in mild asthmatics, but posterior lung could be different due to regional air trapping. However, regional quantitative analysis showed that only ΔSV in posterior lung is statistically different. Other values representing the gravity effect, such as difference value between anterior sampled subtraction density and posterior sampled subtraction density and the ratio of ΔSV values for anterior to the posterior lung, failed to show statistical significance, although there is a consistent trend of more air trapping present in posterior lung in asthmatics. We speculate that it is probably due to the small sample size and sampling method. Further study with more patients and better sampling method is awaited.
As is well known, asthma is chronic inflammatory and obstructive disorder of the airways, and air trapping is locally heterogeneous (1, 35, 36). Therefore, air trapping could be more severe in distal area of the obstructive branch of airways. Interestingly, this study shows wedge-shaped areas of air trapping in three asthmatics. This result is a promising finding, and it is corresponding to the results of studies using helium ventilation MR or xenon-ventilation CT (37, 38).
There are several limitations in this study. First, a small number of patients might have decreased the statistical strength. However, this study reports preliminary results for the redefined specific volume change. In spite of the small number of patients, this study showed fully meaningful results. Second, in regional quantitative assessment, the definition of anterior, posterior, upper, middle, and lower lung was not clear. To objectify region selection, we defined standard position as the centers of anterior and posterior lung and the centers of standard structures. Small-circle ROI is another limitation. To avoid containing vessels and airway, choosing a large ROI was difficult. Third, threshold of indexs-ΔSV0.4, ΔSV0.5, ATI50, ATI100-were set arbitrarily. But in this study, these values were subjected to the availability of specific volume change and showed meaningful results. In spite of these limitations, this study clearly showed regional difference. In the future study, clearer definition of indexes threshold would show better results.
In conclusion, quantitative assessment of specific volume change shows the difference in the extent of air trapping between healthy volunteers and asthmatics, and it is correlated with PFT.
 XML Download