

 PDF
PDF ePub
ePub Citation
 Print
Print


INTRODUCTION
It is generally accepted that disruption of blood supply to the growing femoral head is a key pathogenetic mechanism of Legg-Calvé-Perthes disease (LCPD) (1, 2). Experimental deprivation of blood circulation by methods such as femoral neck ligation, arterial deprivation, venous drainage obliteration, or manipulation with hyper-abduction of the hip in skeletally immature animals could duplicate pathologic findings indicative of LCPD in children (3, 4, 5). A piglet model of hip ischemia is a well-established animal model of osteonecrosis because the hip anatomy of piglets is similar to that of humans. Histopathologic and radiographic changes using the piglet model have been shown to resemble those observed in human LCPD (4, 6, 7).
Skeletal ischemia of the proximal femur has been primarily evaluated by observing established sequelae of osteonecrosis such as epiphyseal collapse and deformation of the femoral head on plain radiographs. Early ischemic changes in the bone marrow can be demonstrated by abnormal signal change in magnetic resonance imaging (MRI) and abnormal uptake in bone scintigraphy (8). Several experimental studies demonstrated that diffusion MRI could be used as a biomarker of ischemic necrosis of the immature femoral head because water is organized around macromolecules. Tissue disorganization caused by ischemic injury would likely affect water diffusion (9, 10). Gadolinium-enhanced MRI has been used to demonstrate a lack of adequate blood flow in the femoral head in LCPD patients (11, 12). Dynamic contrast enhanced (DCE)-MRI has been utilized to extract kinetic parameters of bone perfusion. DCE-MRI was initially employed to depict tumor microvascularization (13, 14, 15). Its utility was then expanded to assess non-tumoral pathologies including synovial inflammatory diseases (16) and osteoporosis (17). Recently, peripheral bone microcirculation in the proximal femur has been studied with a focus on ischemic bone pathology (18, 19).
We hypothesized that arterial occlusion could cause LCPD-like pathologic changes in the femoral head. In addition, diffusion MRI and DCE-MRI could provide quantitative data related to tissue diffusion and microcirculation, thus allowing the monitoring of tissue ischemia and the perfusion-reperfusion status of the femoral head. The purpose of this study was to determine if diffusion MRI and DCE-MRI can depict early changes of perfusion and tissue damage in a model of femoral head ischemia induced by occlusion of the medial femoral circumflex artery in skeletally immature piglets.
MATERIALS AND METHODS
Animal Model
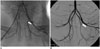
The experiment protocol was approved by the Institutional Animal Care and Use Committee of our institution. Piglets (n = 10) were 3-5 weeks old with weight of 5-8 kg at the start of the intervention. Thus, the skeletal maturity of them corresponded to that of a 3 to 5 years old child. Ischemia was induced by disrupting the arterial supply of the femoral epiphysis using an arterial embolization technique. Anesthesia was introduced through an intramuscular injection of 50 mg of ketamine hydrochloride (Ketalar; Yuhanyanghang, Seoul, Korea) and 20 mg of xylazine hydrochloride (Rompun; Bayer Korea, Seoul, Korea) at 0.5 mL per kilogram of the body weight. After induction of anesthesia, a 4-French (Fr) femoral arterial sheath was placed at the common femoral artery using Seldinger technique. With the use of the 4-Fr catheter, contrast medium was injected using a power injector at a rate of 1.5 mL/s. Digital subtraction angiography was performed. After confirming normal arterial anatomy (Fig. 1A), a 2.4-Fr tip microcatheter (Microferret; Cook, Bloomington, IN, USA) was advanced into the medial circumflex femoral artery of the contralateral lower limb. N-butyl-2-cyanoacrylate (NBCA) (Histoacryl; B. Braun, Melsungen, Germany) was used as an embolic agent. Prior to injection of the NBCA mixture, the microcatheter was flushed with a 5% dextrose solution to prevent premature polymerization of the mixture within the microcatheter. The NBCA mixture was injected using a 1-mL syringe under fluoroscopic monitoring. Post-embolization angiography was performed to confirm total occlusion of the arterial flow (Fig. 1B).
MR Imaging
MR imaging was performed at 3 T (Signa Expert, GE Medical Systems, Milwaukee, WI, USA) by using a pair of 3-inch receive-only surface coils at approximately 1 hour and 1, 2, 4 weeks after surgery. Axial T1-weighted spin echo images were obtained with a 20-cm field of view (FOV), 256 × 256 matrix, 2.5-mm slice thickness, a 500 ms repetition time (TR), and a 9 ms echo time (TE). Fast spin echo T2-weighted images were acquired with TR/TE of 2000/60 msec. Diffusion-weighted imaging (DWI) was performed using a b-value of 700 mm2/s. Four signals of 4-mm section thickness and 1.25-mm in-plane resolution were acquired. DCE-MRI was obtained after manual injection of 0.1 mmol/kg of gadopentetate dimeglumine (Magnevist; Berlex, Wayne, NJ, USA) into an ear vein. Detailed imaging parameters for DCE-MR perfusion imaging were as follows: TR/TE at 5.4/1.3 msec; flip angle at 15°; FOV of 16 cm; matrix of 200 × 200. Dynamic perfusion imaging was acquired every 55 seconds for a total acquisition time of 4 minutes 35 seconds. DCE-MRI was performed using the same section orientations as used for conventional MR imaging to cover both hip joints. After dynamic contrast enhanced study, post-contrast spin echo T1-weighted images (TR/TE, 500/9 msec) were also obtained.
MR Imaging Analysis
Dynamic contrast-enhanced magnetic resonance images were processed using the MR perfusion analysis method (nordicICE; Nordic Neuro Lab, Bergen, Norway), in which T1-weighted image was used for structural imaging. On the basis of 2-compartment pharmacokinetic model proposed by Brix, we used perfusion analysis method to calculate pharmacokinetic parameters. Pharmacokinetic modeling has been designed to offer information on the permeability between intravascular extracellular space and extravascular extracellular space (EES), extraction rate between EES and vessels, Kep (mL·min-1·100 mL-1), and EES volume fraction Ve (%). In addition, semi-quantitative parameters based on concentration-time curves such as peak enhancement (PE), time to peak (TTP), and wash-out (Washout) parameters were evaluated in femoral epiphysis. One pediatric radiologist manually defined the regions of interest (ROI) on the secondary ossification center of the femoral epiphysis. Perfusion parameters were extracted from the ROI. Signal intensities from all voxels within the ROI were averaged to generate a single time intensity curve characteristic of the regions. Apparent diffusion coefficient (ADC) was also calculated from the ADC map by free-hand drawing of the ROI on the secondary ossification center in the femoral epiphysis. The ADC value was presented as the average ADC value of the ROI.
Radiographic and Histologic Assessments
Animals were sacrificed arbitrarily at 1 week (n = 3), 2 weeks (n = 4), and 4 weeks (n = 3) following the induction of ischemic necrosis. The proximal part of the femur was dissected, examined visually, and radiographed as a whole using the Faxitron Cabinet X-ray System (Hewlett-Packard, McMinnville, OR, USA). The specimen was then fixed in 10% neutral buffered formalin for 2 weeks. Bones were subsequently decalcified in 25% formic acid until soft. The ends of bones were cut with a razor in the mid-coronal plane, photographed, and cut into smaller pieces to assess specific regions for structural changes. A pathologist evaluated the histopathological findings of the proximal femur by mainly focusing on the presence of osteonecrosis of the femoral epiphysis and cellular changes of the adjacent growth plate.
Statistical Analysis
All continuous variables did not follow a Gaussian distribution in Kolmogorov-Smirnov test. Diffusion and perfusion parameters of the ischemic areas were compared with those of the control areas using Wilcoxon-signed rank test. The ratio of these parameters to the contralateral areas ([parameters of ischemic femoral head - parameters of control femoral head] / parameters of control femoral head) was compared among 4 different time points using Friedman test. Comparisons of ratios between two time points were performed using the Wilcoxon-signed rank sum test. Statistical significance was considered when p value was less than 0.05.
RESULTS
Radiographic and Histopathologic Assessment
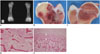
Femoral heads with arterial deprivation revealed no demonstrable deformity such as sclerosis, fragmentation, or collapse on plain radiographs (Fig. 2A). However, histopathologic changes were consistent with ischemic osteonecrosis in all involved femoral epiphysis at 2 weeks and 4 weeks after operation (70%, 7/10). No significant structural distortion was noted at 1 week after operation. Isolated bony trabeculae and empty lacunae were seen in the secondary ossification center. The surrounding growth plate showed decreased cellularity with an empty nest in the proliferative zone at 2 weeks after the operation (n = 4) (Fig. 2B-E). At 4 weeks after the operation, extensive intramedullary necrosis with collagen laying down was observed in the secondary ossification center and mild atrophy of the surrounding growth plate (n = 3).
Diffusion MR Imaging
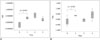
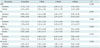
Apparent diffusion coefficient values in the secondary ossification center of the femoral head decreased in the ischemic hip during the immediate post-embolization period, rapidly increased during the 1-week postoperative period, and then maintained their levels until 4 weeks post-embolization compared to the control areas (Fig. 3A). ADC values of the control hips declined over time, which was consistent with previous reports (9). ADC values of the ischemic hip did not show statistically significant (p = 0.189) difference compared to those in the control hip (Table 1). The ADC ratio showed borderline significance (p = 0.086) of time interval changes. The ADC ratios obtained immediately and 1 week post-embolization showed a statistically significant difference (p = 0.043) (Table 2).
Perfusion MR Imaging
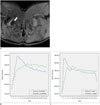
A representative time-intensity curve of the proximal femoral epiphysis in the immediate postoperative period and 1 week after operation is shown in Figure 4. PE of the femoral epiphysis decreased immediately after embolization and then increased 1, 2, 4 weeks after the procedure. PE showed a statistically significant (p = 0.042) difference compared to that of the control femoral head. TTP of the ischemic femoral head was delayed compared to that of the control areas (p = 0.048). The Ve of the ischemic femoral head was significantly (p = 0.036) higher than that of the control areas. Immediately after embolization, Washout was delayed and then recovered to a level similar to that of the control femoral head. The Kep was decreased immediately after embolization. It then became similar to that of the control femoral head (Table 1). Although changes in the perfusion ratio did not show statistically significant difference in the Friedman test, Kep values obtained immediately and 1 week post-embolization showed statistically significant (p = 0.043) difference (Fig. 3B, Table 2).
DISCUSSION
The hypotheses underlying this study were that arterial deprivation could cause LCPD-like pathologic changes in the femoral head and that DCE-MRI could be used to detect changes in perfusion patterns in skeletally immature femoral head that is related functionally to bone and cartilage remodeling. Previous vascular deprivation-induced osteonecrosis of a rat model demonstrated loss of normal shape and height in femoral heads that mimicked LCPD. In addition, necrotic debris was seen substituted by fibrous tissue (5, 20). Kim et al. (6) also reported similar histopathologic changes in the femoral head due to ischemia in a piglet model of femoral neck ligation. They demonstrated femoral head flattening and fragmentation as well as histopathologic changes of the growth plate (6). Femoral neck ligation model of osteonecrosis is different from our model of arterial deprivation because it also causes venous obstruction, subsequently raising intraosseous pressure. We postulated that lack of gross deformity of the femoral head in our study might be related to the preservation of venous drainage and early reperfusion through collateral vessels.
During the immediate postoperative period, the signal intensity-time curve showed decreased PE, delayed TTP, and prolonged Washout in the ischemic femoral heads. At that time, Kep as a rate constant between EES and blood plasma was decreased with restricted diffusion, suggesting that deprivation of the arterial supply could cause acute cellular swelling and restricted fluid shift from the EES into the intravascular extracellular space. At 1 week post embolization, PE increased with delayed TTP, suggesting spontaneous reperfusion through collateral channels. At that time, Kep of the ischemic femoral head became similar to that of the control femur with DWI showing increased diffusion, suggesting improved acute cellular swelling with increased intracellular water diffusivity and increased vascular permeability. At 2 weeks and 4 weeks after embolization, DWI showed persistently increased diffusion with high ADC compared to the corresponding values for the control femoral head. However, the perfusion parameter values became similar to those of the control femoral head at 2 to 4 weeks. These results are in consistent with those of previous studies (9, 10). Yoo et al. (10) mentioned that DWI imaging had a potential prognostic value in a patient with LCPD. Menezes et al. (9) reported that the diffusion changes may be a better indicator of femoral head damage than enhancement changes that may precede gross deformity.
In contrast to conventional contrast-enhanced MRI which simply displays contrast enhancement at a single point in time, DCE-MRI provides pharmacokinetic information. DCE-MRI is based on the acquisition of serial T1-weighted images before, during, and after administration of a gadolinium-based contrast agent. The resulting signal intensity-time curve can be used to extract quantitative information concerning fluid kinetics (21, 22). Contrast enhancement is linearly correlated to the concentration of the contrast materials in both blood and tissue. Blood flow can be estimated from the transit time of the contrast materials. Because signal enhancement is related to the perfusion of contrast materials and the blood flow, changes in tissue perfusion can be inferred from the signal intensity-time curves (23). Prolonged signal enhancement in the outflow phase has been associated with venous outflow obstruction, stasis, and decreased perfusion. Our signal intensity-time curves showed clear and significant differences in the outflow phase of contrast administration. Inflow parameters (slope and amplitude) changed, indicating that the delivery of contrast materials to the femoral epiphysis was disturbed. The outflow parameters including wash-out were significantly changed as evidenced by the difference in the slope of the outflow or wash-out phase on the signal intensity-time curves (24, 25). The intraosseous extravascular extracellular compartment of the immature femoral epiphysis is complex. It is comprised of several tissues, predominantly fat, hematopoietic bone marrow, compact bone, and cartilage. Gadolinium does not have access to all these compartments. The Ve (volume of the extravascular compartment) and Kep (a rate constant between EES and blood plasma) can be estimated from the pharmacokinetic model. These parameters are related to vascular permeability.
There are several limitations of our study. First, the number of experimental models was too small to achieve a strong statistical power in DWI and DCE-MRI variable as well as pathologic findings. Thus, a larger-scale study may reveal that those variables found to be insignificant in our study might be significant. Secondly, we could not reproduce an experimental model of LCPD that manifests fragmentation and collapse of the femoral head. A piglet model of a femoral neck ligation is a well-established model of the femoral head ischemia that mimics LCPD in children. In that model, both arterial and venous obstructions are induced through surgical exposure of the proximal femur and subsequent ligation of the whole vessels around the femoral neck. Our study was planned to evaluate early ischemic change of the femoral head using DCE-MRI and DWI. Therefore, we chose an arterial occlusion model rather than a surgical ligation model to avoid surgical artifacts on MR imaging. In our study, femoral-head fragmentation and collapse were not seen on plain radiographs, although ischemic tissue damage could be observed on pathologic specimens. Subsequent establishment of collateral circulation after occlusion of the medial femoral circumflex artery might prevent extensive necrosis or collapse of the femoral epiphysis. Another explanation would be that venous obstruction may be more important than arterial occlusion or at least have an additive effect to the arterial occlusion in the development of osteonecrosis in the immature femoral head. Thirdly, there was a technical limitation of contrast infusion. We did not use an automatic power injector due to the fragility of the vessels in the piglet, which might have limited the interpretation of pharmacokinetics in our experimental model.
In summary, an arterial occlusion model of femoral head ischemia induced ischemic tissue damage in the femoral head of immature piglets. Diffusion decreased immediately after ischemic insult, but soon increased and maintained a high level even after reperfusion developed. Vascular permeability increased early and spontaneous reperfusion of the femoral head occurred in the event of arterial deprivation. Therefore, diffusion MRI and a pharmacokinetic model obtained from the DCE-MRI data are useful in depicting early changes of perfusion and tissue damage in the model of femoral head ischemia in skeletally immature piglets.

 XML Download