

 PDF
PDF ePub
ePub Citation
 Print
Print


INTRODUCTION
Measuring thyroid nodules using ultrasonography (US) is widely performed in various clinical scenarios. During the follow-up period, change in nodule size is an indicator for nodule management, and biopsy is recommended for enlarged thyroid nodules according to major guidelines (1, 2, 3). After chemical or thermal ablation of thyroid nodules, volume measurement of thyroid nodule can be used to evaluate the treatment efficacy in response to the therapy (4, 5, 6, 7). In patients with initially detected thyroid nodules, accurate measurement of nodule size is also needed to guide management. Major guidelines suggest different nodule threshold sizes for fine-needle aspiration, depending on the suspicious US and clinical features (1, 2, 3, 8).
Inter-observer variations in thyroid nodule size measurement using US are controversial. Although some researchers reported with reliable results in the size measurement of thyroid nodule by using US (variation range of inter-observer volume = 5.1-6.6%) (7, 9, 10, 11), other researchers reported with wide inter-observer variations (volume variation = 48.6%; maximum diameter variation = 16%) (12). To the best of our knowledge, previous studies did not mention nodule margins or standardized measurement, both of which are important factors to consider when measuring nodules. Therefore, this study evaluated inter-observer variations in the measurement of volume and maximum diameter of thyroid nodules, by using US.
MATERIALS AND METHODS
Patients
This retrospective study was approved by the Institutional Review Board of Asan Medical Center, and informed consent was waved for the data evaluation. Written informed consent for routine thyroid US was obtained from all patients prior to each US examination. Between December 2012 and February 2013, 85 thyroid nodules (mean maximum diameter, 2.4 cm; range of maximum diameter, 1.2-4 cm; mean volume, 4.7 mL; range of volume, 0.43-25 mL) from 73 consecutive patients (mean age, 48.2 years; age range, 21-82 years) who underwent thyroid US were enrolled. Inclusion criteria were as follows: 1) patients with thyroid nodules > 1 cm in maximum diameter and 2) thyroid nodules with well-defined margins (3, 13). Thyroid nodules with ill-defined margins or an irregular shape were excluded, because measuring thyroid volume using the ellipsoid formula was inadequate in such cases. Thirty-five nodules (41.2%) were detected on initial US examinations without undergoing any prior procedures, 43 nodules (50.6%) were detected on follow-up after radiofrequency ablation for benign thyroid nodules, and 7 nodules (8.2%) were detected on follow-up after using ethanol ablation to treat benign thyroid nodules.
Nodule Volume and Maximum Diameter Measurement
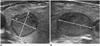
Two clinically experienced radiologists, including a faculty radiologist (with 19 years of clinical experience) and a fellow radiologist (with 6 years of clinical experience), performed all measurements. Both of these clinically experienced radiologists had performed > 2000 thyroid US examinations prior to this study. The US unit which was used to perform all examinations was one of the two following systems: an iU22 unit (Philips Healthcare, Bothell, WA, USA) or EUB-7500 unit (Hitachi Medical Systems, Tokyo, Japan) equipped with a linear high-frequency probe (5-14 MHz). The volume of thyroid nodule was automatically calculated using the ellipsoid formula ([length × width × height] × π / 6). Before performing this study, the radiologists discussed about standardizing the measurement method in order to obtain objective measurements. When measuring nodule size, we positioned the calipers at the outer margin of the halo of the nodule (Fig. 1) (14). The maximum transverse diameter was depicted on transverse US, and the width and height of the thyroid nodule were measured. The width was measured as the maximum transverse diameter, and the height was measured as the maximum anteroposterior diameter perpendicular to the width. The length of the thyroid nodule was measured as the maximum longitudinal diameter on longitudinal US images. After measuring the width, height, and length, the greatest value was defined as the maximum diameter.
For each patient, the two radiologists independently measured the diameter and volume of thyroid nodule on the same day. To evaluate inter-observer variation, the faculty radiologist waited outside of the room while thyroid US was being performed by the fellow radiologist. After the fellow radiologist measured the thyroid nodule and showed the nodule he had measured to the faculty radiologist, the faculty radiologist then measured it in the same manner without receiving any information about the previous measurement results. Each radiologist measured the diameters and calculated volumes twice in the same thyroid nodule, in order to determine the mean value.
Statistical Analysis
Inter-observer agreements of the volume and maximum diameter measurements between the two radiologists was assessed by using the Bland-Altman plots, and mean difference and the 95% limits of agreement (mean difference ± 1.96 standard deviations [SDs]) were determined. To determine if the absolute inter-observer difference increased as the thyroid nodule volume and maximum diameter increased, we obtained the Spearman's coefficient of rank correlation between the absolute difference and the nodule volumes and maximum diameters (i.e., mean values of two readers' measurements). Absolute difference was determined by merely flipping the lower half of the original Bland-Altman plots over the zero line and placing it onto the upper half. If a positive correlation existed on Spearman's coefficient of rank correlation, we standardized the measurement difference to the mean value, i.e., measurement differences in the percentage of the nodule volume or maximum diameter = absolute measurement difference / nodule volume or maximum diameter × 100 (%). Inter-observer agreements of the standardized volume and maximum diameter measurements between the two radiologists were assessed by using the Bland-Altman plots, and mean difference and the 95% limits of agreement (mean difference ± 1.96 SDs) were determined.
To evaluate whether the inter-observer variation differs according to size, the nodules were divided into two groups according to maximum diameter of ≥ 2 cm versus < 2 cm, as measured by the radiologists. The standardized (%) absolute inter-observer differences in the thyroid nodule measurements were compared between the two nodule size groups by using the Student's t test. This analysis was performed for both the volume and the maximum diameter. Statistical analysis was performed using commercial software packages (IBM SPSS Statistics for Windows, version 19.0, IBM Corp., Armonk, NY, USA; and MedCalc for Windows, version 13.3.3, MedCalc Software, Ostend, Belgium). In this study, p < 0.05 was considered to indicate a statistical significance.
RESULTS
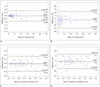
The Bland-Altman plots of measurements, which represent the relationship between the differences and mean values determined by the two radiologists, are shown in Figure 2. Regarding volumes, the mean difference and 95% limits of agreement were -0.06 mL and -0.88 mL to +0.76 mL, respectively; for maximum diameter, the mean difference and the 95% limits of agreement were -0.01 cm and -0.20 to +0.17 cm, respectively. Spearman's coefficient of rank correlation analysis revealed a statistically significant and positive correlation between absolute difference and mean value of volume and maximum diameter (volume, 0.694, p < 0.001; maximum diameter, 0.424, p < 0.001), thus indicating that the inter-observer variation increased as the volume and maximum diameter increased. The 95% limits of agreement between standardized volumes and maximum diameters measured by the two radiologists (i.e., measurement differences in percentages) were ± 13.1% and ± 7.3%, respectively (Fig. 2).
The standardized (%) absolute inter-observer differences in nodule volume measurement were greater among the nodules with a maximum diameter < 2 cm (mean value, 7.0%; SD, 4.9%) than nodules with a maximum diameter ≥ 2 cm (mean value, 5.1%; SD, 3.6%) (p = 0.035). Regarding maximum diameter, there was no statistically significant difference between nodules with a maximum diameter < 2 cm (mean value, 3.3%; SD, 3.1%) and nodules with a maximum diameter ≥ 2 cm (mean value, 3.1%; SD, 2.8%) (p = 0.511).
DISCUSSION
We here present the inter-observer variations in volume and maximum diameter measurements for well-defined thyroid nodules of > 1 cm in maximum diameter. Our findings indicate that the 95% limits of inter-observer agreement for standardized volume and maximum diameter are ± 13.1% and ± 7.3%, respectively. Inter-observer variation in volume measurement is greater among the thyroid nodules with a maximum diameter < 2 cm (mean value, 7.0%) than the nodules with a diameter ≥ 2 cm (mean value, 5.1%).
Previous studies demonstrated that the inter-observer variation in nodule volume measurement was 6.6% (9, 10, 11). In the previous clinical trial designed as a non-inferiority test, the non-inferiority margin was set as -8% for the volume reduction ratio. Any absolute value of the difference less than 8% could be considered to be merely within the US measurement variation (7). However, Brauer et al. (12) reported different results, which showed that the inter-observer variation in nodule volume was 48.6% and the variation in the maximum nodule diameter was 16%. The American Thyroid Association guideline was based on this study (1). This discrepancy in the inter-observer variation for nodule volume measurement between the studies was most likely due to several factors. First, we standardized the process for thyroid nodule volume measurement before beginning our analyses. We defined the width, height, and length of the thyroid nodule; and when measuring the nodule volume, we positioned the calipers at the outer margin of the halo of the nodule on US. Second, we excluded the nodules with ill-defined margins or an irregular shape, because these nodules were unsuitable for thyroid volume measurement using the ellipsoid formula. Third, our study enrolled patients with larger nodules than the previously reported studies. The proportion of nodules that were > 1.5 mL was 88% in our present investigation, versus 31% in a previously reported study (12). Fourth, each radiologist measured the thyroid nodule volume twice, and the mean value was calculated. Fifth, US was performed by clinically experienced, thyroid-dedicated radiologists who had performed > 2000 thyroid US examinations prior to this study. Finally, in a previous study, the observer did not know which nodules were measured by the other observer; but in this study, the first radiologist told the second radiologist which nodule had been measured. Because we perform follow-up thyroid US as a part of our routine clinical practice, which includes previewing US images and checking the nodule location and size, we believe that this study more closely resembles the clinical routine practice. We speculate that these factors might contribute to increase the reproducibility of our study, over that of the previous study (12).
When managing thyroid nodules, accurate and reliable measurement of nodule volume and diameter is important because changes in nodule size indicate the need for nodule management during the follow-up. Major guidelines suggest using repeat biopsy to evaluate the enlarged thyroid nodules, and serial US is recommended for detecting changes in the size of thyroid nodules during follow-up (1, 2, 3). Change in volume on US is one of the most important parameters for evaluating treatment efficacy, following the chemical or thermal ablation of thyroid nodules (4, 5, 6, 7).Therefore, there is a definite requirement for the accurate measurement of thyroid nodule size and volume on US.
Accordingly, although the Bland-Altman plots support the overall satisfactory inter-observer agreement on thyroid US, the frequency of volume differences seen in this study suggests that thyroid US may be limited in some clinical situations. When we compared variations according to maximum diameter, the inter-observer variation in nodule volume measurement was greater in nodules with a maximum diameter of < 2 cm. These results suggest that the inter-observer variation of thyroid US may be greater in patients with small nodules.
In addition to the limitations intrinsic to any retrospective study, other limitations should be mentioned. First, this study included no true measurement of thyroid nodule volume, because the primary objective of this study was to evaluate the reproducibility of US rather than the accuracy of its measurements. Therefore, instead of true volume, our study used the mean measured thyroid nodule volume and diameter, as assessed by 2 observers. Second, we reported that the inter-observer variation in thyroid nodule volume and maximum diameter measurement were 13.1% and 7.3%, respectively. As we are unsure if this value represents a clinically significant change in volume and maximum diameter, further studies are needed to evaluate this limitation.
In conclusion, our study found that any differences smaller than 13.1% and 7.3% for volume and maximum diameter, respectively, which are measured by using US on well-defined thyroid nodules > 1 cm should not be considered as a real change in size. This work permits reference data for monitoring size change of thyroid nodule during follow-up US.
 XML Download