

 PDF
PDF ePub
ePub Citation
 Print
Print


INTRODUCTION
The indocyanine green (ICG) retention rate at 15 minutes 530and the ICG clearance (ICG-K) are important indexes for estimating post-operative liver failure before hepatectomy (1, 2, 3, 4, 5, 6). A more reliable index for estimating post-operative liver failure is ICG-K of the future remnant liver (FRL) (ICG-Krem) and is calculated as the ratio of the FRL volume to the total liver volume (6, 7, 8).
Portal vein embolization (PVE) has been widely performed as part of pre-surgical management in patients for whom extended hepatectomy with a resection rate exceeding 50-60% is planned (2, 7, 8, 9, 10, 11). PVE expands the FRL volume by 20.5-69.4% (mean 37.9%) and reduces the risk of post-operative hepatic failure (12). Measurement of ICG-Krem is also useful in estimating FRL function after PVE (7, 8). However, liver function after PVE is heterogeneous and is caused by the worsening function of the embolized liver lobe. Because ICG-K is measured under the assumption that the uptake liver function is homogeneous in the whole liver, ICG-Krem might not provide an accurate assessment of FRL function after PVE.
Gadoxetic acid disodium (Gd-EOB-DTPA) is a paramagnetic hepatobiliary contrast agent that combines the features of extracellular agents with those of a hepatocellular contrast agent (13, 14, 15, 16). Gd-EOB-DTPA is taken up into hepatocytes through passive transport via receptors on the cell surfaces and is then excreted into the biliary tract (17). Gd-EOB-DTPA is widely used as a magnetic resonance (MR) imaging contrast agent to improve the detectability of focal liver lesions and for the characterization of liver tumors (14, 15, 16).
There have been several reports about the uptake of Gd-EOB-DTPA with transporting mechanisms (18, 19, 20). Recently, several studies have suggested that Gd-EOB-DTPA-enhanced MR imaging might be a useful method for quantitative evaluation of liver function in a manner similar to ICG-K (21, 22, 23, 24, 25). However, there have been few reports on evaluating FRL function using Gd-EOB-DTPA-enhanced MR imaging (22, 26). Heterogeneous uptake liver function, such as in patients who have undergone PVE, could be evaluated by the measurement of each area in the liver parenchyma by MR imaging.
The purpose of this retrospective study was to evaluate the role of relative enhancement (RE) in the hepatobiliary phase on Gd-EOB-DTPA-enhanced MR imaging as a preoperative estimate of FRL function in patients who underwent PVE.
Go to : 
MATERIALS AND METHODS
Study Design and Inclusion Criteria
This retrospective study was approved by the Institutional Review Board of our institution, and all patients provided written informed consent.
In this study, a two-step analysis was performed. For the first step, the correlation between ICG-K and RE imaging as a preoperative estimate of liver functional reserve was analyzed. For the second step, the role of RE imaging as a preoperative estimate after PVE was analyzed.
Inclusion criteria for the first analysis were patients who had undergone both Gd-EOB-DTPA-enhanced MR imaging and ICG-K test within a 30-day interval before a hepatic resection surgery. Additional inclusion criteria for the second analysis were patients who had subsequently undergone PVE, followed by repeat Gd-EOB-DTPA-enhanced MR imaging and ICG-K test performed within a 30-day interval before the hepatic surgery.
Patients
Between August 2009 and July 2013, the inclusion criteria for the first analysis were met by 53 patients (Fig. 1). The patients' characteristics (n = 53) were as follows: mean age (range) was 64.0 years (33-82 years); sex ratio (male/female) was 37/16; liver tumor ratio (primary liver tumor/metastatic liver tumor/biliary tract tumor) was 28/19/6 (Table 1). Primary liver tumor included hepatocellular carcinoma and intrahepatic cholangiocarcinoma. Biliary tract tumor included bile duct carcinoma and gallbladder carcinoma.
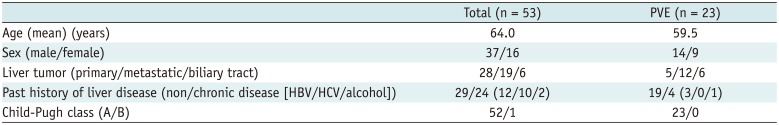
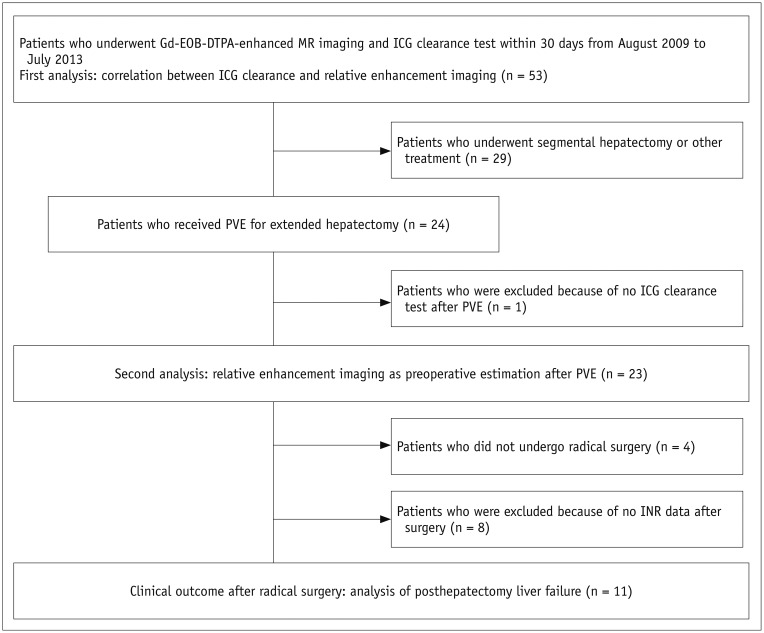
Table 1
Characteristics of Total Number of Patients (First Analysis) and Patients Who Underwent PVE (Second Analysis)
![]()
Twenty-four (45.2%) of the 53 patients underwent pre-operative PVE prior to an extended hepatectomy. However, one patient was excluded from the second analysis because the ICG-K test after PVE was not performed. Thus, 23 (43.3%) patients met the inclusion criteria for the second analysis (Fig. 1). The patients' characteristics in the second analysis (n = 23) were as follows: mean age (range) was 59.5 years (33-72 years); sex ratio (male/female) was 14/9; liver tumor ratio (primary liver tumor/metastatic liver tumor/biliary tract tumor) was 5/12/6 (Table 1). The mean interval between PVE and second MR imaging was 20 days, and the mean interval between PVE and second ICG-K test was 23 days. Twenty-six patients (49.1%) underwent segmental hepatectomy without undergoing PVE. Three patients (5.7%) did not receive either PVE or surgical intervention because of impaired liver function.
PVE
Portal vein embolization was performed under ultrasound guidance via the ipsilateral transhepatic approach. A mixture of ethanol and iodized oil at a ratio of either 5:1 or 10:1 was injected as embolic material with a 5.5-Fr or 5.2-Fr balloon catheter (MP balloon catheter from Terumo Clinical Supply, Kakamigahara, Japan). In only one patient, avoiding portal vein access through liver tumors was considered impossible; so, the contralateral approach was selected.
MR Imaging Techniques
Magnetic resonance imaging was performed with a clinical MR scanner using a superconducting magnet operating at 3.0-T (Signa HDxt from GE Healthcare, Milwaukee, WI, USA) and an eight-channel phased-array coil. Dynamic images using fat-suppressed T1-weighted gradient-echo images with a three-dimensional acquisition sequence (liver acquisition with volume acceleration) were obtained before and at 35 seconds, 90 seconds, 180 seconds, and 20 minutes after an intravenous bolus injection of Gd-EOB-DTPA (0.1 mL/kg body weight, Primovist, Bayer Schering Pharma, Berlin, Germany) using a power injector (Dual Shot GX, Nemoto Kyorindo, Tokyo, Japan). Hepatobiliary phase images were obtained after an intravenous bolus injection of Gd-EOB-DTPA for 20 minutes. The gain of the scan was uniformly fixed by using the value of the dynamic scan between the dynamic and hepatobiliary phase. The images were acquired in the transverse plane and had a section thickness of 3.8 mm (zero-fill interpolation: zip, 2). The repetition time/echo time was 3.1/1.4 seconds; the flip angle was 12°; the number of signals acquired was one; the field of view was 38 cm; the matrix was 256 × 224 (512 zip); and the acquisition time was 20 seconds.
Image Analysis
The RE images were acquired using two kinds of liver images: pre-contrast enhancement images and hepatobiliary phase images. The RE was defined as the percentage of signal gain between the pre-contrast images and hepatobiliary phase images, as follows:
SIH and SIP are the signal intensity in the hepatobiliary phase images of the liver and in the pre-contrast enhanced images of the liver, respectively. Therefore, the signal intensity of each pixel is the RE value in the RE images. The RE images were displayed by gradation handling of 256 colors using the National Institutes of Health color lookup table (Fig. 2A, B).
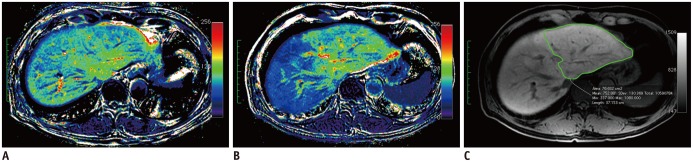 | Fig. 2Magnetic resonance imaging in patient with biliary cancer.
A, B. Relative enhancement (RE) images, before (A) and after (B) portal vein embolization (PVE). RE of embolized lobe decreased after PVE. This patient underwent right trisectionectomy. C. Defined regions of interest (ROIs) for remnant liver parenchyma without major vessels in hepatobiliary phase image after PVE.
|
Two radiologists (20 years experience with MR images; 13 years experience with MR images) consensually measured the RE value in the RE images. A region of interest (ROI) in the liver was acquired on every slice of hepatobiliary phase images, avoiding the major vessels and liver tumor using medical imaging software (OsiriX, ver. 2.7.5, Pixmeo, Geneva, Switzerland) (Fig. 2C). The ROIs were drawn on the RE images for RE value analysis. In the same way, the liver parenchymal volume (VL) was obtained by tracing the liver edge in each hepatobiliary phase image and summating each area.
The whole liver function as an index for the amount of RE per unit area could be assumed with the following formula: RE x VL, for which the value obtained was called the RE Index.
Correlation between Biochemical Tests Including ICG-K and RE Imaging as a Preoperative Estimation
Conventionally, segmental liver function was estimated by means of the ICG-K test and volumetry. A dose of 0.5 mg/kg ICG was administered intravenously, and a venous blood was sampled before and at 5, 10, and 15 minutes after ICG administration. ICG-K was calculated by linear regression analysis of the plasma ICG concentrations.
Indocyanine green clearance of the FRL was also calculated, as follows: ICG-K × FRL parenchymal volume (remVL) / total liver parenchymal volume (VL) (7).
We assumed that the RE imaging was suitable for the estimation of heterogeneous liver function from either the PVE or biliary obstruction more so than from the segmental liver. The total liver RE and the FRL RE (Rem RE) were calculated. Therefore, FRL function could be assumed with the following formula: Rem RE x remVL, for which the value obtained was called the Rem RE Index.
The correlations between ICG-K and the RE Index and the correlations between ICG-Krem and the Rem RE Index were analyzed as preoperative estimates prior to hepatectomy. Also, the correlation between the RE Index and other biochemical liver function tests, including total bilirubin, serum albumin, and international normalized ratio (INR), was analyzed.
RE Imaging as a Preoperative Estimation after PVE
As described above, ICG-Krem and the Rem RE Index were calculated for the preoperative estimate of FRL function after PVE. In addition, changes in remVL, ICG-K, ICG-Krem, Rem RE, and Rem RE Index before and after PVE were analyzed.
Clinical Outcomes after Surgery
Post-hepatectomy liver failure (PHLF) was evaluated in patients who underwent PVE. PHLF was defined according to the grading system of the International Study Group of Liver Surgery (ISGLS) (27). PHLF was characterized by an increased INR and concomitant hyperbilirubinemia (according to the normal limits of the local laboratory) on or after post-operative day 5 in this grading system. The severity of PHLF was graded based on its impact on clinical management. Grade A PHLF required no change in the patient's clinical management. The clinical management of patients with grade B PHLF deviated from the regular course but did not require invasive therapy. The need for invasive treatment defined grade C PHLF. Invasive procedures included hemodialysis, intubation and mechanical ventilation, extracorporeal liver support, rescue hepatectomy, and transplantation.
Radical surgery was performed in 19 patients. However, the examination of INR in the peri-operative period was not performed in eight patients; so, PHLF according to the ISGLS grading system could not be evaluated in those patients. Therefore, PHLF was evaluated in 11 patients (Fig. 1). Four patients did undergo radical surgery because of impaired liver function and tumor progression.
Statistical Analyses
Statistical analyses were performed using statistical software (SPSS, version 16.0; SPSS Inc., Chicago, IL, USA). The Spearman correlation coefficient was used to evaluate correlations between ICG-K and the RE Index, and between ICG-Krem and the Rem RE Index. Differences between pre-PVE and post-PVE in calculated values were tested by the Wilcoxon signed-rank test. Furthermore, the differences between patients with and without PHLF were analyzed by the Mann-Whitney test. Additionally, the Kruskal-Wallis test was used to evaluate the differences between patients without PHLF and with each grade of PHLF. Two-tailed p values of less than 0.05 were considered to indicate a significant difference.
Go to :
RESULTS
Correlation between Biochemical Tests Including ICG-K and RE Imaging as a Preoperative Estimation
The results obtained in the first analysis (n = 53) are shown in Figure 3. The ICG-K correlated with the RE Index in the total liver evaluation (r = 0.365, p = 0.007). The ICG-Krem strongly correlated with the Rem RE Index in FRL evaluation (r = 0.738, p < 0.001). Also, RE Index correlated with total bilirubin (r = -0.296, p = 0.031) and serum albumin (r = 0.317, p = 0.021). However, no correlation between RE Index and INR was observed (r = 0.008, p = 0.953).
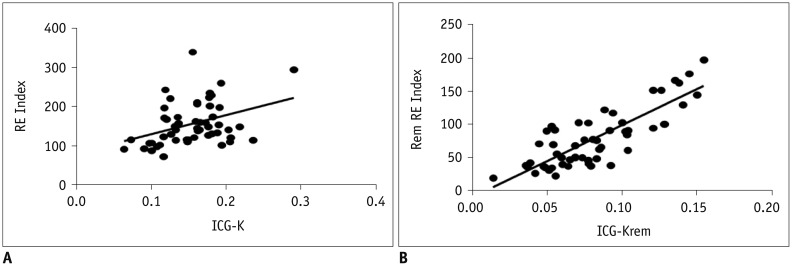 | Fig. 3Correlation between indocyanine green clearance (ICG-K) and relative enhancement (RE) imaging (n = 53).
A. ICG-K correlated with RE Index in total liver evaluation (r = 0.365, p = 0.007). B. ICG-K of future remnant liver (ICG-Krem) strongly correlated with future remnant liver (Rem) RE Index (r = 0.738, p < 0.001).
|
RE Imaging as Preoperative Estimation after PVE
The results of the second analysis (n = 23) are shown in Table 2. The remVL, ICG-K, ICG-Krem, and Rem RE Index significantly changed from before PVE to after PVE. However, no statistically significant change was observed in the Rem RE from before PVE to after PVE (p = 0.121).
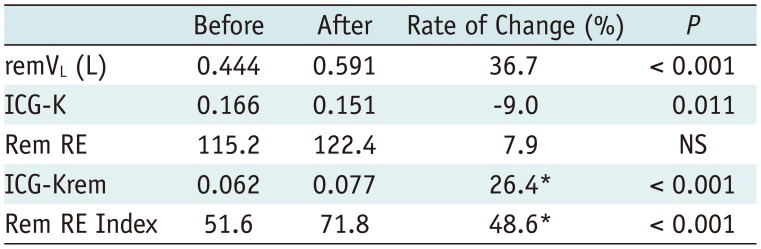
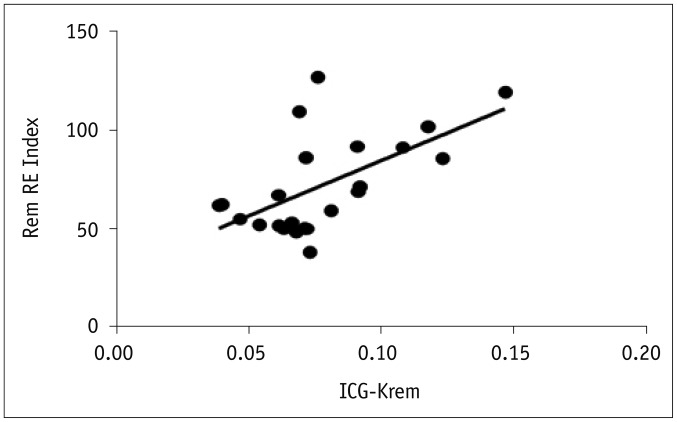
The Spearman correlation coefficient indicated that the ICG-Krem significantly correlated with the Rem RE Index after PVE (r = 0.508, p = 0.013) (Fig. 4). The Wilcoxon signed-rank test indicated that the rate of improvement of the Rem RE Index (48.6%) was significantly higher than that of the ICG-Krem (26.4%) (p = 0.014) (Table 2).
Clinical Outcomes after Surgery
The results of PHLF analysis (n = 11) are shown in Table 3. Seven patients had an increased INR and concomitant hyperbilirubinemia either on or after post-operative day 5, and, thus, they met the criteria for PHLF proposed by the ISGLS grading system. Of these 7 patients, 4 did not need specific treatment (grade A) whereas 3 required noninvasive treatment (grade B). The Mann-Whitney test indicated that the Rem RE Index of patients without PHLF (mean 101.8%, n = 4) was significantly higher than that of patients with PHLF (mean 62.4%, n = 7) (p = 0.023). Also, there was a significant difference, between patients with and without PHLF, with respect to ICG-Krem (p = 0.038). However, there were no significant differences, between patients without PHLF, grade A patients, and grade B patients, with respect to the Rem RE Index and ICG-Krem (p = 0.070 and 0.071, respectively). There was no post-operative mortality in the 19 patients who underwent radical surgery.
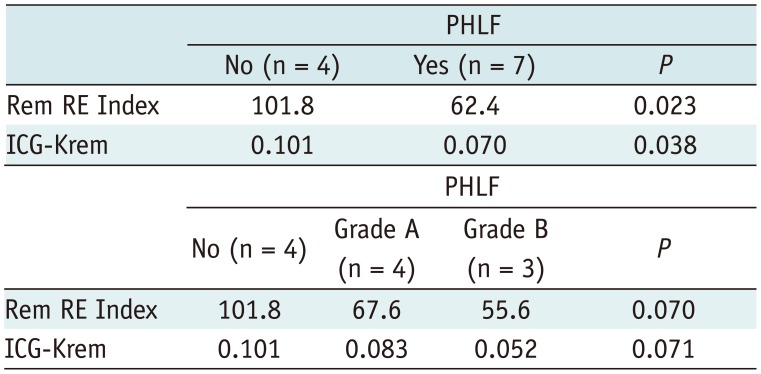
Table 3
Comparison of Preoperative Liver Function in Patients with and without PHLF According to Grading System of International Study Group of Liver Surgery
![]()
Go to :
DISCUSSION
Gadoxetic acid disodium is widely used as a liver-specific contrast agent to improve the detectability of focal liver lesions, and it has been one of the standard pre-operative imaging techniques for the imaging of liver tumors (14, 15, 16). Furthermore, there are several reports that Gd-EOB-DTPA can also be used as a tracer for liver function testing (21, 22, 23, 24, 25, 26). To obtain sensitive results of both hepatic tumors and liver functional reserve via a single imaging study would be very attractive.
There have been reports on the analysis of contrast agent accumulation in the hepatobiliary phase using a semi-quantitative approach relating liver signal intensity to splenic signal intensity (21, 22, 26). Such analysis can serve as an index for the hepatocellular contrast enhancement effect corrected by the extracellular fluid contrast enhancement effect approximated by the signal intensity of the spleen. In the present study, we assumed that the RE of the liver in the hepatobiliary phase mainly reflected the hepatocellular enhancement effect. Therefore, the RE was simply calculated as the percentage of signal gain between the pre-contrast images and the hepatobiliary phase images. Recently, the usefulness of the degree of liver parenchymal enhancement after Gd-EOB-DTPA administration was reported in a relatively large number of patients (24, 25) and in patients who underwent major liver resection (28). In these reports, the RE ratio was calculated using a method similar to that used in the present study. In addition, the signal intensity of non-enhanced images might be influenced by the patient's past history of liver disease. Therefore, we used RE imaging, which can evaluate changes in signal intensity between non-enhanced and contrast-enhanced images. Also, RE imaging with color display was used to visualize the uptake liver function. In the first analysis of our study, the RE Index correlated with ICG-K, total bilirubin, and serum albumin in total liver evaluation and the Rem RE Index strongly correlated with ICG-Krem in FRL evaluation. However, most patients had liver function of Child-Pugh class A and there was little difference in the INR value. So, no correlation between RE Index and INR was observed.
Pre-operative PVE was performed to reduce complications and surgery-related mortality in patients for whom extended hepatectomy with a resection rate exceeding 50-60% was planned (2, 7, 8, 9, 10, 11). PVE was sucessfully performed in all cases; the mean hypertrophy rate of FRL after PVE was 36.7% in our study and 37.9% in review data (12). However, four patients did not undergo subsequent hepatectomy because remnant liver function was found to be insufficient in two patients and tumor invasion was found to have progressed in two patients. No patients experienced post-operative mortality.
The usefulness of ICG-Krem in the estimation of FRL function has been reported (7, 8). The process for obtaining ICG-K assumed that the uptake liver function was homogeneous in the whole liver. However, liver function after PVE was heterogeneous because the function of the embolized lobe had worsened. Even if the function of the whole liver parenchyma without tumor were heterogeneous, heterogeneous and partial uptake liver function can be detected because the RE value is directly calculated by the ROI of each area in the liver parenchyma.
In the present study, the Rem RE Index strongly correlated with ICG-Krem in the estimation of FRL function; however, the rate of improvement of the Rem RE Index was significantly higher than that of the ICG-Krem after PVE. The reason for this finding was that ICG-K significantly decreased after PVE, which was caused by the worsening function of the embolized lobe. In contrast, the Rem RE did not change significantly from before PVE to after PVE. This result was supported by a previous study by Komori et al. (29) concerning hepatocyte morphology after PVE. The authors reported that hepatocyte hypertrophy was responsible for volume enlargement of the non-embolized lobe after PVE and that the number of hepatocytes was similar in the non-embolized lobes and in the normal liver.
Recently, Gd-EOB-DTPA-enhanced MR imaging for the assessment of liver failure after major liver resection has been reported (28). In that report, relative liver enhancement as a method of quantitative MR imaging analysis could help with the risk assessment for liver failure after major resection. In the present study, patients with PHLF had significantly lower median Rem RE Index than patients without PHLF. Although the sample size was small, from the viewpoint of the differences between patients with and without PHLF, the p value of the Rem RE Index (p = 0.023) tended to be better than that of ICG-Krem (p = 0.038). Therefore, RE imaging might be useful for predicting the risk of PHLF in patients who undergo PVE.
The present study had some limitations. First, the data were analyzed retrospectively and the sample size was relatively small, especially in patients after radical surgery. Because of the small sample size, we could not discriminate between patients without PHLF and patients with each grade of PHLF according to the ISGLS grading system. Second, there were no data on ICG-K after hepatectomy. A future study should compare the Rem RE Index and ICG-K after liver resection. Third, although a T1 map might be preferable for quantitative analysis of signal intensity of the liver parenchyma on Gd-EOB-DTPA-enhanced MRI, the present study was performed in a clinical setting, and, so, a T1 map was not constructed. The fourth limitation of the present study is that 15 to 20 minutes were required to trace the outlines of the liver because they were manually drawn. Automatic volume calculation software is indispensable for routine clinical use.
In conclusion, the present study indicated that RE on Gd-EOB-DTPA-enhanced MR imaging can be used to estimate FRL function in patients who undergo PVE.
Go to :
 XML Download