

 PDF
PDF ePub
ePub Citation
 Print
Print


INTRODUCTION
Digital tomosynthesis (DT) of the chest has emerged as a technically feasible imaging modality following the introduction of high-speed, self-scanning flat-panel detectors, and its use has resulted in improved detection of lung nodules (1, 2, 3, 4, 5) compared with that of conventional chest radiography. Nevertheless, few radiologists are familiar with DT, as it is a relatively new chest imaging technique.
Computed tomography (CT) is the gold standard for detection and follow-up of lung nodules. However, CT has several issues that remain to be solved, including high cost, time-consuming workflow, and radiation exposure. Moreover, patients with underlying malignant disease often undergo repeated CT and positron emission spectroscopy/CT scans to evaluate their disease status during follow-up. We hypothesized that if a substantial proportion of malignant nodules are also visible on DT, DT may be a good complementary imaging tool to evaluate pulmonary nodules. Although observer performance tests for detecting nodules using DT have been reported (1, 3, 5), there is a paucity of studies regarding the visibility of all lung nodules on DT based on a sophisticated reference standard set-up on thin-section CT.
In addition, the ability of readers' to interpret chest radiographs improves with increased education, training, and experience (6). Similarly, reading DT may also be influenced considerably by observer ability at reading DT images. Asplund et al. (7) reported on learning and potential pitfalls of detecting nodules on DT. They evaluated 89 identical DT cases before and after a learning session that included 25 cases with feedback. They showed significant improvement only in the performance of inexperienced DT observers; however, there was a potential risk for recall bias and an insufficient number of training cases. Therefore, we investigated the learning curve for detecting nodules on DT using a different study design in which we adopted an ongoing incremental learning strategy, with incremental unblinding after each reading session, as described in previous studies (8, 9). Furthermore, we also examined how education affects DT reading time.
Therefore, the aim of our study was to evaluate the visibility of nodules and the DT learning curves and reading times using scans from patients who underwent metastasectomy.
MATERIALS AND METHODS
This retrospective study was approved by the Institutional Review Board of Seoul National University Hospital. The requirement for written informed consent was waived for all patients.
Case Selection
A total of 129 patients underwent DT from November 2011 to August 2013 to evaluate lung nodules under a clinicians' request at our institution. Among them, 80 consecutive patients who satisfied the following inclusion criteria were included in this study: 1) patients who underwent both DT and thin-section chest CT prior to pulmonary metastasectomy and 2) the time intervals between CT, DT, and surgery were < 1 month. Enrichment of lung nodules and pathological proof were the reasons we selected patients who underwent pulmonary metastasectomy.
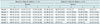
The study population consisted of 48 men (age range, 19-80 years; mean age, 58 ± 12 years) and 32 women (age range, 25-73 years; mean age, 53 ± 13 years). The mean time ± standard deviation between CT and DT was 12 ± 10.8 days. No established objective metric is available to rate the difficulty of DT cases. Therefore, an unblinded chest radiologist (with 5 years experience in thoracic imaging) rendered a subjective judgment as to the difficulty of detecting a nodule on a DT image. After carefully considering nodule conspicuity, nodule size, number, morphology, location, and overall image status (8), the cases were assigned an interpretation difficulty rating based on a 3-point scale: easy, moderately difficult, or difficult. Then, the cases were divided into four reading sessions such that there were a balanced number of cases with different difficulty scales in each session. The distribution of the DT findings across sessions is presented in Table 1.
CT Examination
Chest CT scans were performed using seven different multidetector CT systems (Acquilion ONE, Toshiba Medical Systems, Otawara, Japan; Somatom Definition and Sensation 16, Siemens Medical Solutions, Forchheim, Germany; Brilliance 64 and Ingenuity, Philips Healthcare, Cleveland, OH, USA; LightSpeed Ultra and GE Discovery CT 750 HD, GE Healthcare, Milwaukee, WI, USA) due to the retrospective nature of our study. All CT scans were obtained with automatic tube current modulation at a tube voltage of 120 kV, pitch of 1, and rotation time of 0.5 seconds. Axial images were reconstructed with a 1 or 1.25 mm section thickness and coronal images with a 3 mm section thickness. The mean effective dose was 4 mSv.
DT Examination
Digital tomosynthesis was performed with the VolumeRAD (GE Healthcare, Chalfont St. Giles, England). Detector position was fixed for DT acquisition within a time period of 11.4 seconds, while the X-ray tube moved continuously in a vertical direction around the standard orthogonal posteroanterior projection. Sixty low-dose projections, ranging from -30° to 30°, were collected at a tube voltage of 125 kV, with an additional 0.2 mm copper filter, and a 1:10 dose ratio at a source-to-image distance of 180 cm. Using these projection images, 39 section images were finally reconstructed with a 5 mm interval. The estimated radiation dose to a standard patient was 0.32 mSv.
Nodule Visibility
One chest radiologist (with 23 years experience in thoracic imaging) preoperatively annotated all nodules detected with identifiers on 1-mm thickness axial CT images with the aid of a computer-aided detection (CAD) system (Xelis; Infinitt Healthcare, Seoul, Korea) as part of our routine clinical practice. Subsequent surgery and pathological examinations are performed using these identifiers in our institution. Thereafter, one chest radiologist (with 5 years experience in thoracic imaging) correlated all resected nodules with their pathological results and identified the pathologically confirmed malignant nodules.
All nodules detected on 1 mm axial CT images were also identified on 3 mm coronal CT images using a three dimensional-localization tool on picture archiving and communication system (Maroview; Marotech, Seoul, Korea) software and served as the reference standard for the CT-visible nodules. The largest nodule diameters were measured in the axial plane. Two radiologists (with 23 and 5 years experience imaging, retrospectively) graded the visibility of all detected corresponding nodules on DT using a 5-point scale (0-4) in consensus. A score of 4 represented the highest degree of visibility (definitely visible), and a score of 0 represented non-visibility. All visible nodules (scores 1-4) were marked on DT images and served as the DT-visible nodule reference standard. The causes of invisibility for the non-visible nodules on DT were evaluated in five categories: small size ≤ 5 mm, far anterior or posterior location, apex or near diaphragm, central location, ground-glass opacity, and non-attributable.
Learning Curves and Reading Times
Six readers participated in the image review: three readers were board-certified chest radiologists, and three readers were radiology residents in our department. All reader's experience in radiology and DT are presented in Table 2. The six readers received a 1-hour training session for the first session 1 day prior to the image review. During this session, a PowerPoint presentation was used to explain the basic concepts and physics behind DT, and a review of recent relevant chest imaging literature was provided. Thereafter, readers gained experience by interpreting 10 selected DT training cases in which true-positive nodules were marked with "arrows". Two of the training cases were normal and eight included various sizes, numbers, and locations of nodules.
The 80 blinded DT datasets without true-positive marks and clinical information were divided into four groups of 20 cases each for the image review, and they were randomly mixed and presented in the same reading order for the six readers. The four groups were evaluated independently by the six readers during four 1-day sessions performed within 3 weeks. The readers were permitted to adjust window width and level. The readers were requested to mark nodules using an arrow and record the confidence level. Confidence for the presence of each marked nodule was graded on a 4-point scale, in which a score of 4 represented "a definite nodule", and a score of 1 represented "probably not a nodule" (5). Each nodule was marked on only one representative section image. Readers were instructed to ignore obvious calcified granulomas, postoperative scars, atelectases, and extrapulmonary lesions. The readers were also instructed to record their reading time for each session. At the end of each session, readers were unblinded to the true-positive markings on the DT images and instructed to self-review and analyze their own misreads for each case. Coronal reconstructed chest CT images were also provided so that readers could check the false-positive or false-negative findings, if necessary. After being unblinded and reanalyzing their images, the readers were allowed to advance to the next session until all 80 cases were done. Finally, an unblinded researcher gathered all marks and confidence levels and recorded all data on Excel spreadsheets for analysis. If any false-positive or false-negative results were observed in any reader's interpretation, reasons for the misinterpretation were also assessed through a review of the CT and DT images.
Statistical Analysis
Both per-nodule and per-region analyses were performed. The per-nodule analysis included calculating detection rates, false-positive cases, and positive predictive values (PPVs). Subgroup analyses were also performed for nodules ≤ 10 mm in size and for nodules > 10 mm in diameter.
The lungs were divided into twelve compartments for the per-region analysis, such that each lung included three areas of equal height (upper, middle, and lower) and each area was split into equally wide lateral and medial zones (10, 11, 12). Reader performance was calculated using a receiver operating characteristic analysis according to each interpretation session. Detection accuracy was measured according to the area under the curve (AUC) value. Subgroup analyses were done for regions located in the medial and lateral zones. We also investigated the effect of reader experience by grouping the readers into board-certified radiologists and radiology residents. The AUC values derived from the paired analyses were compared using the Hanley and McNeil (13) method, whereas comparisons of AUCs derived from the independent analysis were performed with z statistics. Statistical analyses were conducted using Medcalc Software (MedCalc, Mariakerke, Belgium). A p value < 0.05 was considered significant.
RESULTS
Nodule Visibility
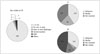
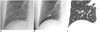
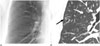
A total of 414 nodules were found on CT in the 80 patients. The mean ± standard deviation nodule size on CT was 5.9 ± 5.9 mm (range, 1-51.6 mm). The proportions of nodules with diameters ≤ 3 mm and ≤ 5 mm were 43% (177/414) and 64% (264/414), respectively. Of these, 257 nodules were resected, and 170 were pathologically confirmed to be malignant (metastasis, 169; primary lung cancer, 1). Among the 414 nodules detected on CT, 53.3% (221/414) were visible on DT (Figs. 1, 2). The mean ± standard deviation size of the 221 nodules visible on DT was 8.6 ± 6.8 mm (range, 1-51.6 mm). The proportions of nodules with diameters ≤ 3 mm and ≤ 5 mm were 19% (42/221) and 38% (84/221), respectively. In addition, the mean ± standard deviation sizes of the malignant (n = 143) and benign (n = 78) nodules were 10.3 ± 7.3 mm and 5.2 ± 4.2 mm, respectively. DT showed a substantial number of malignant nodules (84.1%, 143/170), and the proportion of malignant nodules to visible nodules on DT was significantly higher (64.7%, 143/221) than that on CT (41.1%, 170/414) (p < 0.001). The median visibility score was 3 (range, 2-4). The main reason for invisibility of the nodules on DT was their small size. All nodules not visible on DT were ≤ 10 mm, except one cavitary nodule (11 mm). About 93% (180/193) of the nodules were ≤ 5 mm. The invisibility of nodules > 5 mm was due to their far anterior or posterior location (n = 3), apical or juxta-diaphragmatic location (n = 3), central location (n = 2), ground-glass opacity (n = 1), and non-attributable (n = 4) (Fig. 3).
Learning Curves and Reading Times
Per-Nodule Analysis
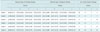
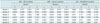
The results of the per-nodule analysis for individual readers in each session are shown in Table 3. Individual detection rates for the 221 nodules visible on DT ranged from 136 of 221 {0.62 (95% confidence interval [CI], 0.55-0.68)} to 158 of 221 (0.71 [95% CI, 0.65-0.77]). The inter-session comparison of individual detection rates revealed no significant differences, ranging from 43 of 68 (0.63 [95% CI, 0.50-0.74]) to 48 of 68 (0.71 [95% CI, 0.59-0.81]) during session 1 and 30 of 54 (0.56 [95% CI, 0.42-0.69]) to 39 of 54 (0.72 [95% CI, 0.58-0.83]) during session 4. Individual detection rates for the 143 pathologically confirmed malignant nodules ranged from 107 of 143 (0.75 [95% CI, 0.67-0.82]) to 121 of 143 (0.85 [95% CI, 0.78-0.90]). The inter-session comparisons of individual detection rates for malignant nodules also revealed no significant differences, ranging from 32 of 41 (0.78 [95% CI, 0.62-0.89]) to 36 of 41 (0.88 [95% CI, 0.74-0.96]) during session 1 and 27 of 39 (0.69 [95% CI, 0.52-0.83]) to 33 of 39 (0.85 [95% CI, 0.70-0.94]) during session 4.
Detection rates for nodules > 1 cm {13 of 16 (0.81 [95% CI, 0.54-0.96]) to 20 of 20 (1.00 [95% CI, 0.83-1.00])} within each session and for the entire study were significantly higher than those for nodules ≤ 1 cm {10 of 30 (0.33 [95% CI, 0.17-0.52]) to 24 of 34 (0.71 [95% CI, 0.53-0.85])}. However, the inter-session comparisons of detection rates for nodules ≤ 1 cm and nodules > 1 cm resulted in no significant differences (Table 4). The average detection rate for nodules > 10 mm was > 90% from the initial session and that for nodules ≤ 10 mm was only 60% in the last session.
The number of false-positive findings decreased from 18 to 3, 17 to 7, and 14 to 7 for readers 1, 2, and 4, respectively, within the first three sessions. In addition, the PPV increased for reader 1 {48 of 64 (0.75 [95% CI, 0.63-0.85]) to 32 of 35 (0.91 [95% CI, 0.76-0.98])}, reader 2 {47 of 64 (0.73 [95% CI, 0.60-0.83]) to 33 of 40 (0.83 [95% CI, 0.68-0.93])}, and reader 4 {43 of 57 (0.75 [95% CI, 0.62-0.86]) to 33 of 40 (0.83 [95% CI, 0.68-0.93])} within the first three sessions, but statistical significance was only reported for reader 1 (Fisher's exact test p = 0.037). The number of false-positive findings was the same for these readers between sessions 3 and 4. However, the number of false-positive findings for readers 3, 5, and 6 increased from 8 to 10, 4 to 12, and 10 to 24, respectively, from sessions 1 to 4.
Per-Region Analysis
Area under the curve values were > 0.8 in the initial session for all readers. The inter-session comparisons of individual AUC values revealed no significant differences (p > 0.05) (Table 5). A subgroup analysis of medial and lateral regions also indicated no significant differences in reader performance (p > 0.05). When we compared reader performance between board-certified radiologists (readers 1-3) and radiology residents (readers 4-6) after pooling, no differences in the AUC values were observed (p > 0.05).
Reading Times
Average reading times for each session were 61, 49, 48, and 51 minutes in sessions 1, 2, 3, and 4, respectively. The Mann-Whitney U-test revealed that readers reduced their reading time between sessions 1 and 4 (p = 0.045).
False-Positive and False-Negative Findings
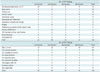
False-positive and false-negative nodules were considered present if they were marked by at least one reader. The causes for false-positive and false-negative findings were determined based on a retrospective review of the CT and DT images by one radiologist (Table 6). The numbers and causes of false-positive and false-negative findings did not differ across the four sessions (chi-square test, p = 0.31). A total of 136 false-positive findings were marked by the six readers during the four sessions. Of these, no demonstrable abnormality was identified at the corresponding location on the CT images of the 31 false-positive lesions. The major demonstrable causes for false-positive findings were central vessel (n = 31), bony lesion (n = 15), subpleural/pleural change (n = 13) and postoperative scar (n = 12). Peripheral vessels occasionally appeared as tiny nodular lesions on DT, particularly at their branching points (n = 9). A total of 113 false-negative nodules were missed by at least one reader. The majority of false-negative nodules on DT were due to small size, i.e., nodules ≤ 5 mm (69/113, 61%). Some nodules > 5 mm were missed presumably due to their location, particularly for the central (n = 20) and far basal locations (n = 9). Among the 113 false-negative nodules, 55 malignant nodules were included. Half of the false-negative malignant nodules on DT were due to small size, i.e., nodules ≤ 5 mm (28/55, 51%). The remaining half of the nodules > 5 mm were missed mainly due to their location, particularly the central (n = 13) and far basal locations (n = 7).
DISCUSSION
Our results show that chest radiologists and radiology residents with at least 3 years experience in chest radiography performed well during the initial session, following only a brief DT overview and education. The average detection rate for malignant nodules was 85% (210/246), and AUC values were > 0.8 in the initial session. The intersession comparisons of nodule detection rates revealed no significant improvement. However, a slight improvement in average reading time was noted, and the number of false-positive findings decreased gradually in half the readers, while the remaining readers showed no improvement in the number of false-positive findings. DT revealed the most malignant nodules > 5 mm and the probability of malignancy for visible nodules on DT was higher than that on CT.
We analyzed nodule visibility on DT based on a sophisticated review of thin-section chest CT images. James et al. (4) reported that 70% of nodules ≥ 3 mm in diameter are visible on DT, and Vikgren et al. (5) concluded that 92% of all nodules are visible on DT. However, neither study investigated the reason for the inability to visualize nodules on DT and did not correlate their findings with pathological data. Therefore, we also examined reasons for invisibility in addition to assessing a visibility score, and matched each nodule with a pathological result. According to our data, 53.3% (221/414) of nodules were visualized on DT. We identified all visible nodules on 1 or 1.25 mm section thickness chest CT images, with the aid of CAD, as a CT nodule reference standard. Therefore, a larger number and smaller size of nodules may have been detected on CT in our study (14, 15, 16). This result explains the lower proportion of visible nodules on DT in our data, when compared with previous studies. As most nodules > 5 mm were visible on DT and a large proportion of these nodules were malignant, DT could be a suitable alternative imaging method for detecting and following pulmonary nodules.
As DT has only been introduced recently, many radiologists may be not accustomed to reading DT. Until now, there is only one published article by Asplund et al. (7) considering learning aspects of DT, in which they evaluated reader performance for detecting nodules using the same DT cases before and after providing 25 training cases with feedback and six readers. Their results showed a significant performance improvement for gastrointestinal radiologists and medical physicists, but no improvement by three experienced thoracic radiologists and one radiology resident. To overcome recall bias, we distributed 80 different training cases with incremental blinding to three thoracic radiologists and three radiology residents in our study. Our results are consistent with a previous report (7), indicating that radiology residents and thoracic radiologists achieve a high-level of performance beginning in the initial session before receiving additional training or learning and only after receiving a brief overview of DT and 10 training cases. Therefore, adequate experience reading chest radiographs with short instruction on basic DT concepts and use may be sufficient for reading DT. Further improvements were difficult due to the inherent limitations of DT, particularly its limited z-axis resolution. Many tiny nodules ≤ 5 mm remained difficult to detect, and some central vascular shadows or bony lesions were often confused with true positive nodules even after 80 training cases.
Until now, no established guidelines have been proposed to utilize DT with chest radiography and CT in a clinical setting (2). DT may be more useful than CT, as it detected a higher percentage of malignant nodules. In addition, the reported DT radiation dose is 20-30 times lower than that of a standard-dose chest CT and can visualize 70-90% of nodules detected on CT (3, 4, 5). However, some clinicians may suggest that radiation dose is not a critical issue in patients who have an underlying malignancy, whereas others may argue that low dose or ultra-low dose chest CT may be better options for detecting nodules at a low radiation dose. Nevertheless, DT has clear advantages over CT for these patients, as it improves clinical workflow at a lower cost. Therefore, DT may be able to replace a proportion of CT examinations and reduce the number of repeated surveillance CT scans for malignant lung nodules. Many efforts are being made to demonstrate the potential of chest DT in various fields (1, 17, 18, 19, 20, 21, 22, 23, 24). Further studies validating the integration of DT into thoracic radiology clinical practice are warranted.
There are some limitations to our study. First, our study cohort consisted of patients with multiple nodules who underwent a metastasectomy. Therefore, the sensitivity and false-positive rate in our study may not reflect diagnostic accuracy in a clinical setting. Second, the DT training was based on self-learning and self-feedback. To overcome this limitation, readers were instructed to carefully evaluate and analyze their nodule markings. In addition, corresponding coronal CT images were distributed if there was disagreement for the presence of a nodule on DT or if there was a need to determine the cause for false-negative or false-positive findings. Therefore, we believe that readers can analyze their own misreads correctly without a special trainer.
In conclusion, most malignant nodules > 5 mm were visible on DT, and the probability of malignancy for visible nodules on DT was higher than that on CT. As nodule detection performance was high beginning in the initial session, DT may be readily applicable to radiology residents and board-certified radiologists as a complementary imaging tool to detect pulmonary nodules in patients with malignant disease.


 XML Download