

 PDF
PDF ePub
ePub Citation
 Print
Print


INTRODUCTION
Cardiac magnetic resonance (CMR) imaging is considered to be the 'gold standard' for measuring cardiac volumetrics and mass, offering the ability to track changes in ventricular metrics with low interobserver variability (1, 2, 3, 4, 5, 6). Theoretically, papillary muscles and trabeculae should be excluded from the cavity for volume analysis and included in the mass for mass analysis. However, as this is a time-consuming and difficult process, an alternative method of including papillary muscles and trabeculae in the cavity has been introduced for faster volumetric analysis (7). A study by Papavassiliu et al. (8) demonstrated that the influence of trabeculae and papillary muscles on measurement ventricular volumes was of marginal importance in individuals with normal cardiac anatomy or a dilated heart. They also found superior reproducibility of left ventricular (LV) measurements with the inclusion of trabeculae in the cavity volume. For these reasons, in the clinical setting, the inclusion method is currently widely used even though excluding structures from the blood cavity is the standard method of LV volume analysis (7).
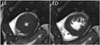
However, while it is true that differences in ventricular volumes and function, whether papillary muscles and trabeculae are included or excluded, may be small and unlikely to influence clinical decision making in individuals with normal cardiovascular anatomy or heart failure (7, 8, 9), the method used to draw the endocardial border relative to the trabeculae and papillary muscles may matter much more when these structures are hypertrophied such as in patients with hypertrophic cardiomyopathy (HCM). Furthermore, the inclusion method cannot guarantee superior reproducibility in patients with HCM as papillary muscles and trabeculae are also hypertrophied and abundant, and therefore are more difficult to discern from compact myocardium (Fig. 1). Indeed, in our clinical practice, we often found it challenging to determine the border between the compact myocardium and trabeculae at the end-systole (ES) phase as the trabeculae appear to combine with the compact myocardium during systole, becoming practically indistinguishable. Currently, in determining the endocardial border for left ventricular volumetry in HCM patients, some outline the trabecular boundary assumed on short-axis cine images while others draw a much smaller circle based solely on the cavity and closely adjacent trabeculae.
To our knowledge, there has been no study addressing this issue of CMR volumetric analysis methods in HCM patients. Therefore, in this study, three different methods of cavity delineation were analyzed: two different inclusion methods and one exclusion method. We sought to assess the effect of papillary muscles and trabeculae on CMR ventricular volume analysis according to three different methods of cavity delineation in patients with HCM, and to evaluate the interobserver reproducibility of each method.
MATERIALS AND METHODS
Institutional Review Board approval was obtained, and the requirement for informed consent was waived owing to the retrospective nature of this study.
Patients
Between October 2009 and September 2010, 22 consecutive patients with HCM underwent CMR at our institution. The diagnosis of HCM was based on the echocardiographic manifestation of maximal LV wall thickness ≥ 15 mm in the absence of another cardiac or systemic disease potentially responsible for cardiac hypertrophy (10). Among them, two patients with mitral regurgitation on echocardiography were excluded from the study. Finally, twenty patients (14 men and 6 women; average, 59.1 ± 12.2 years; range 24-78 years) with HCM (five with apical HCM, seven with septal HCM, six with septal and apical mixed HCM, and two with diffuse HCM) constituted our study population.
Cardiac MR Acquisition
All MR imaging examinations were performed with a 1.5-T unit (Sonata Magnetom; Siemens, Erlangen, Germany) using a phased-array body surface coil. MR images were acquired during repeated end-expiratory breath holds and were electrocardiographically gated. After localizer imaging, cine true fast imaging with steady-state precession imaging (TrueFISP, repetition time/echo time, 2.2/1.1 ms; flip angle, 80°; typical pixel size, 1.6 × 1.3 mm; slice thickness, 6 mm; slice gap, 4 mm; and temporal resolution, 44 ms) was performed in three long-axis planes (two-, three-, and four-chamber views) of the heart. Ten to eleven parallel short-axis sections per patient were obtained starting from the mitral annulus, covering the entire left ventricle for volumetric analysis. The most basal section was precisely adjusted to be perpendicular to the mitral annulus plane at 4-chamber and 2-chamber end-diastole (ED) phases in each patient.
Velocity-encoding cine CMR imaging with free breathing and retrospective electrocardiogram gating (repetition time/echo time, 2.2/3.2 ms; flip angle, 30°; typical pixel size, 1.6 × 1.3 mm; slice thickness, 5 mm; number excitation, 2; and temporal resolution, 41 ms) was performed in a plane orthogonal to the ascending aorta during free breathing.
Cardiac MR Analysis
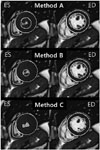
All measurements were independently made by two blinded, experienced radiologists (with 10 years and 7 years of experience in interpreting cardiac MR, respectively). LV function and mass were manually analyzed on personal computers using dedicated software (QMASS MR; Medis, Leiden, the Netherlands). Cine loops were reviewed, and ED and ES frames were identified. The most basal section needed to show at least a 50% visible myocardial circumference at the mitral valve level to be included. Epicardial and endocardial contours were manually traced from the most apical to the most basal slice using three methods: with LV trabeculae included in the cavity volume (methods A and B), or excluded (method C) (Fig. 2). For methods A and B, papillary muscles and trabeculae were included in the cavity volume and excluded from the myocardial mass. In method A, the endocardial border was drawn to include the observed trabecular boundary with repeated reviews of the short-axis cine images, considered the classic method of inclusion (method A). With method B, the endocardial border was based solely on the cavity and closely adjacent trabeculae (method B) at the ES phase. In order to minimize the variability related to the manual tracing of epicardial borders, the boundaries of the epicardium during the tracing of the endocardium were left unchanged for the three methods. LV end-diastolic volume (EDV) and end-systolic volume (ESV), stroke volume, and ejection fractions (EF) were measured and corrected for the body surface area. LV mass was calculated from the average of the ED and ES myocardial volumes (the difference between the volumes enclosed by the epicardial and endocardial contours) multiplied by 1.05 g/mL.
As reference for stroke volume, the forward flow of ascending aorta was analyzed by an experienced radiologist (with 7 years of experience in interpreting cardiac MR) on velocity-encoding cine MR images using the QFlow software package (Medis, Leiden, the Netherlands) with manual contour segmentation.
Statistical Analysis
Left ventricular volume and mass calculated from the three different methods of cavity delineation were compared using a linear mixed effect model with Sidak's multiple comparison post-hoc test. The least-square means and standard error were provided. Distributions for all volumetric measures were examined, and stroke volume was close to normal distribution after log transformation. In addition, in order to show the deviation between each comparison of two methods, the absolute difference (method 1 minus method 2) and percentage difference (subtraction of two methods divided by their average, multiplied by 100) were calculated. In order to assess the accuracy of LV stroke volume in comparison with the ascending aorta forward flow (AAFF) as a reference in each method, four statistical analyses were used: 1) Bland-Altman analysis yielding the mean difference (difference ± 1.96 standard deviations) and corresponding 95% confidence intervals, 2) Wilcoxon signed rank test for comparison of mean values between AAFF and LV stroke volume, 3) absolute percentage error (APE) calculated as 100 × (LV stroke volume - AAFF) / AAFF (11), and 4) the Friedman test for checking overall differences in absolute percentage errors among the three methods and Scheffe's correction for multiple post-hoc analysis. Thereafter, comparison of LV mass between ES and ED phases was performed using the nonparametric paired t test (Wilcoxon signed-rank test). Lastly, interobserver reproducibility was assessed using intraclass correlation coefficients (ICCs). The statistical significance of differences in ICCs among the three methods was tested using Fisher's Z-test with Sidak correction for multiple comparison post-hoc analysis (12, 13). All statistical analyses were performed with statistical packages (SPSS for Windows, version 12.0, SPSS Inc., Chicago, IL, USA) and SAS statistical software (SAS system for Windows, version 9.2; SAS institute, Cary, NC, USA). Differences were considered statistically significant when the p value was less than 0.05.
RESULTS
Comparison of LV Measurements among the Three Methods
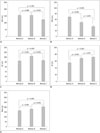
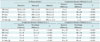
Table 1 demonstrates the LV measurements of the three different methods, and provides absolute and percentage differences between each comparison of two methods (Fig. 3). Significant differences in volumes, function and mass were observed between methods A and C. The percentage difference in EF between methods A and C was 25%. The percentage differences in EDV and ESV between methods A and C were also high, 25% and 68%, respectively. LV mass also showed a large difference of 20% between methods A and C.
Accuracy of LV Stroke Volume in Comparison with AAFF as the Reference Standard
The mean value of AAFF was 78.0 ± 15.7 mL. LV stroke volumes calculated by each method are demonstrated in Table 1. Compared to AAFF, the LV stroke volume calculated in all three methods was significantly larger: mean difference, 7.7 ± 12.2 mL for A (p = 0.01), 25.7 ± 17.8 mL for B (p < 0.001), and 7.7 ± 14.5 mL for C (p = 0.03) (Table 2). Methods A and C exhibited significantly smaller absolute percentage errors of stroke volume than method B (p < 0.001). There was no significant difference in APEs of stroke volume between methods A and C (p = 0.526).
Comparison of LV Mass between ES and ED in All Three Methods
There was no significant difference in LV mass between ES and ED phases in methods A and C (Table 3). Mean values of LV mass at the ES phase were significantly bigger than those at the ED phase in method B.
Interobserver Reproducibility and Their Comparison among the Three Methods
Intraclass correlation coefficient values for all parameters according to the three methods were more than 0.8 (Table 4). There was no significant difference between the methods.
DISCUSSION
Although CMR is currently considered the gold standard for measuring cardiac volumetrics and mass, we found in this study that the results were remarkably different depending on the method of LV cavity delineation used in patients with HCM. EDV and ESV showed big percentage differences, as much as 25% and 68% respectively, according to whether papillary muscles and trabeculae were included (method A) or excluded (method C). The percentage differences between these two methods were 25% for EF and 20% for LV mass.
The influence of papillary muscles and trabeculae on ventricular measurements in healthy subjects and patients with heart disease has been studied previously. Sievers et al. (7) and Papavassiliu et al. (8) both found that although there were small significant differences between the measurement methods, they may not be of much clinical relevance in healthy subjects or patients with heart disease. They observed an EF percentage difference of less than 4% in both healthy subjects and patients with heart disease. However, in their study, patients with heart disease predominantly suffered from ischemic heart disease and dilated cardiomyopathy, and no study had yet been conducted regarding whether those same results can be drawn for patients with HCM in which papillary muscles and trabeculae are abnormally hypertrophied. Our results demonstrated that the differences between the methods were much greater than previously observed in patients with HCM and were of clinical importance. In a previous study, Winter et al. (9) evaluated the effect of papillary muscles and trabeculae on right ventricular measurements in patients with systemic right ventricles when these structures are hypertrophied compared to individuals with normal cardiac anatomy. They found a mean absolute difference of 7.4% for EF, which is significantly higher than the 2% reported in the study by Papavassiliu et al. (8). In our study, patients with HCM showed an even greater absolute difference of 16% for EF.
Our study results indicate that radiologists should be aware of the striking discrepancy between these methods of cavity delineation during data interpretation in patients with HCM and thus should maintain a consistent method of endocardial cavity delineation when measuring volumetrics and masses for longitudinal follow-ups. As for which method would be most appropriate for patients with HCM for LV volumetrics, our study showed that although methods A and C gave very different values for mass, measurements of ED and ES myocardial masses were very similar within each particular method. Method B, however, gave very different values for mass between diastole and systole suggesting that different proportions of myocardium and papillary muscles were included within the two phases. In addition, the stroke volume for method B had the largest discrepancy with flow volume per beat measured within the ascending thoracic aorta. This implies that method B may not be appropriate for clinical practice. Both methods A and C also produced stroke volumes that were higher than the aortic forward flow. Possible explanations for this discrepancy were as follows: first, it may be due to the intrinsic limitation of LV measurement using 2-dimensional (2D) cine stacks. LV volume measurement using 2D cine stacks has a limitation in accurately evaluating transannular motion. Second, the turbulent flow of the ascending aorta may have led to the underestimation of the true AAFF (14, 15). However, the differences were minimal, less than 8% in both methods A and C and there was not a significant difference between the two methods. Therefore, it is difficult to recommend one method between methods A and C to be used for LV volumetrics in patients with HCM as there is no data showing method C to be more valid for attaining a 'true' value than method A, even though there are theoretical reasons for believing that this may be the case. Nevertheless, we believe that excluding structures (method C) may be more reasonable for volume and mass analysis in HCM patients in clinical practice for the following reasons. First, for a long time, there has been a belief that myocardial systolic function in HCM is normal and hyperdynamic although this concept is considered a 'myth' in the evidence that systolic dysfunction precedes the development of hypertrophy (16). Thus, inclusion of papillary muscles and trabeculae in the cavity volume might lead to a much lower EF than echocardiography, resulting in a big discrepancy between the two modalities. Second, HCM is a genetic cardiac disease characterized by hypertrophied non-dilated LV with reduced LV diastolic relaxation and compliance (17). Inclusion of papillary muscles and trabeculae in the cavity volume may result in much larger EDV and ESV than may be accurate. Third, LV mass has been proven to be a prognosticator in HCM (18, 19). Our study showed that the influence of papillary muscles and trabeculae on LV mass measurement was striking with a huge difference of 35 ± 10 g or 20 ± 4% between methods A and C. This value is much greater than that reported by Papavassiliu et al. (8), which showed a mean difference of 21 ± 12 g or 12%. In patients with HCM, including these structures in the volume may result in a significant reduction of myocardial mass with clinical relevance. Finally, one of the main reasons for the recommendation of the inclusion method for volumetry has been its superiority in interobserver reproducibility. However, in patients with HCM, endocardial cavity delineation is challenging even with the inclusion method as hypertrophied papillary muscles and trabeculae appear to combine with the compact myocardium at systole. Our study showed the lowest interobserver agreement for ESV using method A and no significant difference in interobserver reproducibility for all parameters were observed between the methods. Had we performed only one inclusion method without a clear definition of the delineation of the endocardial border, the interobserver agreement of ESV in the inclusion method would have been presumably even poorer. On the other hand, the limitation of the exclusion method has always been that it is time-consuming. Sievers et al. (7) demonstrated an analysis time twice as long (25 ± 4 minutes vs. 13 ± 3 minutes) using the exclusion method in 17 healthy subjects and 13 patients with coronary heart disease. In another study of 29 patients with systemic right ventricles, excluding structures also resulted in a significantly longer analysis time: 26 ± 4 minutes vs. 20 ± 3 minutes (9). Thus, the development of an accurate automatic contour detection tool for rapid left ventricular volume and EF assessment would be of great practical value and research into this technique is strongly warranted. Regardless of which method radiologists opt to use, in the least, considering the striking differences in measurements, a consistent method of LV cavity delineation should be used for longitudinal follow-up.
Besides the classic methods of inclusion or exclusion of papillary muscles and trabeculae, we added one more inclusion method (method B). However, we found a major weakness with method B in that in patients with HCM, papillary muscles and trabeculae are hypertrophied and abundant, and appear to combine with the compact myocardium at the end-systole phase, thus making it difficult to discern from the compact myocardium. Therefore, in clinical practice, radiologists tend to draw much smaller endocardial cavities at the end-systole phase than is accurate using the inclusion method. Indeed, we found that method B showed the greatest error in LV stroke volume using the forward flow of ascending aorta as a reference, and much greater ES LV mass than ED LV mass with a mean difference of 22.3 ± 13.6 g.
There are several limitations in this study. First, we were not able to test for accuracy as we measured LV parameters in vivo and it is impossible to obtain a gold standard for true volume, function and mass. Second, the sample size of 20 patients in our study is relatively small. However, we believe that significant differences in volume and function were observed. Papavassiliu et al. (8) found that only 12 patients were needed to establish a power of 90% for the comparison between the inclusion and exclusion methods, although there was a smaller difference in the results between the two methods. Third, we did not compare the analysis time between methods. Lastly, so that the effect of papillary muscles and trabeculae on LV measurements could be specifically assessed and other effects could be eliminated, we did not change the boundaries of the epicardium. Thus, reproducibility might be higher than may be in the real clinical setting for all three methods (20).
In conclusion, in patients with HCM, striking differences were observed for ventricular volumes, global systolic function and mass dependent on whether or not papillary muscles and trabeculae were calculated as part of the blood cavity. Therefore, a consistent method of LV cavity delineation is recommended during longitudinal follow-up to avoid misinterpretation of measurements and erroneous clinical decision-making. In addition, the inclusion of papillary muscles and trabeculae in cavity delineation did not show better interobserver reproducibility as previously reported.


 XML Download